Introduction
In the realm of data visualization, Power BI stands out as a transformative tool, particularly with its dynamic axes feature. This powerful capability allows users to create interactive reports that respond fluidly to input, making it easier to analyze time-sensitive data and extract meaningful insights. As organizations grapple with the challenges of report creation and data inconsistencies, mastering dynamic axes becomes essential—not just for enhancing user engagement, but also for empowering decision-makers to drive operational efficiency.
By integrating advanced techniques such as DAX formulas and Robotic Process Automation, teams can streamline their reporting processes, ensuring that the focus remains on actionable insights rather than tedious data preparation. This article delves into the intricacies of dynamic axes, offering a comprehensive guide to their implementation and best practices, ultimately equipping professionals with the tools needed to elevate their data storytelling and foster informed decision-making.
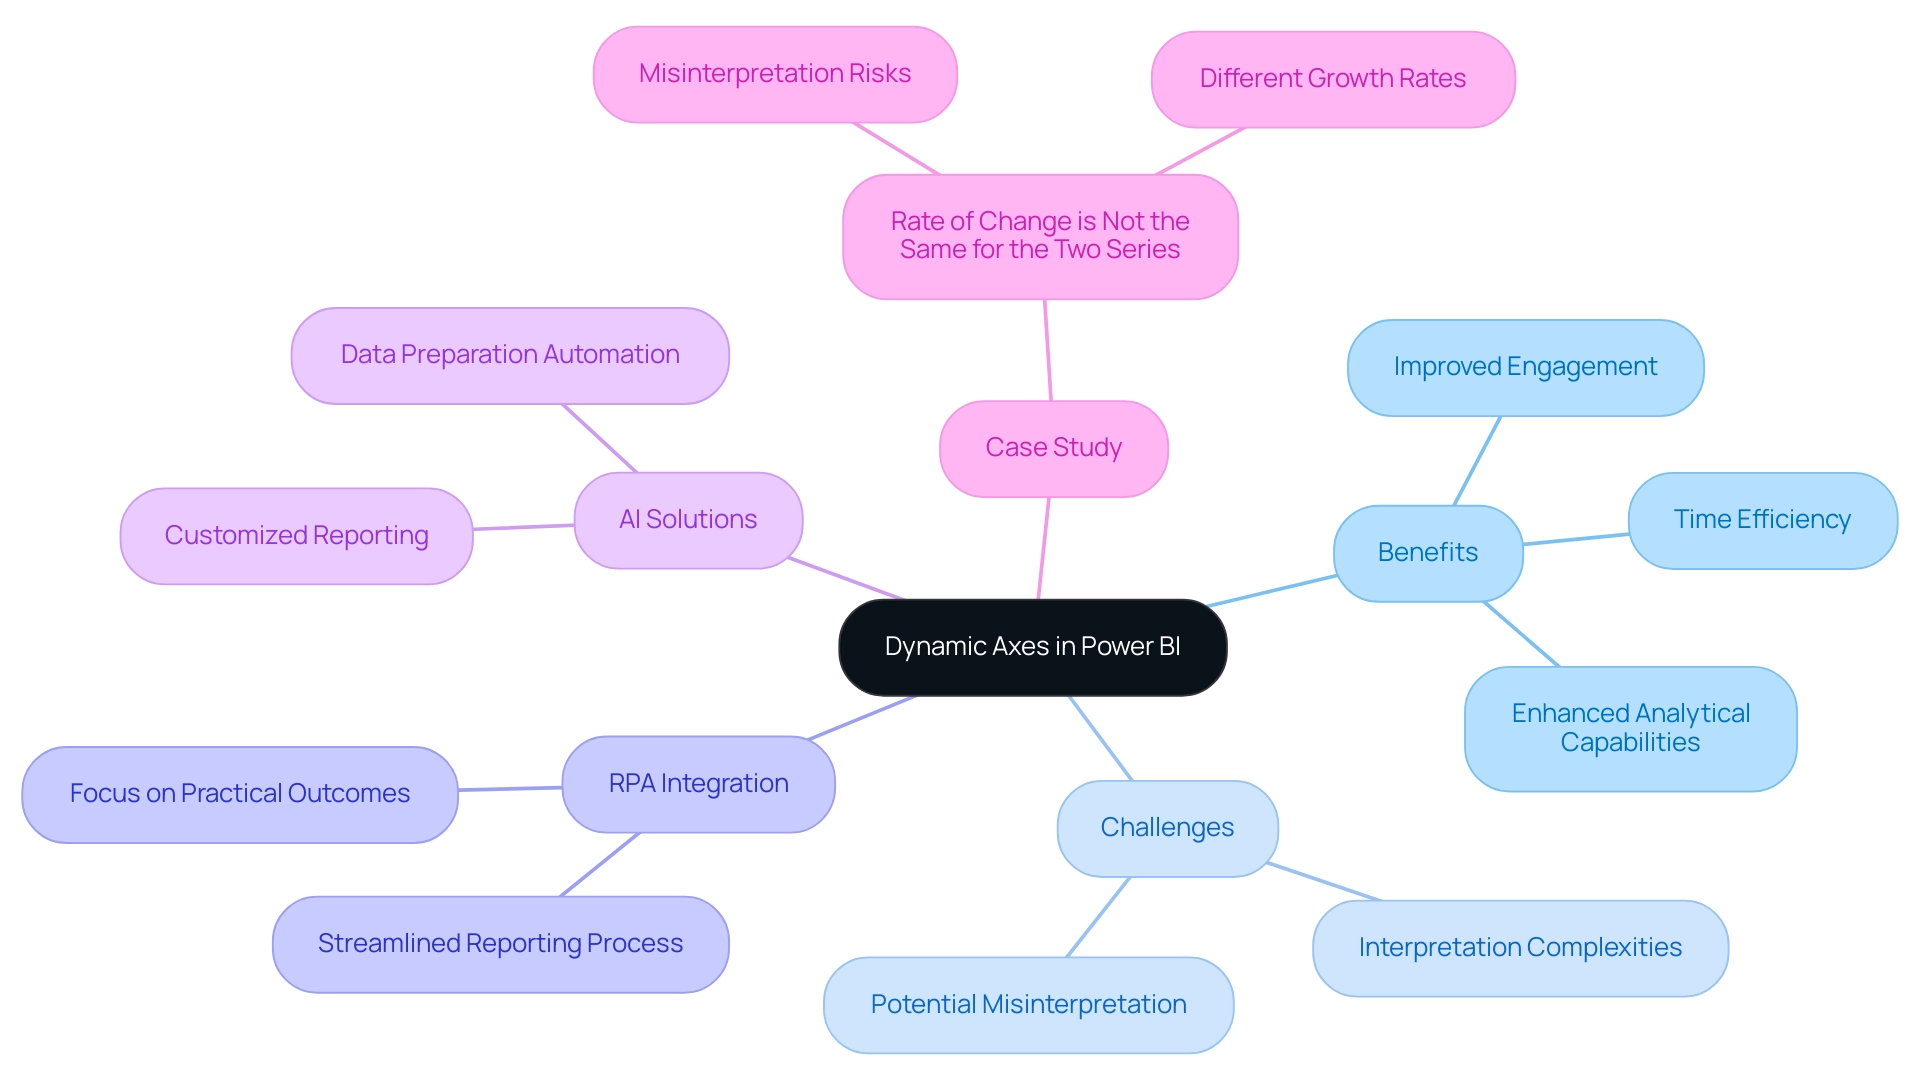
Understanding Dynamic Axes in Power BI
Dynamic axis power bi is a powerful tool that enables individuals to craft interactive visualizations that automatically adjust to selections and parameters. This capability is particularly advantageous for displaying time-related information, enabling individuals to filter or adjust date ranges dynamically. By tackling common challenges like time-consuming report creation and inconsistencies, this feature improves analytical capabilities and greatly boosts engagement with the reports.
Moreover, incorporating Robotic Process Automation (RPA) and customized AI solutions can enhance the reporting process, enabling teams to concentrate on obtaining practical outcomes instead of getting hindered in data preparation. In fact, this topic has garnered 6,579 views, underscoring its relevance to many users. Mastering dynamic axis power bi not only transforms documents into engaging narratives but also empowers Directors of Operations Efficiency to leverage insights effectively, driving informed decision-making.
Furthermore, it is crucial that reports offer clear, actionable guidance to ensure stakeholders comprehend the next steps based on the information presented. A case study titled ‘Rate of Change is Not the Same for the Two Series’ illustrates the complexities of interpreting dual and multi-axis charts, warning against misinterpretation of similar slopes that can mask vastly different growth rates. This comprehension is essential for improving the storytelling element of presentations, ultimately resulting in more effective analysis.
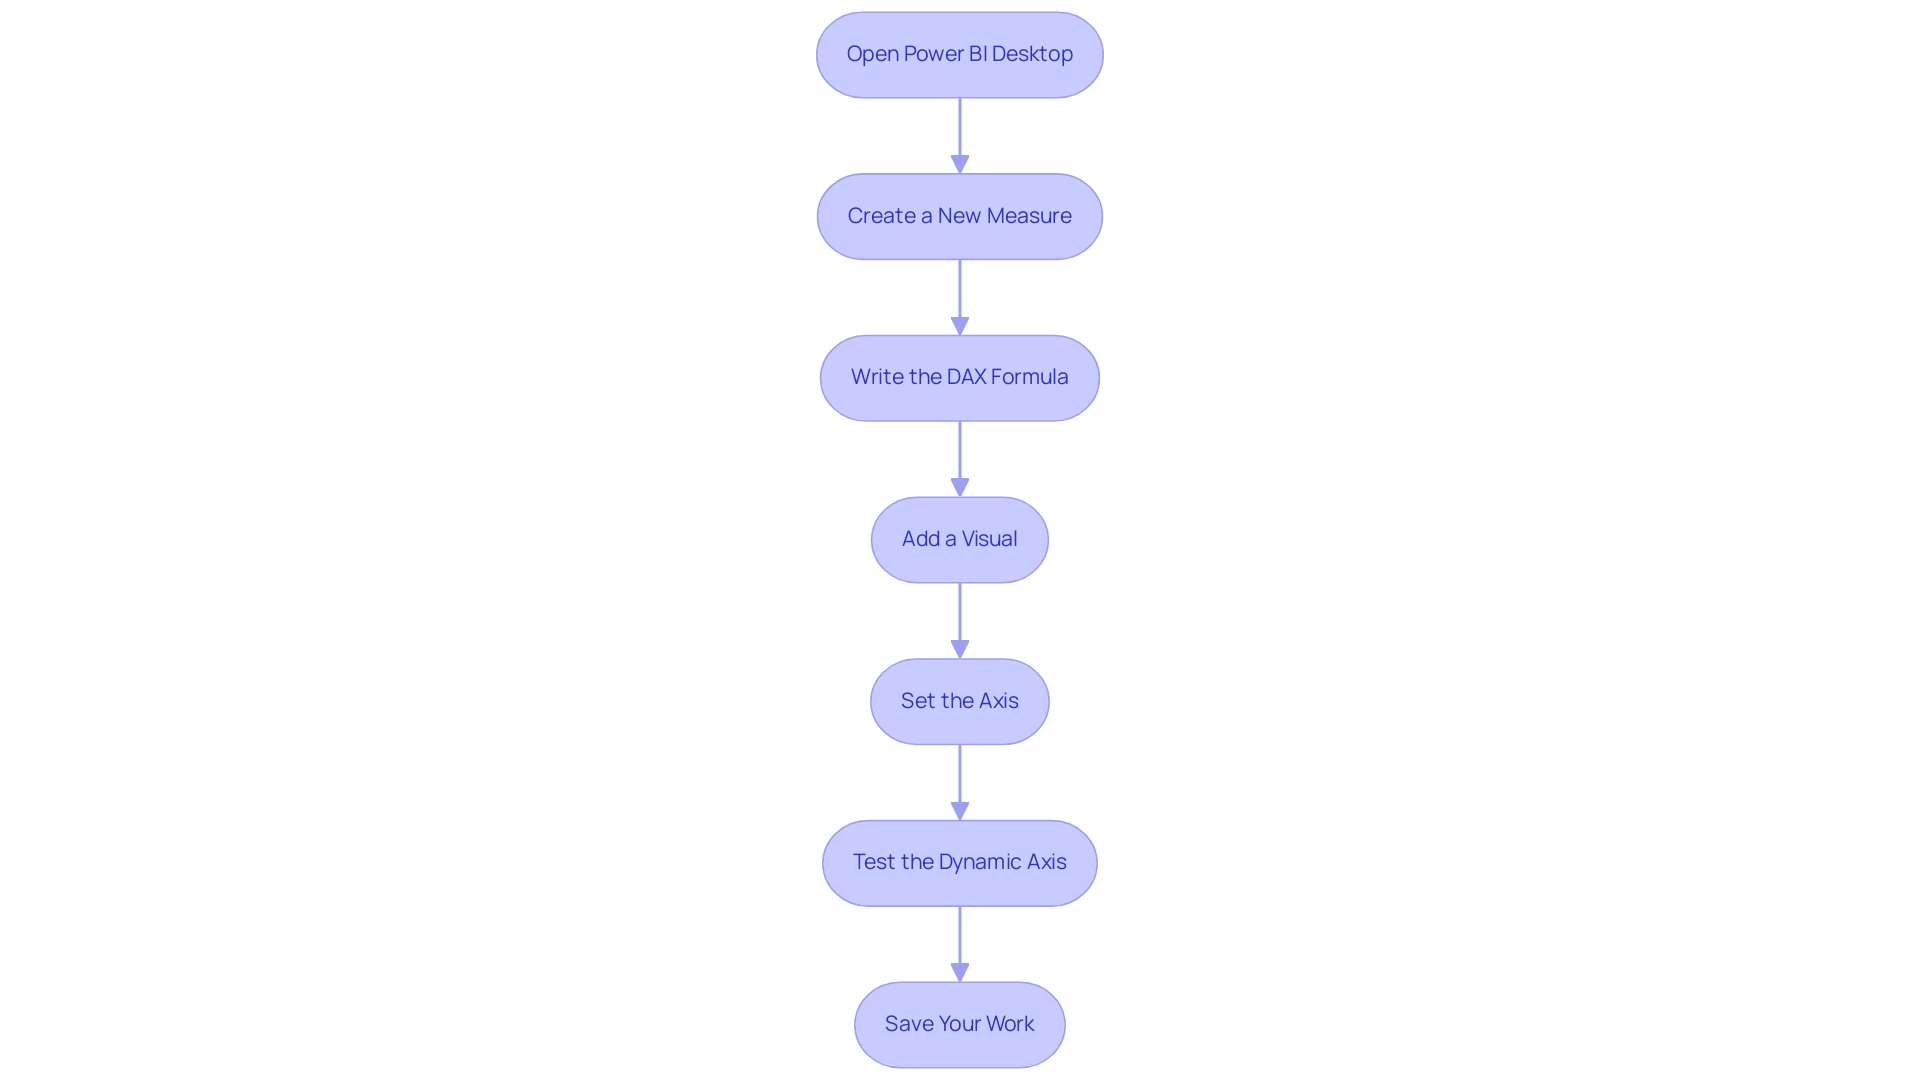
Step-by-Step Guide to Creating a Dynamic Axis
-
Open Power BI Desktop: Begin by launching Power BI Desktop and loading the dataset you wish to visualize. This initial step sets the foundation for your dynamic storytelling and helps overcome common challenges in leveraging insights from Power BI dashboards.
-
Create a New Measure: In the fields pane, right-click on your table and select ‘New Measure’. This measure will function as the dynamic axis power bi, enabling your visual to adjust to interactions, thereby enhancing operational efficiency.
-
Write the DAX Formula: Implement the following DAX formula to create a measure that reacts to user input:
DAX

   DynamicDate = SELECTEDVALUE(DateTable[Date])
This formula effectively captures the selected date from your Date Table, empowering users to explore data over different time frames and drive growth through actionable insights.
-
Add a Visual: Drag a visual, such as a line chart, onto the report canvas. This visual will showcase the information dynamically based on selections, demonstrating the power of interactive information presentation.
-
Set the Axis: In the visual’s settings, designate the X-axis to your newly created measure (Dynamic Data). This step ensures that the visual represents the selected date and mitigates issues associated with inconsistencies.
-
Test the Dynamic Axis: To enhance interactivity, add a slicer for the date field. This allows users to select various dates and witness the visual update dynamically.
For instance, examining sales data where vehicles sold for over 180 thousand Reais can indicate the presence of outliers, offering valuable understanding into sales patterns.
- Save Your Work: Once you are satisfied with your setup and the dynamic functionality, save your Power BI report.
Regularly saving your progress ensures that you don’t lose any critical insights.
By actively interacting with Power BI’s features, you not only improve your narrative presentation but also encourage adoption. Effective adoption strategies should include defining long-term objectives and regularly reevaluating goals to maximize the benefits of your analytics initiatives. Key use cases for AI, such as fraud detection and resource optimization, highlight the importance of effective data presentation across various industries.
Furthermore, as illustrated in the case study titled “Benefits of Adoption Tracking”, monitoring engagement provides insights that inform strategic planning and demonstrate the value of analytics initiatives. Remember, as one industry expert noted,
Your Power BI adoption strategy should help you identify your goals and get everyone rowing in the same direction.
This approach not only mitigates common mistakes but also reinforces the value of analytics within your organization.
Additionally, integrating RPA solutions like EMMA RPA and Power Automate can further enhance operational efficiency by automating repetitive tasks and addressing staffing shortages, allowing your team to focus on strategic initiatives.
Leveraging DAX for Dynamic Axis Creation
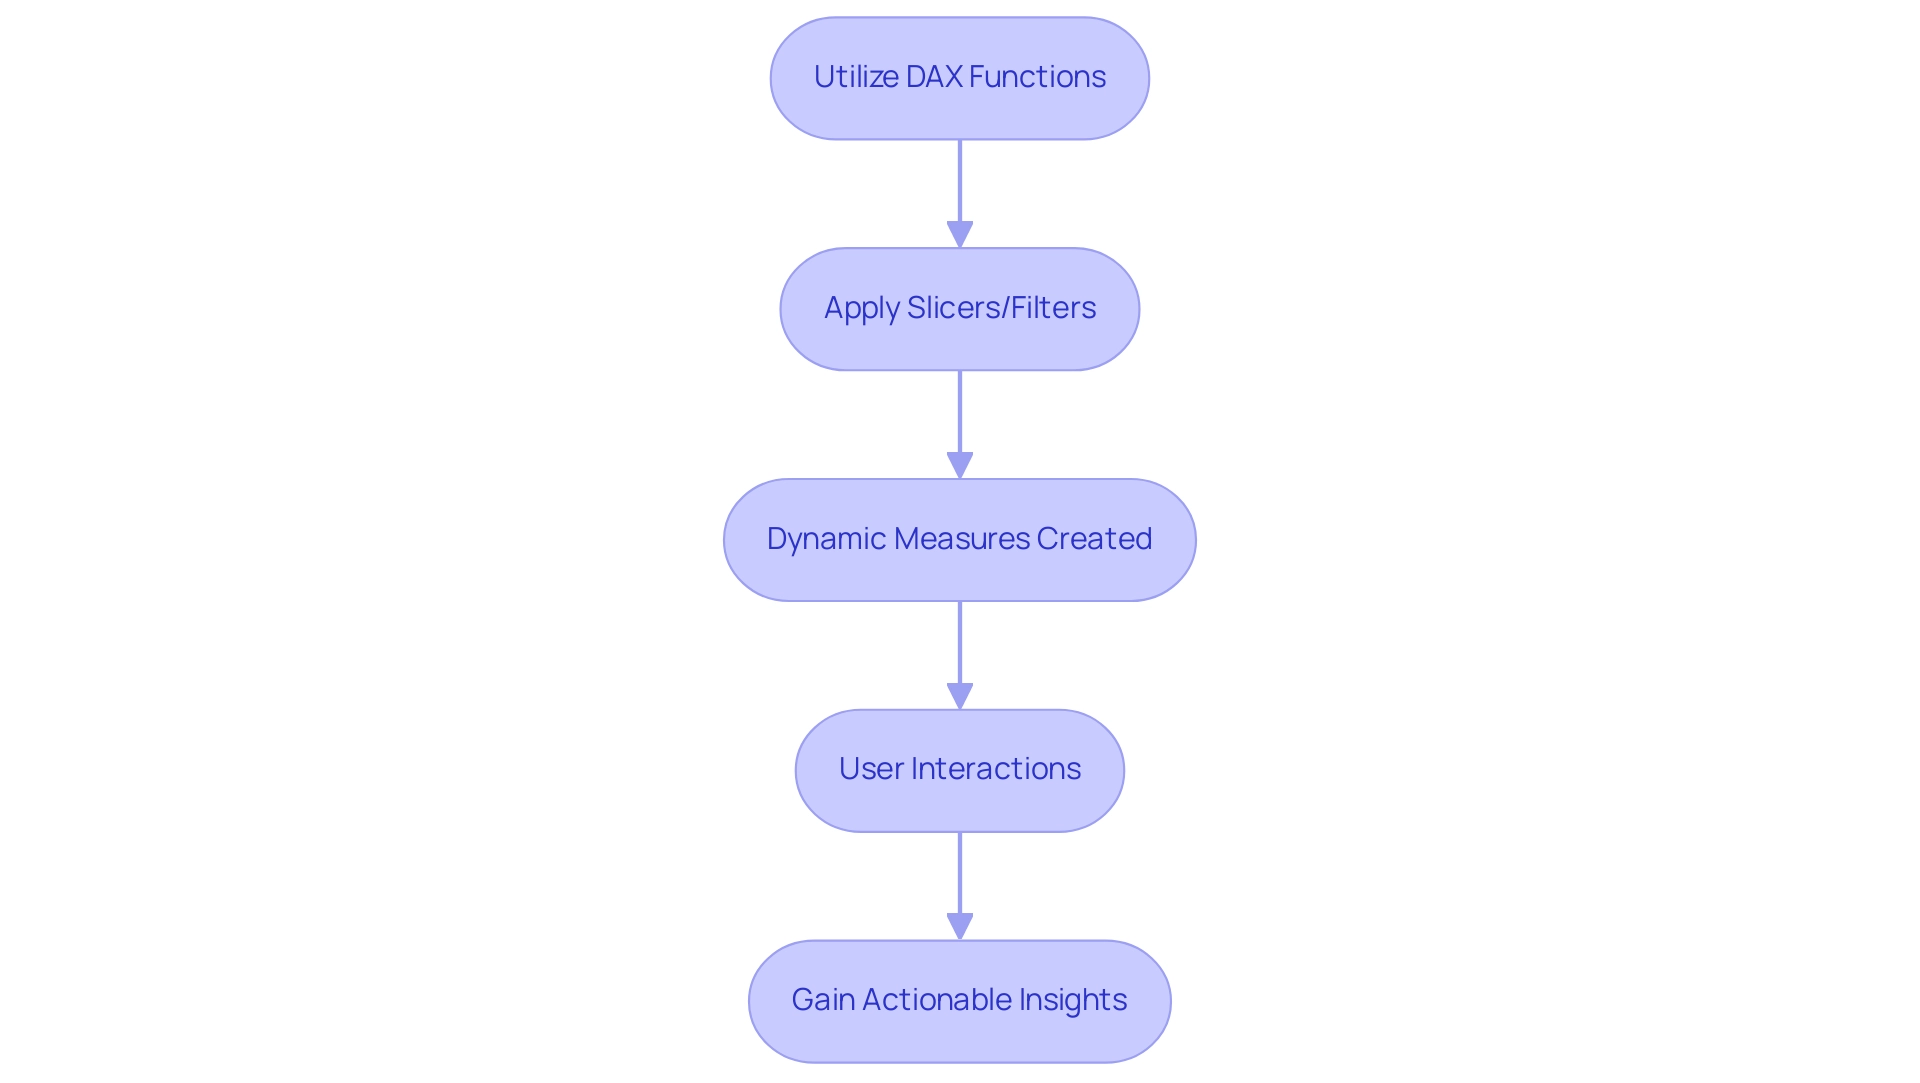
Data Analysis Expressions (DAX) is a crucial formula language in Power BI that enables individuals to manipulate and analyze information effectively. In an environment where many struggle with time-consuming report creation and inconsistencies in information due to a lack of governance strategy, the significance of DAX becomes particularly evident when utilizing dynamic axis power bi. It enables the definition of measures that adapt in real-time to user interactions, addressing the common challenge of generating actionable insights.
Functions such as SELECTEDVALUE and FILTER allow you to craft measures that change based on selections made through slicers or filters, providing a customized exploration experience. This capability is essential for guaranteeing that documents do not merely showcase figures and charts but also provide clear direction on the next steps, thereby boosting stakeholder confidence in the information. Furthermore, as Griffin highlighted, the necessity for accessible documents for non-administrative individuals emphasizes the significance of developing interactive materials that involve all participants.
By utilizing the dynamic axis power bi, you can transform your Power BI reports into valuable tools that enhance operational efficiency and encourage deeper interaction with your information. For example, DAX can streamline intricate interactions for non-admin users, allowing them to discover findings without requiring extensive technical expertise. This makes DAX an invaluable asset for decision-makers aimed at promoting growth and innovation.
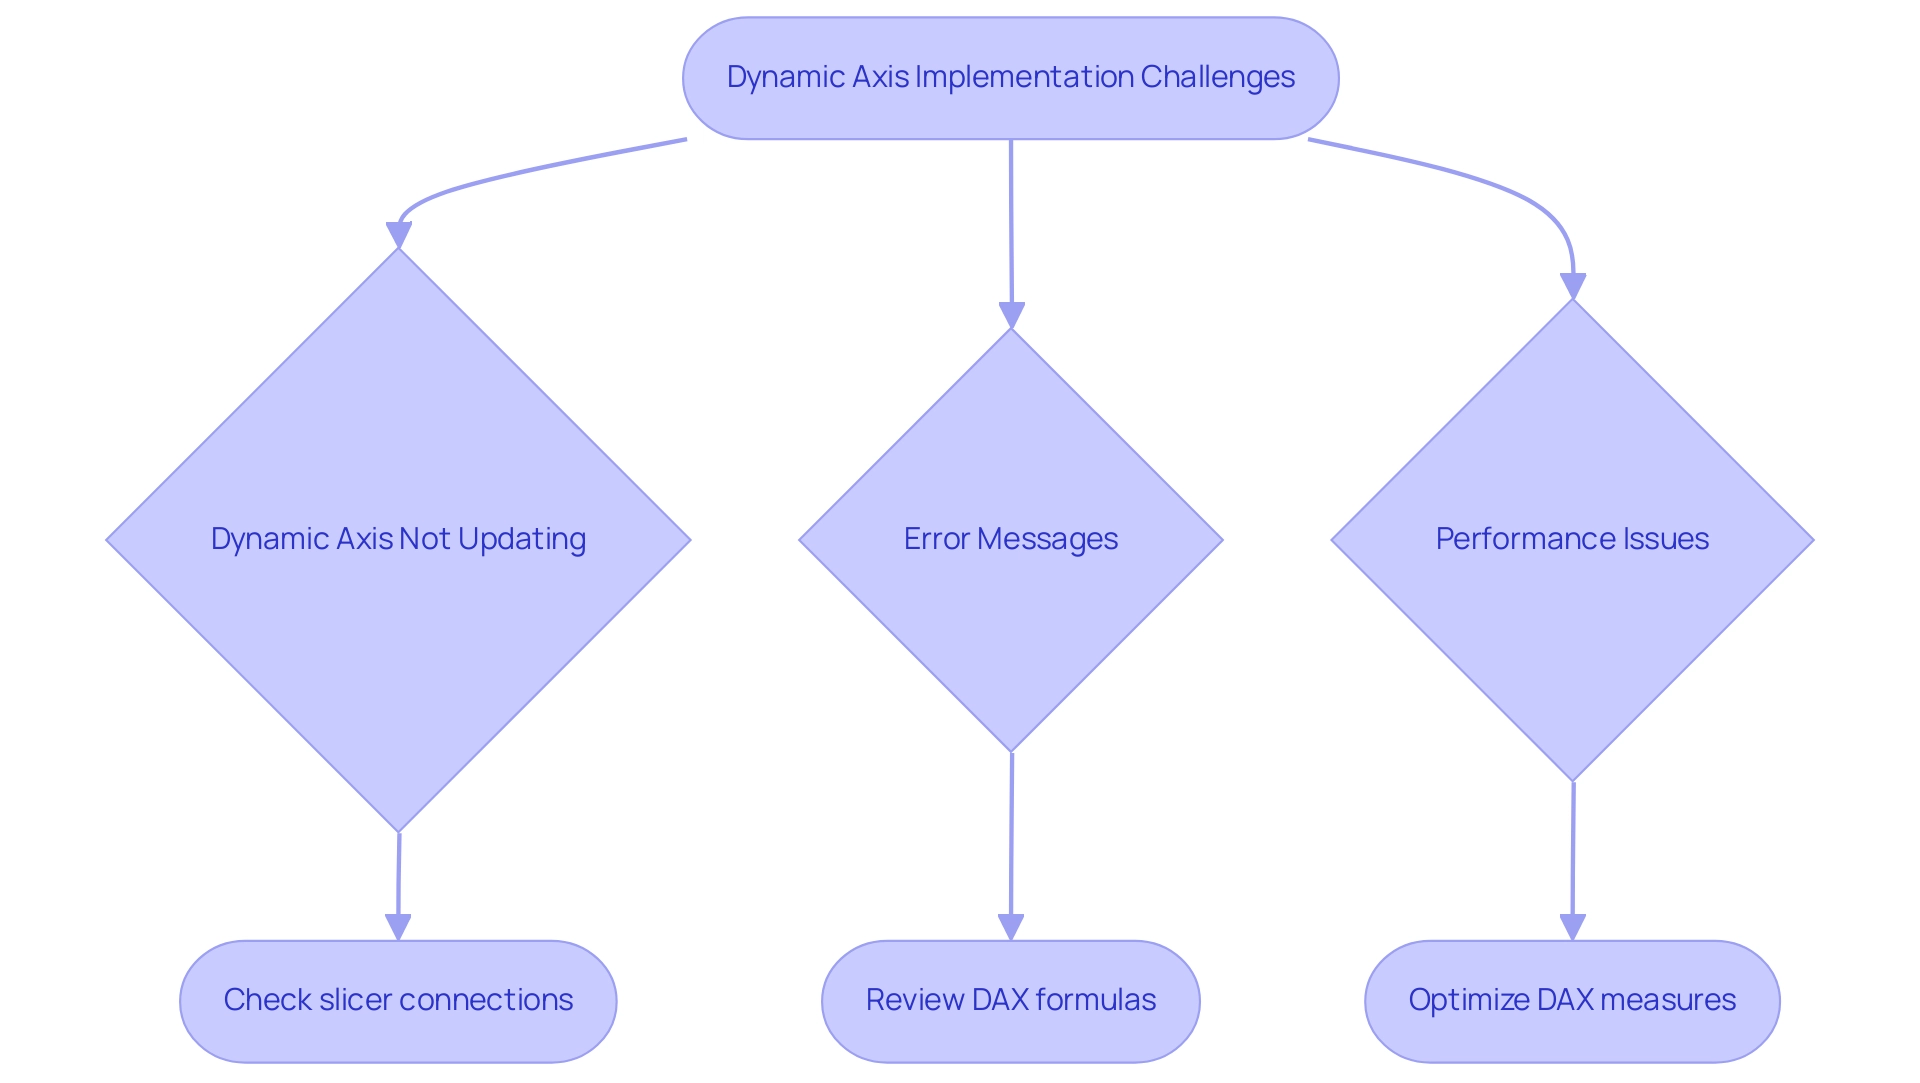
Common Challenges and Solutions in Dynamic Axis Implementation
- Dynamic Axis Power BI Not Updating: If your dynamic axis power bi fails to reflect changes, ensure that your slicers are properly linked to your visual components. It’s essential to analyze the connections within your model; unclear relationships, as emphasized in the case study ‘Ambiguous Relationships in Models,’ can result in flawed reporting outcomes. Properly defining these relationships is essential for precise information representation and aligning with tailored AI solutions that enhance your business insights, helping you navigate the overwhelming AI landscape.
Error Messages: Encountering common DAX errors often stems from syntax issues or erroneous field references. Take time to meticulously review your DAX formulas for typographical errors or incorrect references to fields. Addressing these minor mistakes can save significant troubleshooting time down the line and ultimately support your goal of leveraging Business Intelligence for informed decision-making, which is crucial to avoid the competitive disadvantage of lacking actionable insights.
- Performance Issues: A sluggish document may indicate the need for optimization of your DAX measures. Simplifying calculations and restricting the information set can significantly enhance performance. Key solutions for slow report loading include consolidating visuals and optimizing DAX calculations, which not only reduce loading times but also enhance the overall user experience—essential for driving operational efficiency and ensuring your data-driven findings are actionable.
Visual Types: It’s important to note that not all visual types support the dynamic axis power bi feature. Ensure you are utilizing compatible visualizations that can effectively leverage dynamic axis power bi. Grasping the limitations of specific visual types will assist you in avoiding potential pitfalls in your presentation. Furthermore, as Rico Zhou pointed out, ‘To set up a refresh, you may need to install a gateway,’ which is an essential step for maintaining dynamic axis power bi functionality and ensuring that your understanding can drive business growth.
Best Practices for Effective Dynamic Axes in Power BI
-
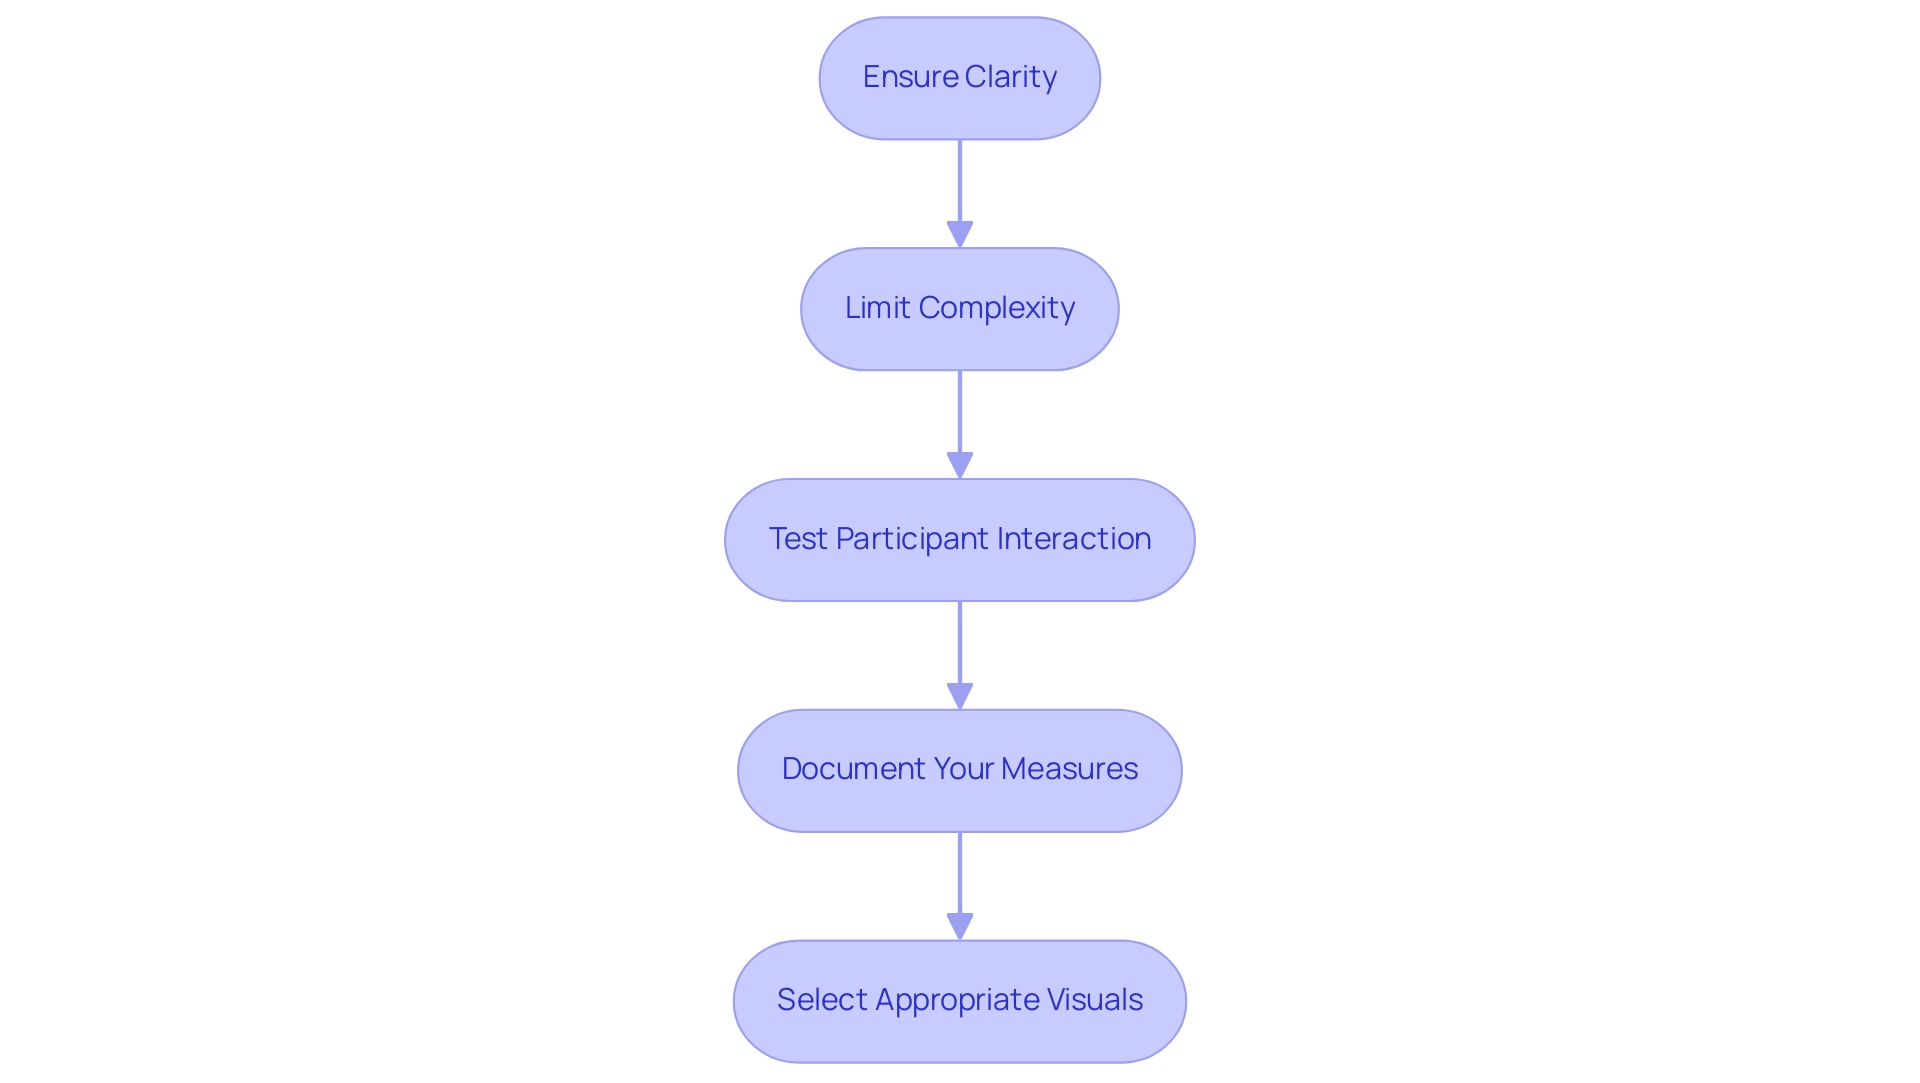
Ensure clarity: The foundation of effective dynamic axis Power BI lies in their clarity. Make sure your axes are clearly labeled and intuitively understandable. Incorporate descriptive titles and helpful tooltips that guide users through the narrative, enhancing their comprehension. As emphasized by Arun Ulag during the Microsoft Fabric Conference 2025, clarity in visual representation is crucial for effective storytelling and is enhanced when backed by RPA, which simplifies the preparation process, enabling more targeted understanding.
-
Limit Complexity: Strive for simplicity in your dynamic measures. Avoid cluttering your visuals with overly complex information points. For instance, having a total of six charts on one page can lead to confusion. By focusing on the most essential insights, improved through RPA’s capability to automate data collection and reporting, you will enhance experience and enable better decision-making.
-
Test Participant Interaction: Prior to finalizing your report, conduct usability tests with real participants. Collecting feedback on clarity and functionality will enable you to make necessary adjustments that address needs, ensuring a more engaging and intuitive experience. Paul Yeo aptly stated, “Hi Fowmy, Thank you for sharing the webinar link. Appreciate very much,” emphasizing the value of shared knowledge in enhancing experience. This user feedback loop is essential for fine-tuning the interaction with dynamic axis Power BI.
-
Document Your Measures: Establish comprehensive documentation for your DAX measures. This will not only clarify their purpose and functionality for team members but also foster collaboration and knowledge sharing, ultimately leading to more efficient operations. The use of RPA, such as Power Automate, can assist in maintaining this documentation, making it easier to keep track of changes and updates. Moreover, think about examining the recommended videos for excellent designing advice found at
- https://powerbi.tips/2020/09/designing-a-great-power-bi-report/
-
https://www.discoverei.com/blog/top-5-power-bi-design-tips
which can offer additional understanding into effective Power BI presentation techniques. -
Select the Appropriate Visuals for Your Information: As emphasized in the case study named ‘Tip #5: Select The Appropriate Visuals for Your Information,’ creators should opt for the most impactful visual depiction for their information, taking into account the story they aim to communicate. Selecting appropriate visuals can significantly improve data comprehension and storytelling within reports, particularly when augmented by Business Intelligence tools that transform raw data into actionable insights.
Call to Action: To implement these strategies effectively, consider scheduling a workshop with your team to explore RPA tools like Power Automate and how they can be integrated into your current workflows to enhance efficiency and reduce errors.
Conclusion
Dynamic axes in Power BI represent a game-changing feature that enhances the way data is visualized and understood. By enabling interactive reports that adjust to user inputs, organizations can tackle the challenges of time-consuming report creation and data inconsistencies. The integration of DAX formulas and Robotic Process Automation streamlines processes, allowing teams to focus on deriving actionable insights that drive operational efficiency and informed decision-making.
The step-by-step guide provided illustrates how to effectively implement dynamic axes, ensuring users can explore data over varying time frames while minimizing errors and performance issues. Understanding the common challenges associated with dynamic axis implementation equips users with the knowledge to create reports that are not only visually appealing but also functional and reliable.
Ultimately, the best practices highlighted emphasize the importance of clarity, simplicity, and user feedback in creating effective dynamic axes. By prioritizing these elements, professionals can transform data into engaging narratives that empower stakeholders to take informed action. Embracing these strategies not only enhances data storytelling but also fosters a culture of data-driven decision-making, ultimately leading to improved operational outcomes.
Introduction
In the modern business landscape, data is the lifeblood of informed decision-making and operational efficiency. Integrating Power BI with SharePoint not only enhances the way organizations visualize and share insights but also fosters a collaborative environment that empowers teams to work smarter, not harder.
By embedding interactive reports and dashboards directly within SharePoint, organizations can streamline workflows and ensure that critical data is accessible at the fingertips of decision-makers. This article delves into the transformative potential of this integration, offering a comprehensive guide on how to effectively embed Power BI reports, manage permissions, troubleshoot common issues, and navigate the considerations that come with this powerful combination.
As organizations strive to harness the full capabilities of their data, understanding and implementing these strategies can lead to significant improvements in operational performance and growth.
Understanding Power BI and SharePoint Integration
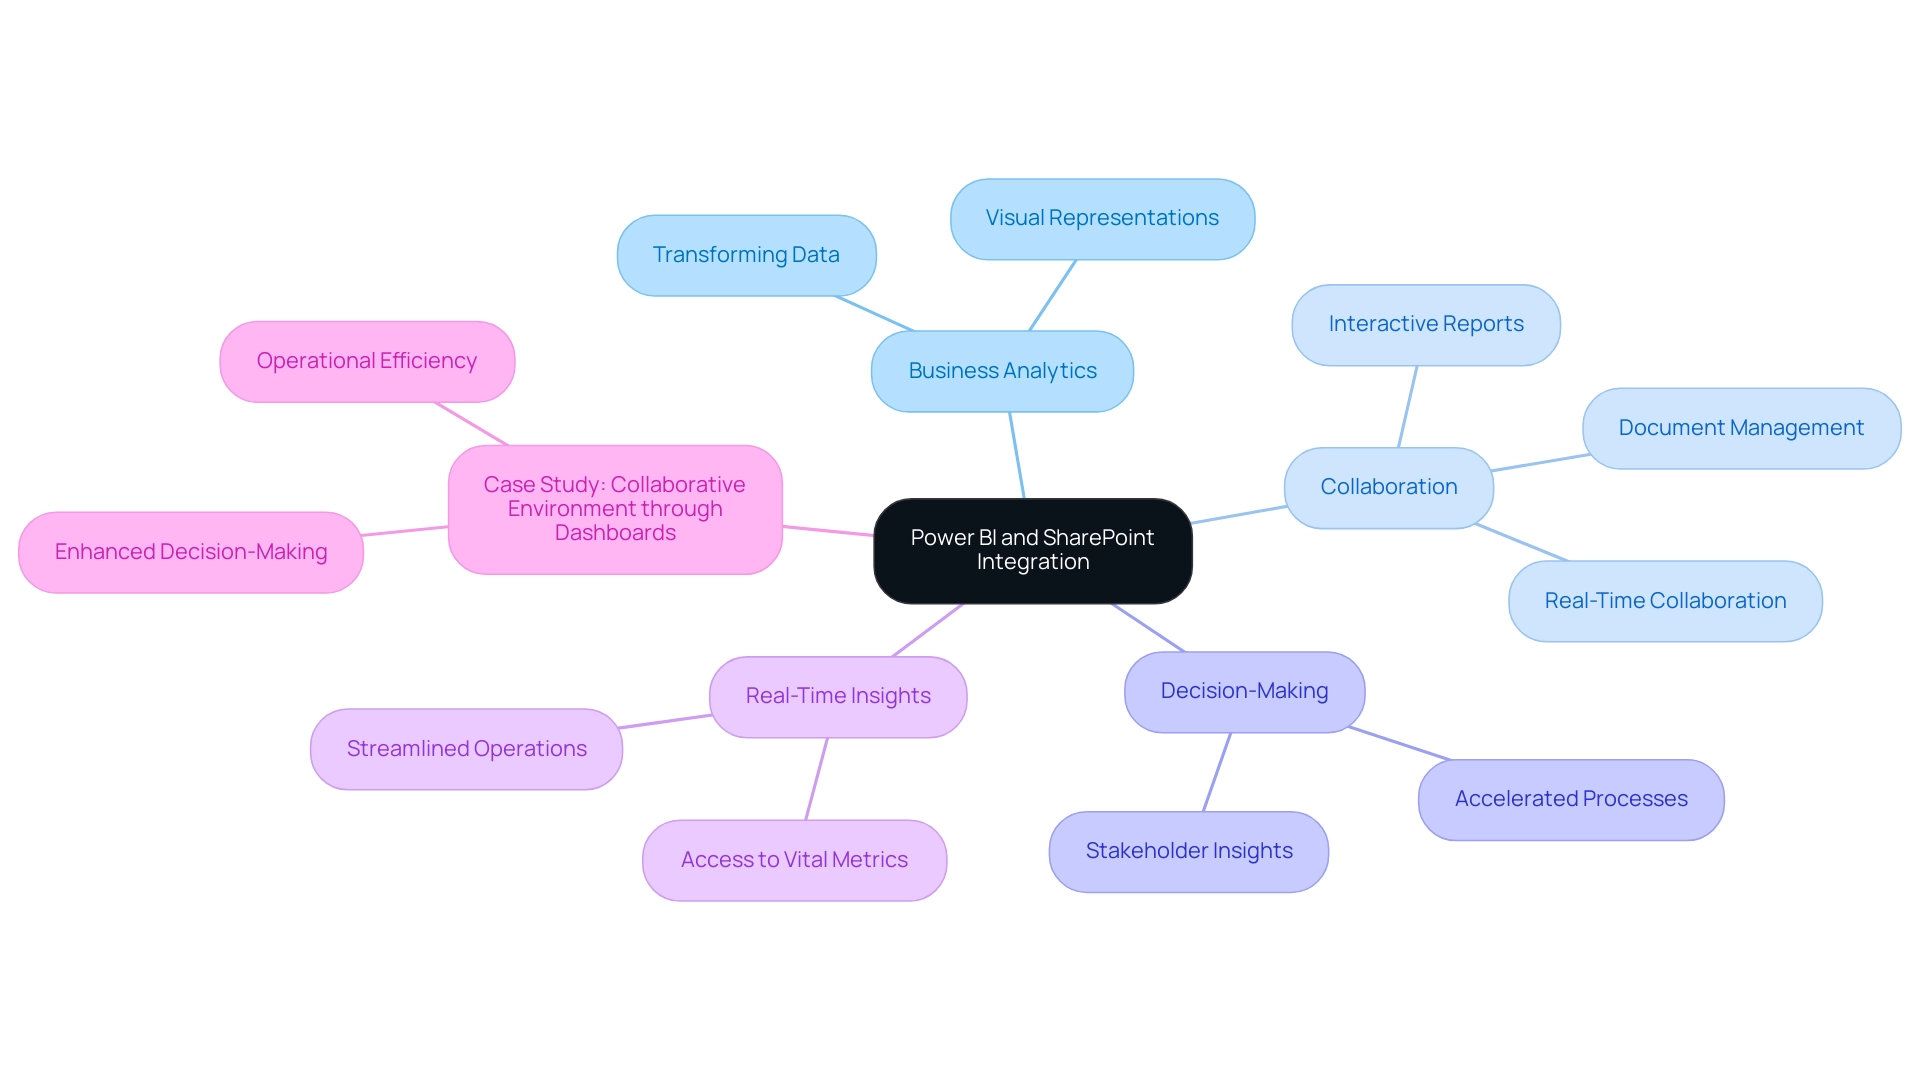
This software distinguishes itself as a leading business analytics tool, enabling organizations to convert unrefined information into meaningful visual representations. When integrated with SharePoint, a robust collaboration platform, teams can manage documents and share information with unparalleled ease. This integration allows organizations to enhance their capabilities by embedding Power BI in SharePoint, enabling them to embed interactive reports and dashboards directly within their SharePoint sites, fostering a data-driven culture and enhancing informed decision-making processes.
As Amira Bed, a Most Valuable Professional, states, ‘Through the integration of Power BI with Office 365 along with Teams, a stakeholder is able to work on insights simultaneously and can thus accelerate the decision-making processes.’ Stakeholders can access vital metrics and insights without disrupting their collaborative workflows, significantly streamlining operations. Recent developments, such as utilizing the ‘SharePoint Folder’ connector in the ‘Get Data’ option, further simplify accessing folder contents, ensuring that individuals can tap into essential information efficiently.
With 2,603 users currently online, the relevance and popularity of these tools are evident. The result of this seamless integration promotes a collaborative environment where teams can examine information in real-time, significantly speeding up the decision-making process. Moreover, our Business Intelligence services improve documentation capabilities, tackling frequent issues such as lengthy document preparation and information discrepancies.
A case study titled ‘Collaborative Environment through Dashboards’ illustrates how BI dashboards enhance decision-making by allowing stakeholders to work on data insights simultaneously, ultimately driving operational efficiency and growth.
Step-by-Step Guide to Embedding Power BI Reports in SharePoint
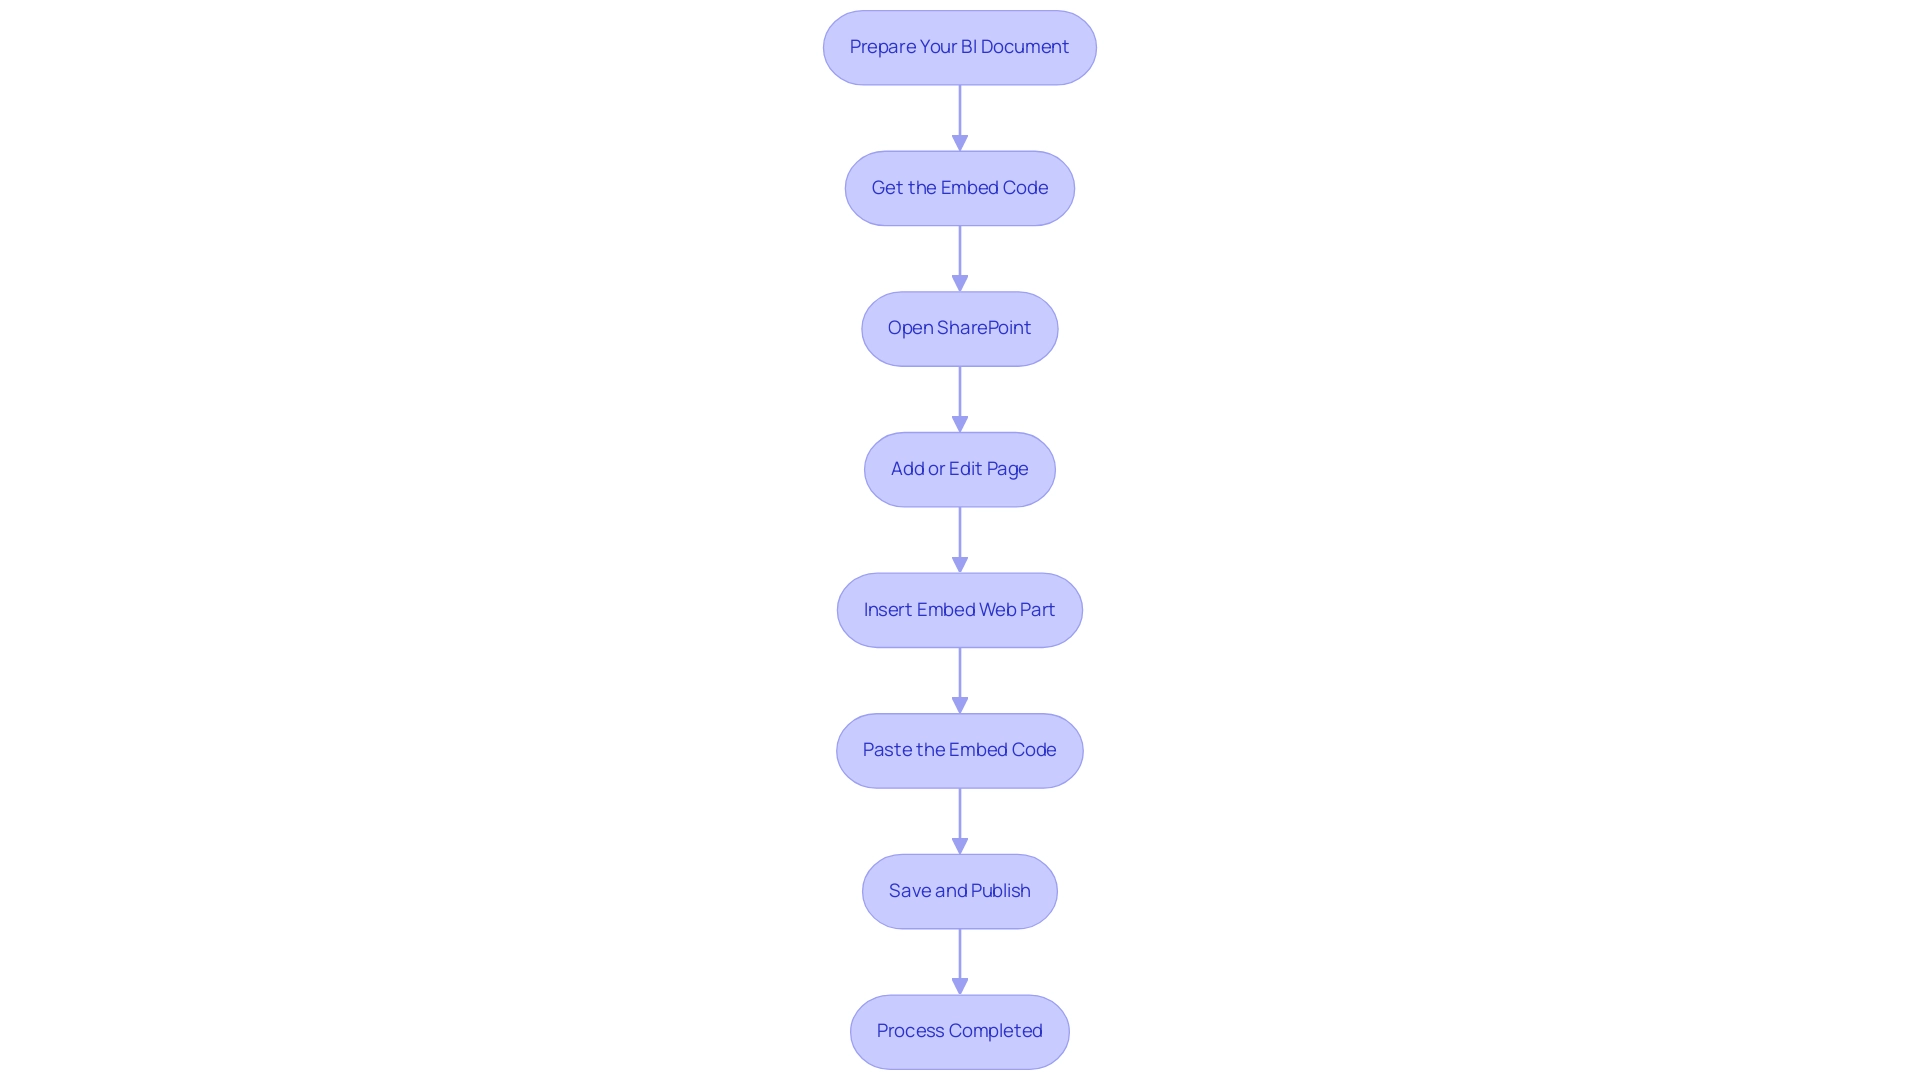
- Prepare Your BI Document: Start by launching BI and choosing the document you wish to embed. Ensure that the document is published to the BI service to make it accessible for integration.
- Get the Embed Code: Navigate to your selected document within BI. Select ‘File’, then ‘Embed’, and choose ‘Website or portal’ to generate the embed code. Copy the provided iframe code for later use.
- Open SharePoint to access your SharePoint site for embedding Power BI in SharePoint, where the document will be embedded.
- Add a New Page or Edit an Existing Page: You can either create a new page by selecting ‘New’ or edit an existing page to incorporate the report.
- Insert an Embed Web Part for embedding Power BI in SharePoint: Click the ‘+’ icon to add a new web part, and then select ‘Embed’ from the options presented.
- Paste the Embed Code: In the designated embed code box, paste the iframe code you copied from Business Intelligence, which is essential for embedding Power BI in SharePoint seamlessly.
- Save and Publish: After embedding the document, save your changes and publish the page to ensure that users can access the integrated content.
This integration not only streamlines reporting processes but also enhances data accessibility and addresses challenges such as time-consuming document creation and data inconsistencies. By effectively embedding Power BI in SharePoint, you integrate BI dashboards into your site and enable your team with consistent and actionable insights. Moreover, automating repetitive tasks through RPA solutions like EMMA RPA and Automate can significantly enhance operational efficiency, complementing the BI integration.
This corresponds with the increasing demand for operational efficiency, emphasized by inquiries such as Katie’s, who is seeking to monitor user engagement with documents. Embracing effective BI integration, along with RPA tools, can drive growth and innovation in your business.
Managing Permissions and Access for Embedded Reports
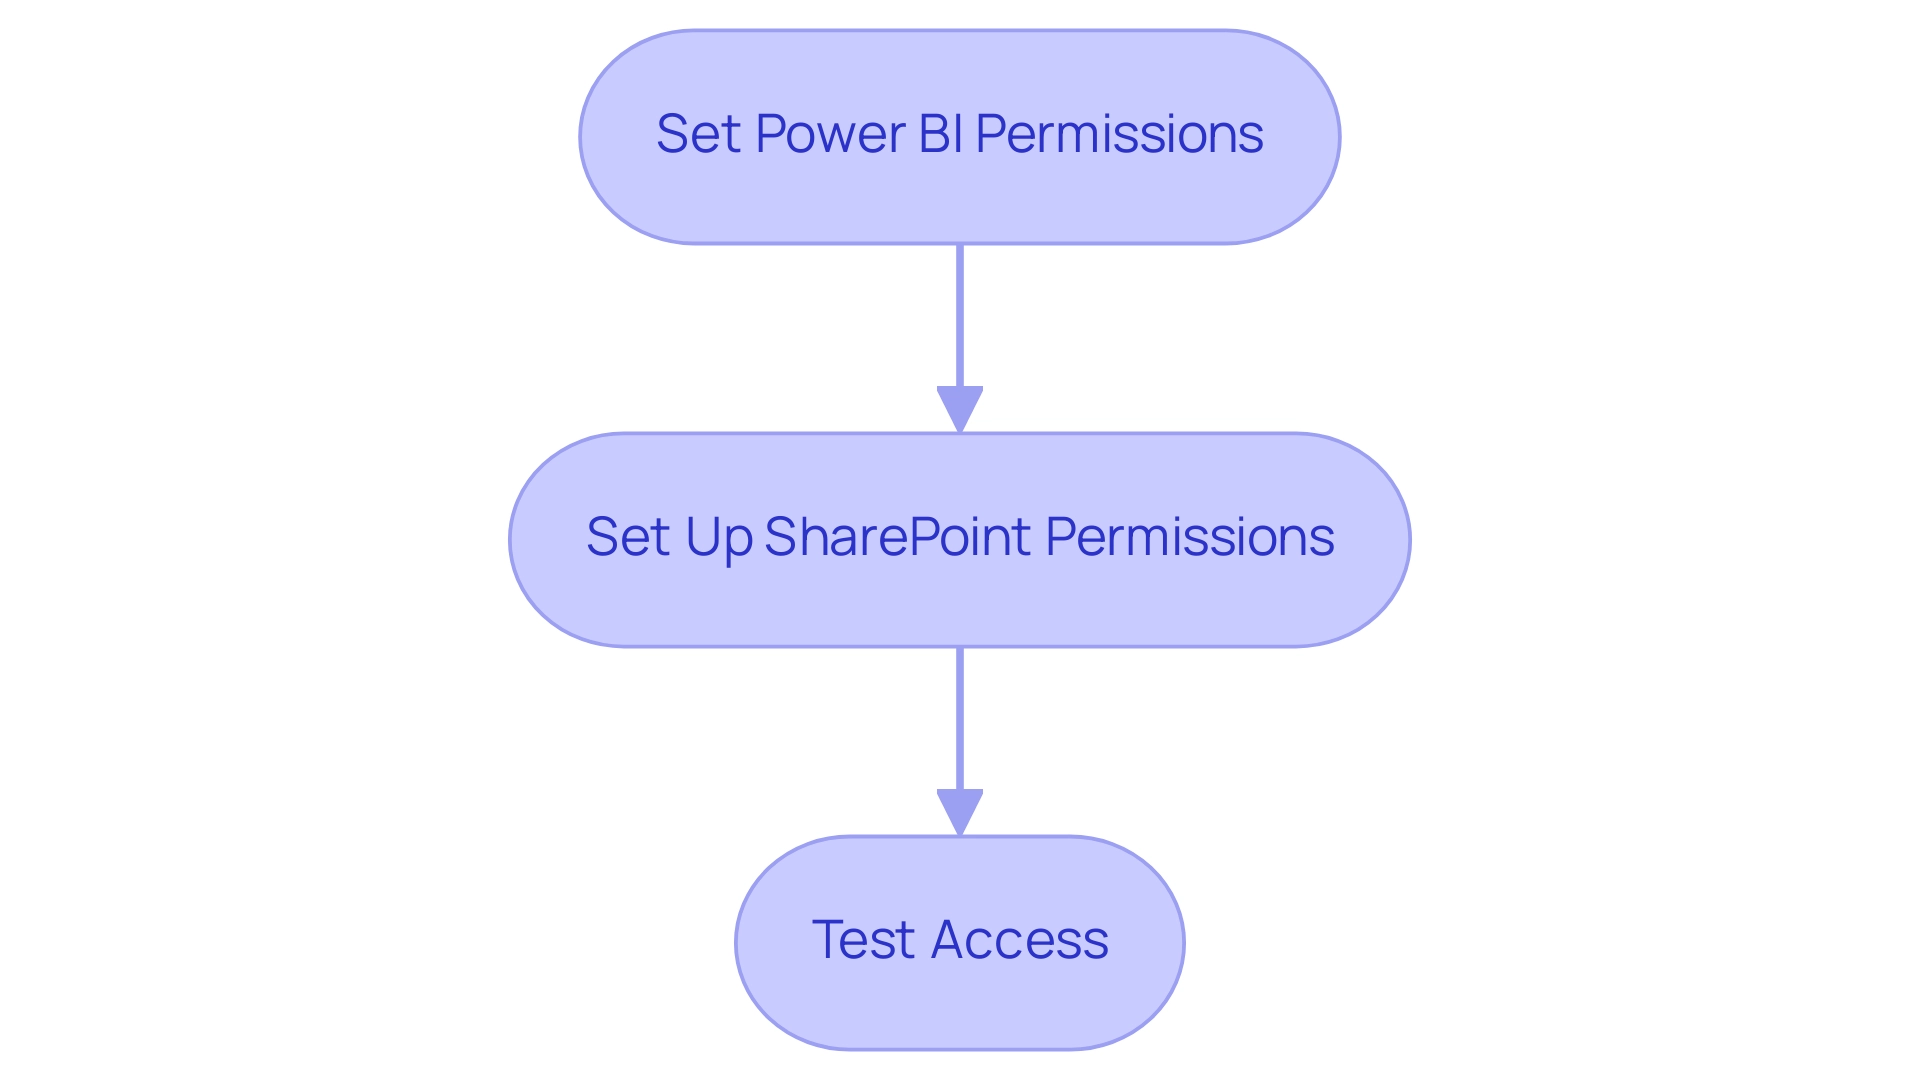
To effectively manage permissions for embedded Power BI reports in SharePoint, follow these essential steps:
-
Set Power BI Permissions: Start by confirming that individuals needing access to the document have the suitable permissions within Power BI. Navigate to the settings for the document, and under the ‘Permissions’ section, add appropriate individuals or groups to facilitate access.
-
Set Up SharePoint Permissions: Next, verify that individuals also have access to the SharePoint site containing the document. In ‘Site Settings’, adjust the site permissions to grant necessary access, ensuring that only authorized personnel can view the document.
-
Test Access: Prior to finalizing your setup, conduct a test using an account with the designated permissions. This step is crucial in confirming that only users with the right access can view the embedded document, thereby fortifying security measures.
By diligently managing these permissions, organizations can protect sensitive information from unauthorized access, significantly enhancing security and compliance, especially when embedding Power BI in SharePoint. This practice corresponds with the insights acquired from our 3-Day Business Intelligence Sprint, which highlights producing professional documents that not only showcase information but also facilitate actionable decision-making. Our comprehensive services, including custom dashboards, advanced analytics, and expert training, further support organizations in streamlining their documentation creation processes and enhancing their overall data management strategies.
Recent findings from the case study titled “Identity and Resource Findings” summarize vulnerabilities related to identities and resources, highlighting the risks associated with unencrypted resources and open security configurations. Furthermore, statistics indicate that organizations with strong access permissions management in Power BI see a marked reduction in security incidents. As pointed out by ‘jimmyfromus,’ there are legitimate worries regarding who has access to dashboards and documents, especially for individuals who have departed from the organization.
Implementing a robust permissions strategy not only safeguards information but also ensures that sensitive data is exclusively accessible to the appropriate individuals, streamlining operations and promoting data-driven insights for growth.
Considerations and Limitations of Power BI Embedding in SharePoint
When embedding Power BI reports in SharePoint, it is crucial to consider several limitations that could impact the user experience and overall efficiency:
-
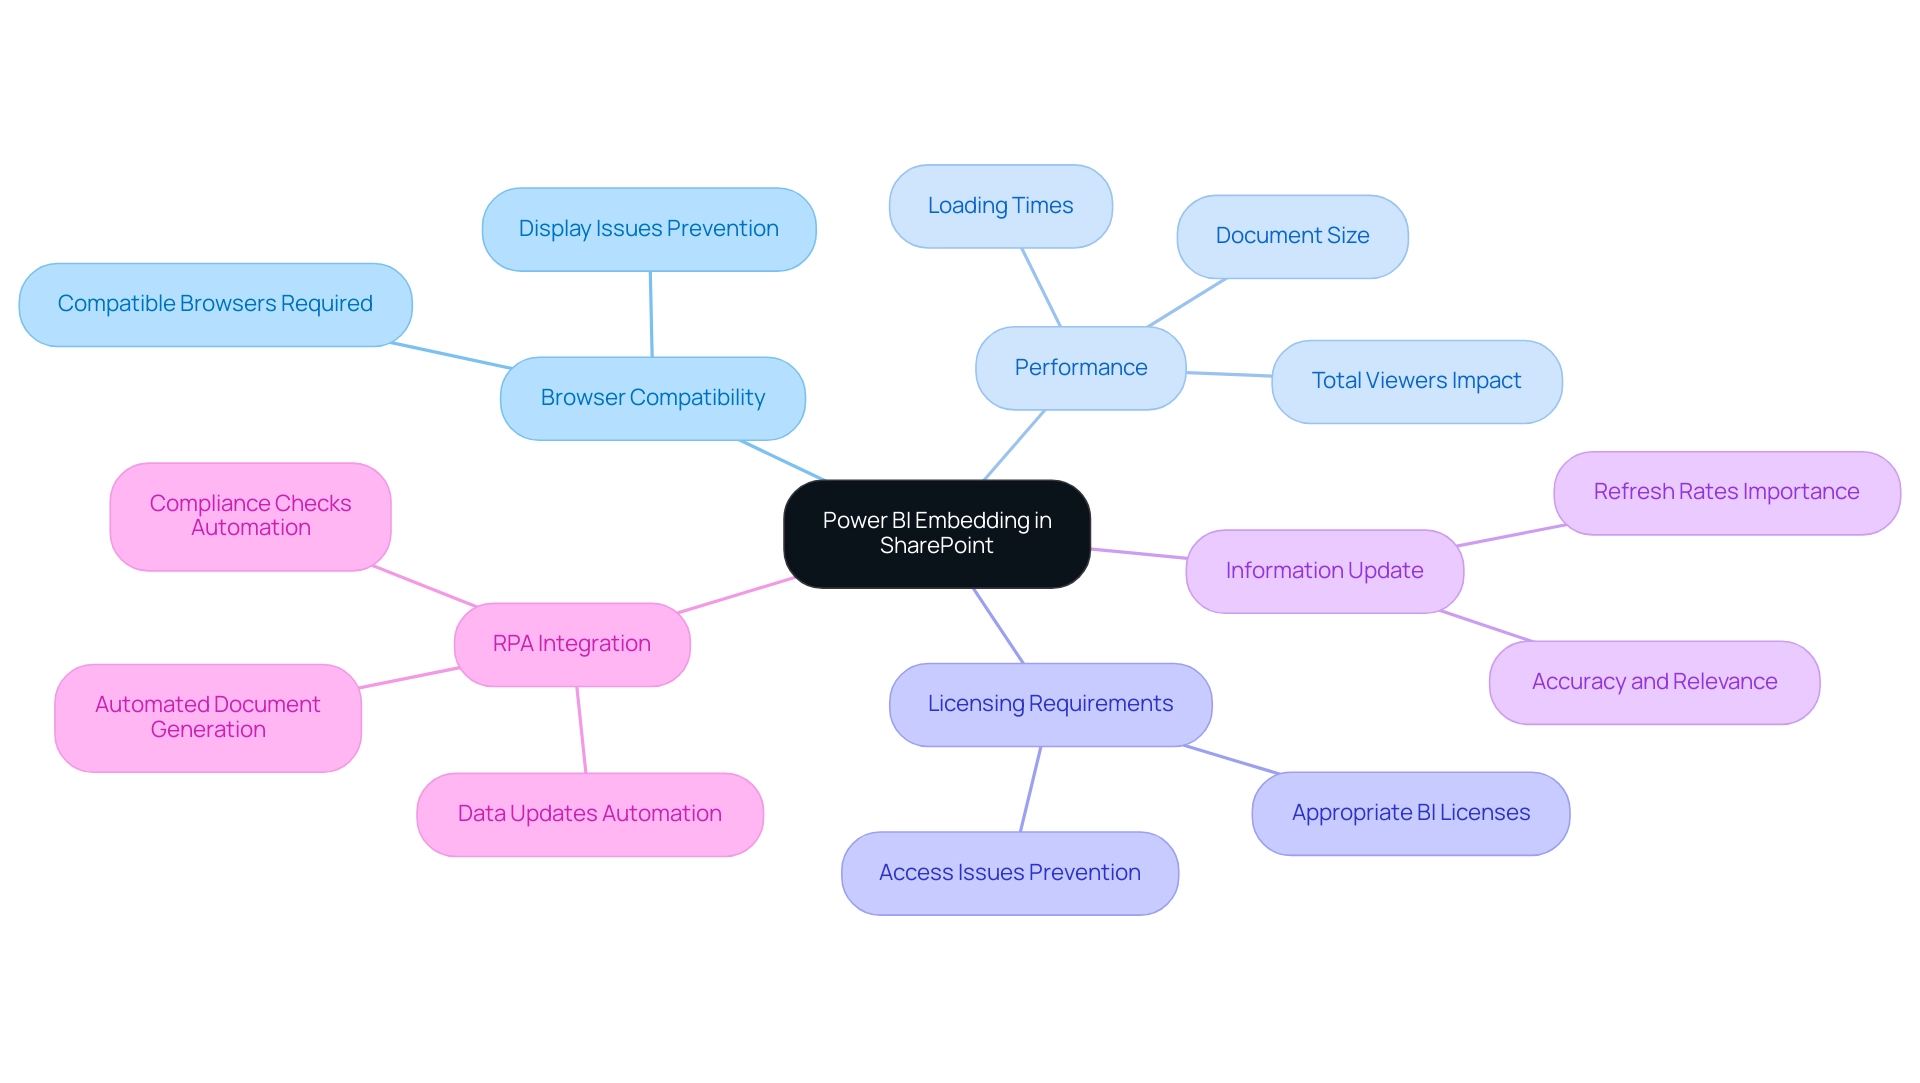
Browser Compatibility: Users must access the SharePoint site using compatible browsers to prevent display issues with embedded documents. Statistics indicate that many performance issues stem from browser incompatibility, so verifying compatibility is essential for smooth operation.
-
Performance: Extensive documents can lead to longer loading times, which may irritate individuals. In fact, total audience members across the workspace are documented as total viewers, emphasizing the significance of performance and engagement. Improving documents by minimizing their size and complexity can greatly boost performance, guaranteeing that individuals receive timely insights without unnecessary delays.
-
Licensing Requirements: It’s imperative to ensure that all users have the appropriate BI licenses to view embedded reports. This step prevents access issues that could hinder the sharing of valuable information within your organization.
-
Information Update: Grasping how refresh rates in BI influence the information shown in SharePoint is crucial. Regular updates are crucial for maintaining the accuracy and relevance of the information presented.
To truly leverage the potential of Power BI, embedding Power BI in SharePoint and integrating RPA solutions can automate document generation, reducing the time-consuming nature of creation. This optimization not only improves efficiency but also tackles inconsistencies that can occur when manually managing documents. For example, RPA can enable automated data updates and distribution, significantly decreasing manual effort.
As Yash Sharma, a new member, noted, “Thank you for your time and support,” emphasizing the importance of user experience in utilizing BI effectively.
Furthermore, citing the case study named ‘Usage Metrics in National/Regional Clouds‘ demonstrates how organizations can tackle compliance and performance issues when integrating BI visualizations in SharePoint. These clouds maintain the same security and privacy standards as the global version while adhering to local service delivery requirements. For example, organizations have successfully implemented RPA to automate compliance checks, ensuring that all embedded documents meet local regulations.
By being mindful of these considerations and embracing BI and RPA, you can effectively prepare for embedding Power BI in SharePoint. This results in a more seamless integration experience that maximizes the value of BI within SharePoint while addressing the technical limitations and challenges head-on.
Troubleshooting Common Embedding Issues
When embedding Power BI in SharePoint, it’s not uncommon to encounter a few challenges. With over 15,031 views on discussions surrounding this topic, it’s clear that many users are seeking solutions. To troubleshoot effectively and ensure a smooth integration, consider the following essential steps:
-
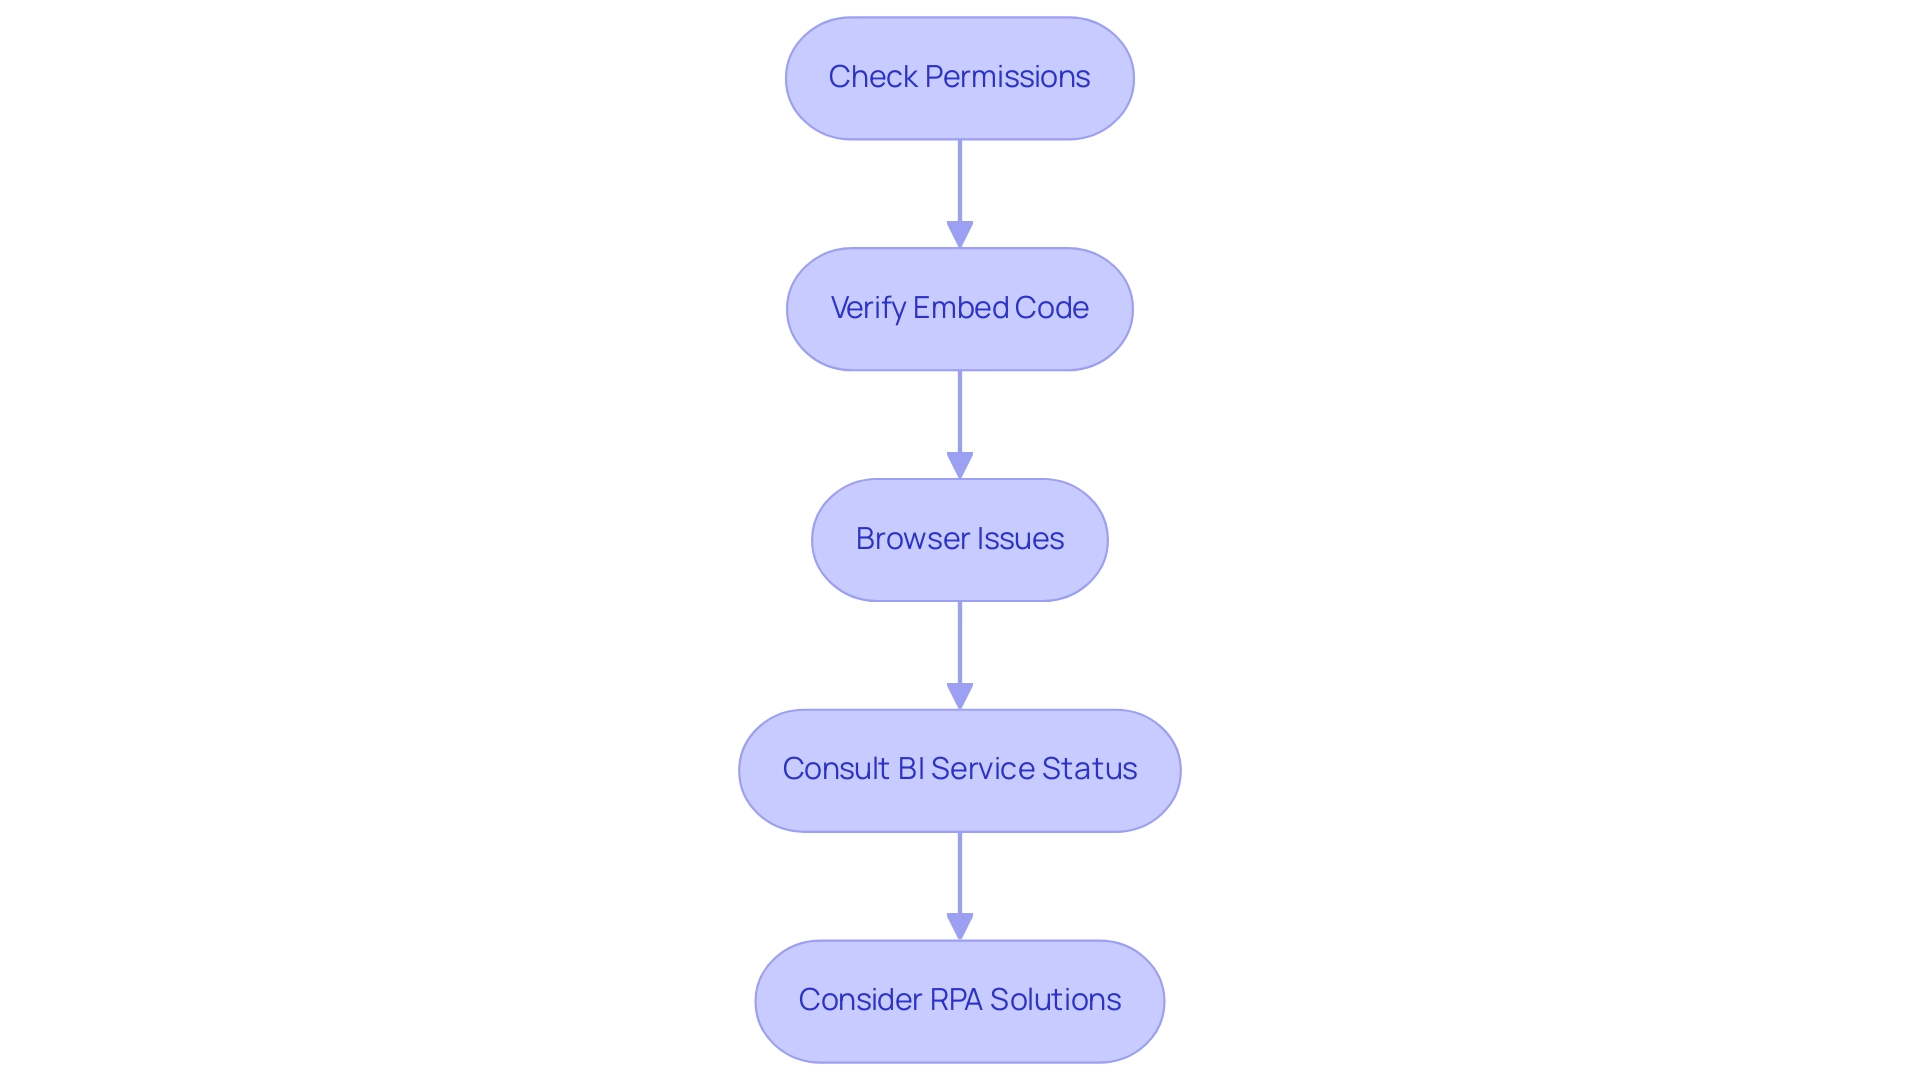
Check Permissions: Confirm that permissions in both BI and SharePoint are properly configured. Users must possess the appropriate access permissions to view the document seamlessly. According to community support representative v-frfei-msft, it’s crucial to remember that individuals viewing a report in SharePoint require either a BI Pro license or access to content in a workspace that operates under BI Premium capacity.
-
Verify Embed Code: A meticulous review of the embed code is vital. Even the slightest error can lead to display issues, preventing individuals from accessing the intended report.
-
Browser Issues: Browser compatibility can affect performance as well. Clearing the browser cache or switching to a different browser may resolve loading problems. Significantly, integrating BI in SharePoint Online is most effective in Chrome; individuals have reported compatibility issues when utilizing outdated browsers such as Internet Explorer, as highlighted in a case study where embedding worked well in Chrome but faced challenges in IE.
-
Consult BI Service Status: Service outages can occur, impacting the functionality of BI. Consistently review the BI service status page to remain updated on any current problems that might influence your analyses.
By following these troubleshooting approaches, users can confront difficulties related to embedding Power BI in SharePoint directly, ensuring that BI visuals are successfully incorporated within SharePoint. Furthermore, as you seek to enhance operational efficiency, consider integrating Robotic Process Automation (RPA) solutions, such as EMMA RPA and Power Automate, to automate repetitive tasks involved in information management. This method will not only reduce time-consuming report creation but also minimize inconsistencies, leading to more reliable insights.
By unlocking the full potential of Business Intelligence, you can transform raw data into actionable insights, empowering your decision-making process and fostering growth and innovation within your organization. Additionally, addressing the competitive disadvantage of lacking data-driven insights is crucial for maintaining a strong market position.
Conclusion
Integrating Power BI with SharePoint presents a transformative opportunity for organizations seeking to enhance their data-driven decision-making processes. By embedding interactive reports and dashboards directly within SharePoint, teams can access critical insights seamlessly, fostering collaboration and operational efficiency. The step-by-step guide provided illustrates how easy it is to prepare, embed, and manage these reports, ensuring that stakeholders are equipped with the information they need to make informed choices.
Effective management of permissions and access is paramount in safeguarding sensitive data while promoting a collaborative environment. By implementing robust permissions strategies, organizations can protect their information and streamline operations, ultimately driving growth. Moreover, it is essential to remain aware of the limitations and technical considerations that come with embedding Power BI reports. By addressing these challenges head-on, users can optimize performance and enhance user experience.
Lastly, troubleshooting common embedding issues ensures that the integration process runs smoothly, allowing teams to focus on deriving insights rather than getting bogged down by technical difficulties. Embracing these strategies not only maximizes the value of Power BI within SharePoint but also positions organizations for long-term success in an increasingly data-centric landscape. As businesses continue to evolve, leveraging the full potential of these tools will undoubtedly lead to improved operational performance and sustainable growth.
Introduction
In the dynamic landscape of data analytics, Power BI’s drill-through feature emerges as a game-changer, enabling users to navigate through reports with unprecedented ease and depth. This powerful capability allows for a meticulous examination of specific data points, transforming raw data into actionable insights that drive informed decision-making. By connecting various data narratives, stakeholders gain a holistic view of their operations, unlocking the potential for enhanced reporting and operational efficiency.
As organizations increasingly rely on data to guide their strategies, understanding and leveraging drill-through functionalities becomes essential. This article delves into the mechanics of cross-report drill-through, offering practical steps, best practices, and troubleshooting techniques to empower users in their analytical journeys.
Whether you’re looking to streamline reporting processes or enhance data accessibility, the insights provided here will equip you with the tools necessary to harness the full power of Power BI.
Understanding Drill Through in Power BI
The drill through cross report feature in Power BI stands out as a transformative capability that empowers users to navigate seamlessly between reports, offering deeper insights into their information. This capability enables a focused examination of specific information points, enhancing the analytical experience and facilitating a thorough exploration of underlying nuances. Especially valuable is its application in analyzing information from multiple perspectives, providing stakeholders with a richer, more comprehensive narrative about the story.
As Yang Liu aptly states,
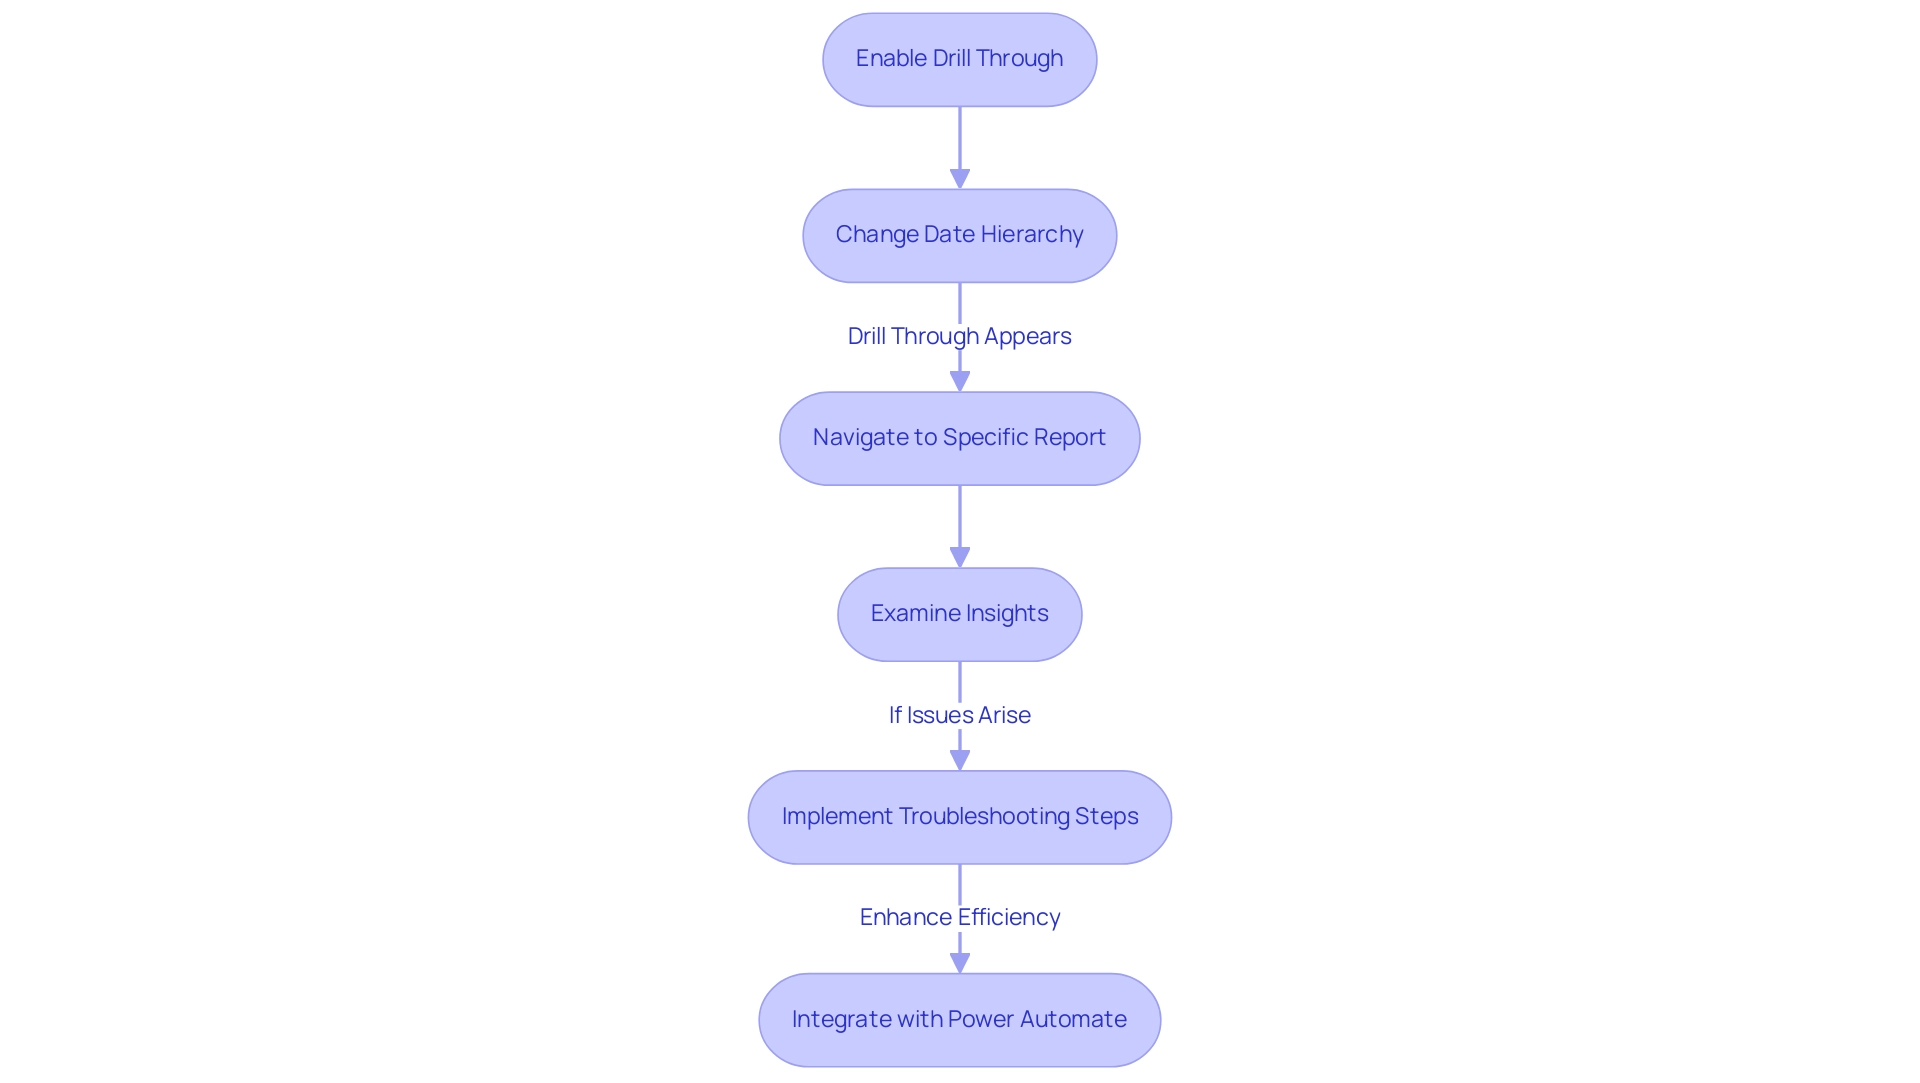
When the date hierarchy is changed to [Date] column, Drill through appears,
highlighting how this feature can be leveraged effectively.
Moreover, understanding the mechanics of drill through cross report is essential for users aiming to harness its full potential, ultimately leading to improved reporting and more informed information analysis processes. Users can gain from our 3-Day Power BI Sprint, which facilitates the swift development of professionally crafted documents, ensuring information consistency and actionable insights. Moreover, our General Management App provides extensive management solutions and intelligent evaluations, further improving the Power BI experience.
If the Usage Metrics summary still appears after removal, refreshing the browser is essential to ensure precise information representation. This troubleshooting step is vital for maintaining operational efficiency and ensuring that individuals have access to the most relevant data. The case study titled ‘Unused Reports Count‘ illustrates how identifying documents that have not been opened over a specified time period can guide decisions on maintenance, which is vital for optimizing resource allocation.
By integrating these insights, along with the capabilities of Power Automate for streamlined workflow automation and leveraging Robotic Process Automation (RPA) to automate manual tasks, users can significantly enhance their operational efficiency and decision-making capabilities, driving business growth in a rapidly evolving AI landscape.
Enabling Cross-Report Drill Through: Step-by-Step Guide
Activating cross-document exploration in Power BI is a simple procedure that can significantly improve your analytical abilities while tackling typical issues encountered in document creation. As Pragati puts it, “Hope this helps everyone out there.” Follow these steps to configure the feature effectively:
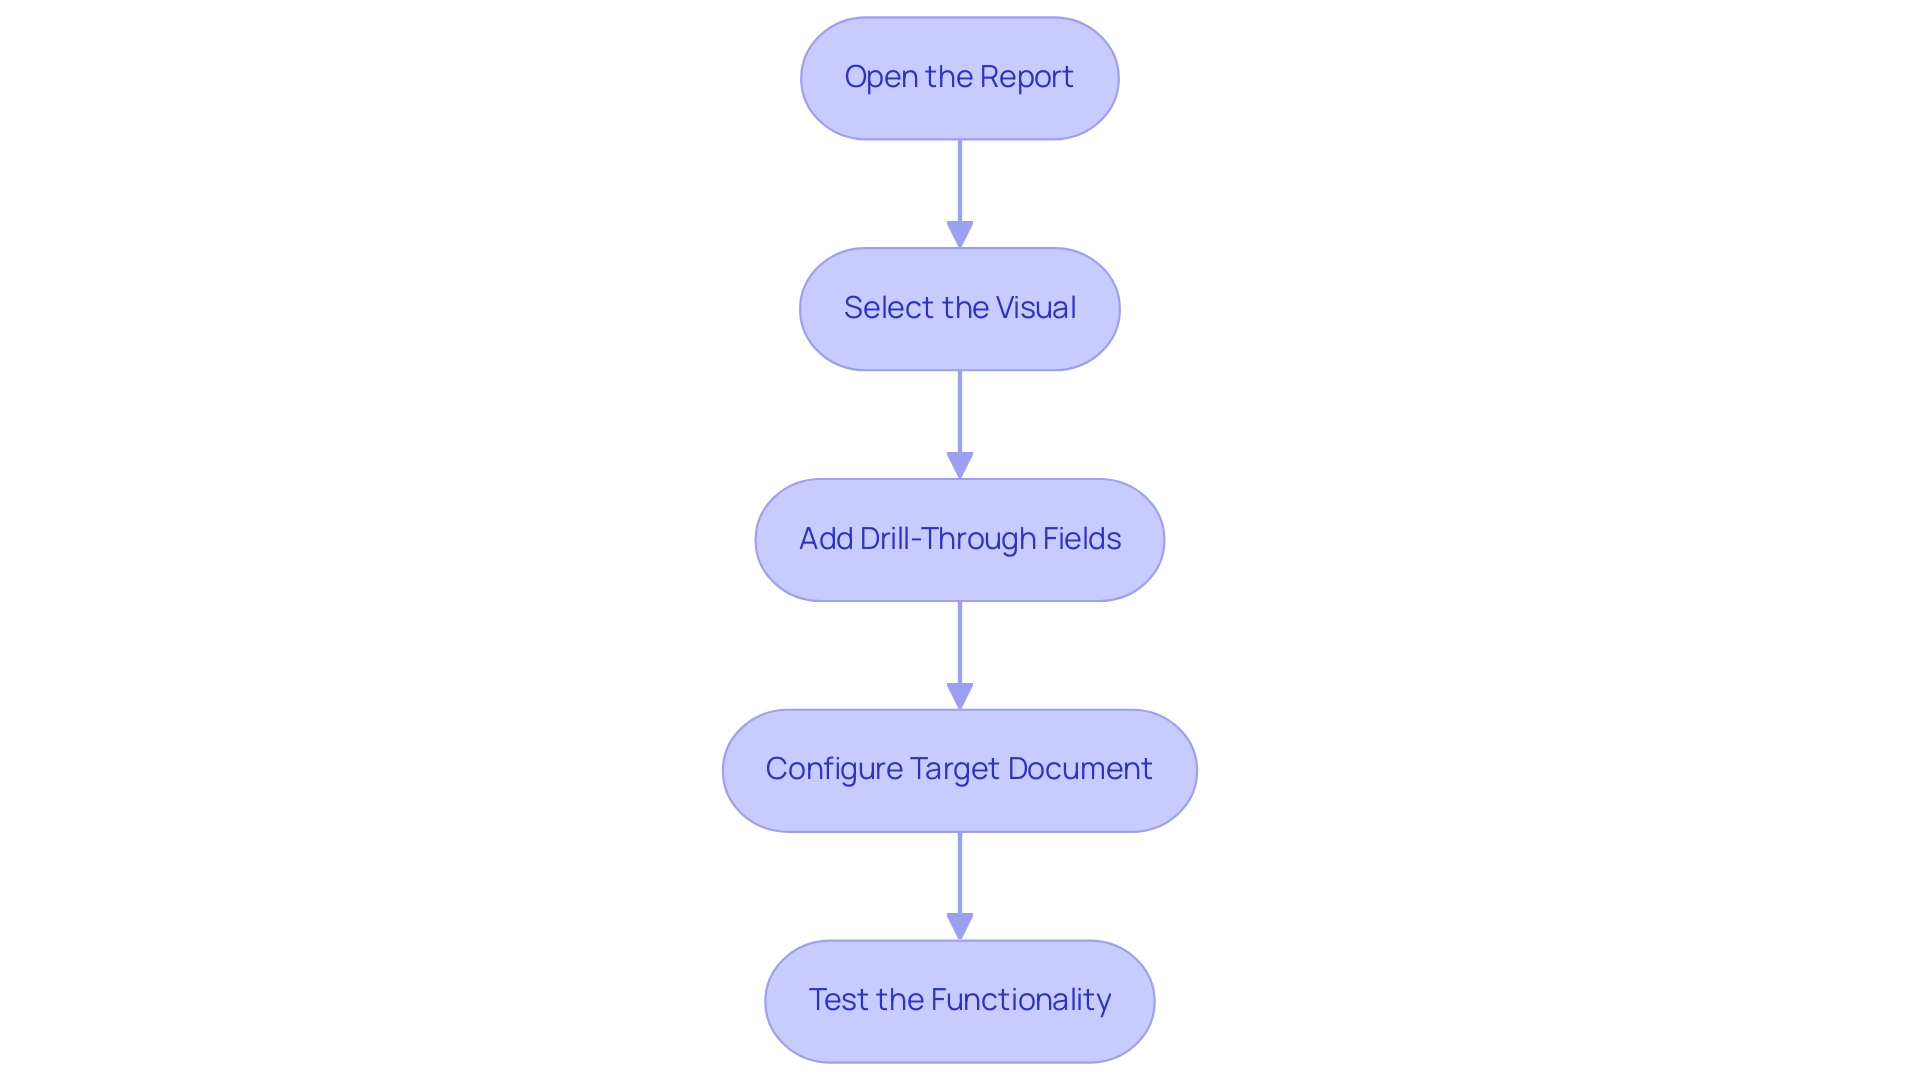
- Open the Report: Begin by launching the report where you plan to apply the detailed analysis.
- Select the Visual: Click on the visual element that will serve as the source for the action.
- Add Drill-Through Fields: In the visualization pane, locate the ‘Drill-down’ section and incorporate the fields that users will utilize for the drill-down.
- Configure Target Document: Proceed to the target document and confirm that it includes the corresponding detailed fields set up correctly.
- Test the Functionality: Once everything is set up, make sure to evaluate the drill-down feature by right-clicking on a data point in the source document and choosing the drill-down option. This will verify that it directs you to the suitable document.
With over 62.7K participants in the Data Visualization in Power BI course, the significance of mastering features such as detailed navigation is clear. By diligently following these steps, you can effectively enable drill through cross report functionality, thereby enhancing the overall interactivity and usability of your Power BI visualizations. Furthermore, think about incorporating Robotic Process Automation (RPA) to simplify repetitive activities related to document creation and utilize customized AI solutions for deriving actionable insights from your information.
These tools can assist in guaranteeing that the data utilized in your documents is consistent and managed properly, addressing the common issues of data inconsistencies. Arranging several slicers through the Selection pane can greatly enhance the layout of reports and boost interaction, ensuring your stakeholders have clear, guided access to the insights they require.
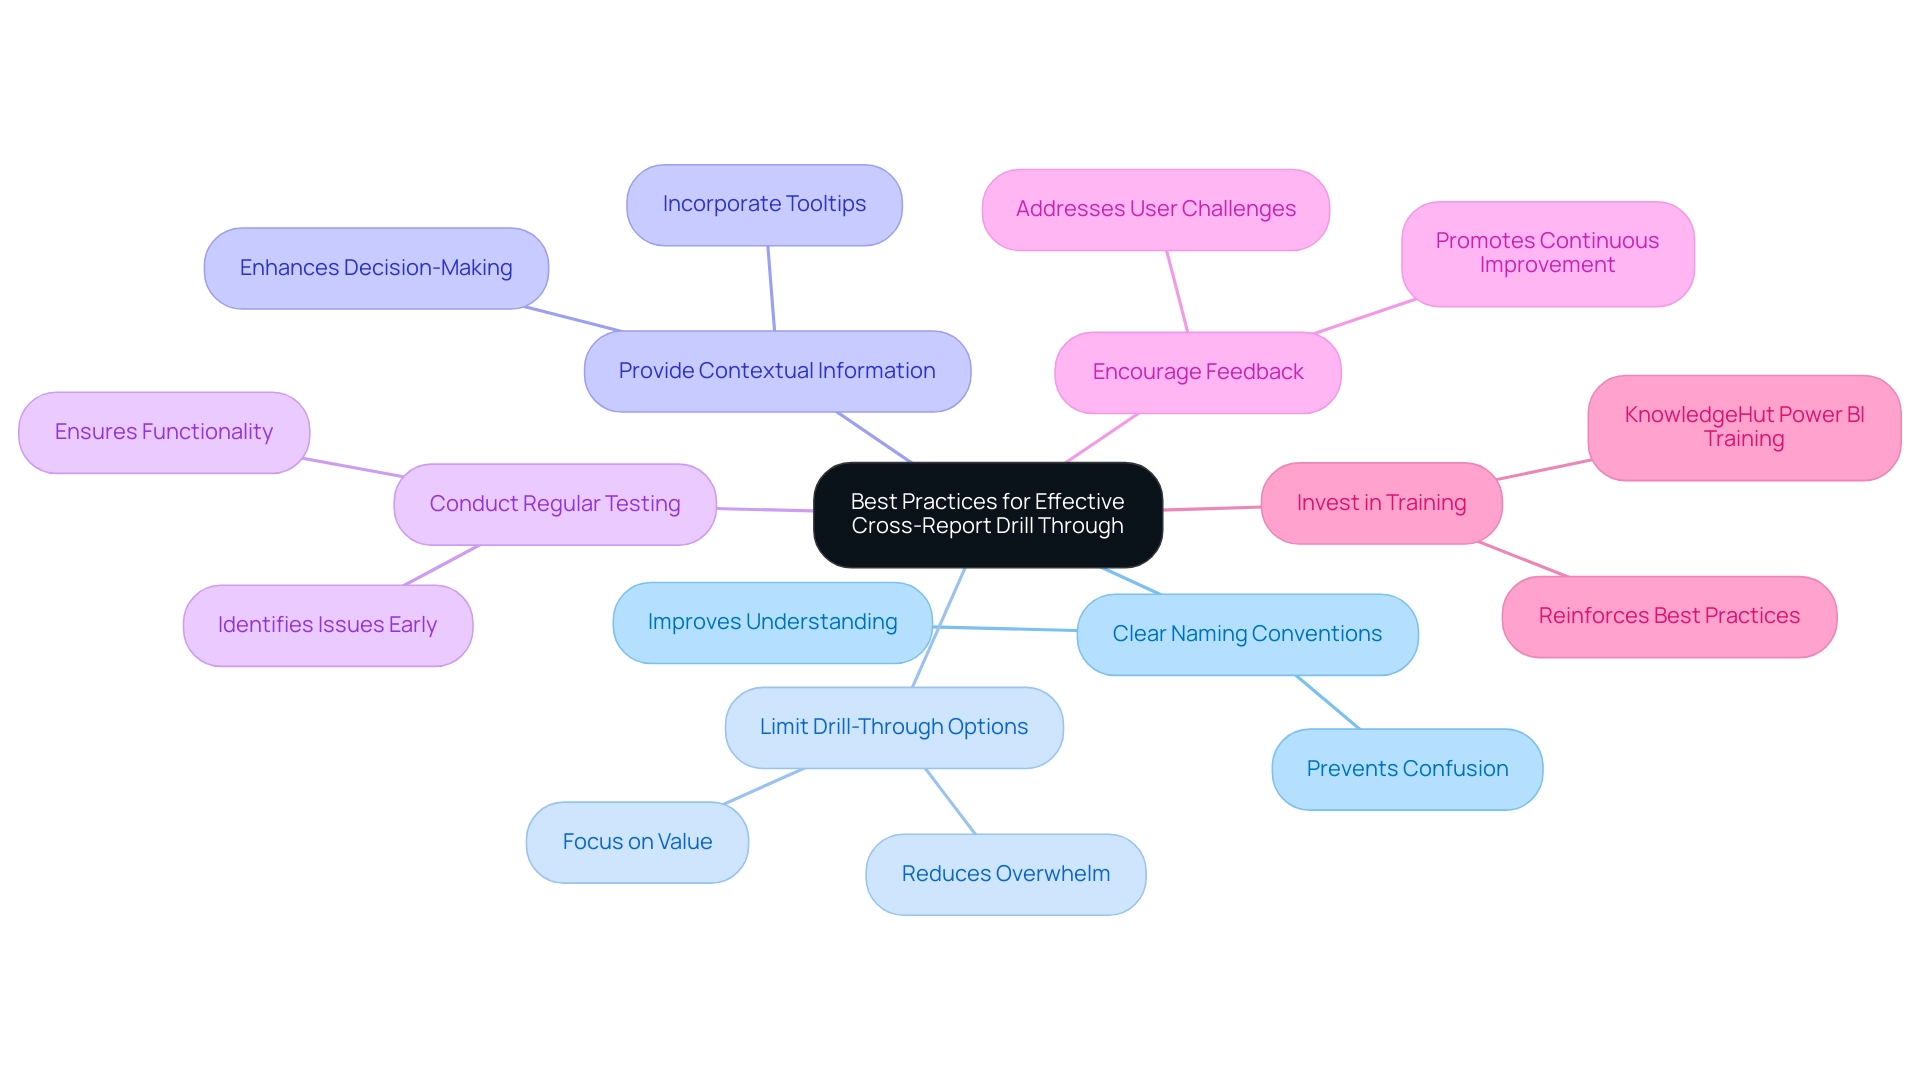
Best Practices for Effective Cross-Report Drill Through
To maximize the effectiveness of cross-report navigation in Power BI, implementing the following best practices is essential:
- Adopt Clear Naming Conventions: Clearly named drill-through fields are crucial for preventing confusion. Clear naming assists individuals in navigating documents effortlessly and improves overall understanding of information. This practice is essential to tackle the common problem of data inconsistencies across documents, which can result in confusion and mistrust.
- Limit Drill-Through Options: Providing too many choices can overwhelm individuals. Concentrate on restricting drill-through fields to those that provide the greatest value, ensuring individuals can easily locate pertinent information without distraction, thereby decreasing the time devoted to document creation.
- Provide Contextual Information: Incorporating tooltips or descriptions adds significant value by helping users understand the information they are accessing when drilling through, thus enhancing their decision-making capabilities and offering the actionable guidance often missing in reports. This addresses the challenge of stakeholders receiving information without a clear direction on the next steps.
- Conduct Regular Testing: Regularly testing the functionality ensures that it operates as intended and continues to deliver the expected insights. This proactive approach helps identify potential issues before they impact individuals and supports effective data management practices, including the establishment of a governance strategy to manage data consistency.
- Encourage Feedback: Actively seeking input on the features promotes an environment of continuous improvement. Comprehending experiences allows for adjustments that enhance functionality and usability, directly addressing the challenges of unclear guidance.
- Invest in Training: Courses like KnowledgeHut Power BI training can help beginners and intermediate professionals learn essential skills, further reinforcing the implementation of these best practices and driving data-driven insights.
By adhering to these best practices, organizations can significantly improve the user experience and effectiveness of drill-through cross-report navigation in Power BI. For example, the procurement department in one instance saved €96,000 over a 5-year cost analysis, illustrating the financial effect of efficient data management strategies in addressing challenges such as time-consuming document creation and data inconsistencies. Ultimately, these strategies lead to more informed decision-making and operational efficiency, highlighting the importance of Business Intelligence and RPA in fostering a data-driven culture.
Troubleshooting Cross-Report Drill Through Issues
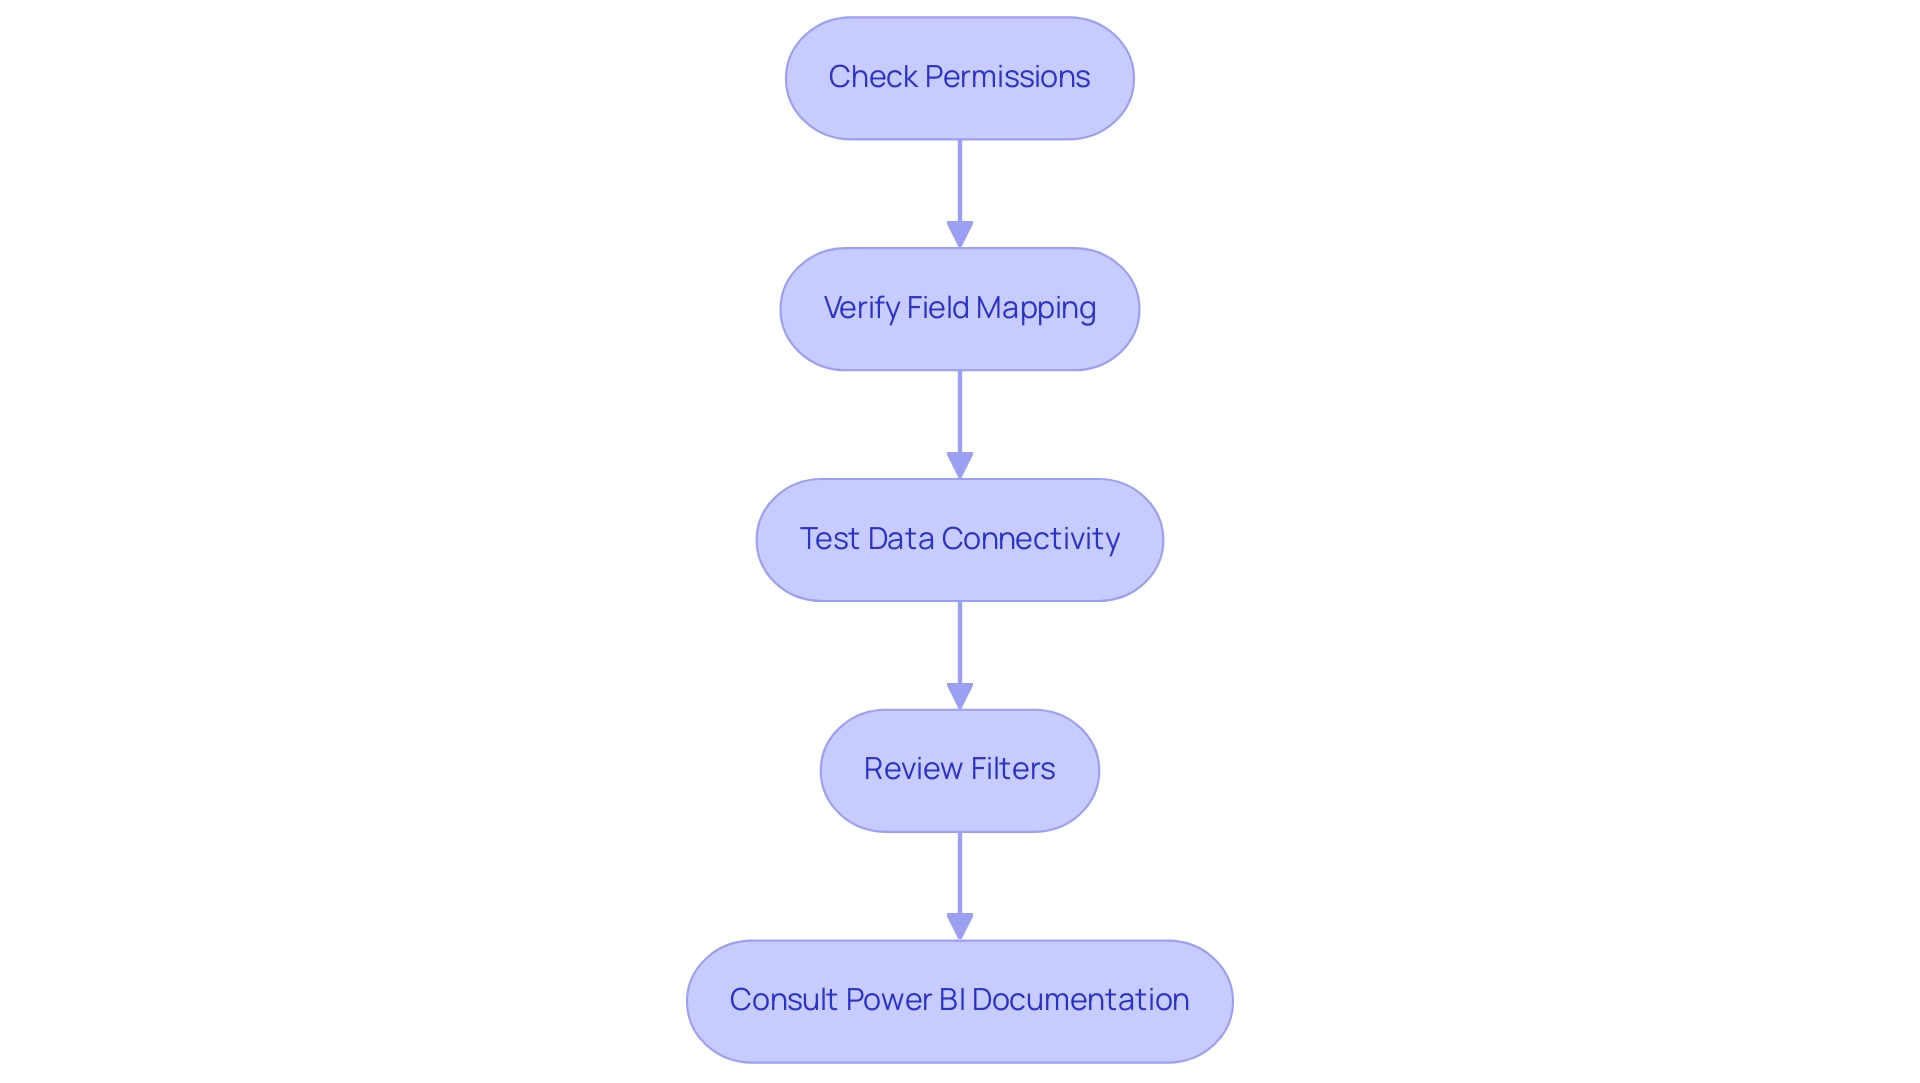
When facing challenges with cross-report drill-through in Power BI, employing the following troubleshooting strategies can be particularly beneficial:
-
Check Permissions: Confirm that individuals possess the necessary permissions to access both the source and target reports, as inadequate permissions can impede access. Statistics indicate that nearly 30% of individuals encounter issues due to permission settings, highlighting the importance of this step.
RPA can automate permission checks, ensuring users have the appropriate access levels without manual intervention. -
Verify Field Mapping: Ensure that the drill-through fields are accurately aligned between documents. Mismatches here can lead to incomplete or erroneous information displays.
RPA tools can assist in validating these mappings across documents, reducing human error. -
Test Data Connectivity: Evaluate that the data sources for both documents are suitably linked and reachable, as connectivity problems can hinder the functionality of in-depth analysis.
RPA can automate connectivity evaluations, notifying individuals of any disruptions in real-time. -
Review Filters: Investigate if any filters applied in the source report are inadvertently influencing the drill-through outcomes, potentially leading to unexpected results. As noted by Lizzie, operator error can often complicate these processes, such as when the Values fields are incorrectly set to ‘Sum’ instead of ‘Not Summarize’.
RPA can streamline this review process by automatically checking filter settings. -
Consult Power BI Documentation: Should problems persist, leverage Power BI’s official documentation for additional troubleshooting guidance and support.
Additionally, a case study comparing Power BI to QlikView highlights dissatisfaction stemming from issues like visibility of customers without sales transactions and challenges in exporting matrices to Excel. By implementing these strategies and embracing RPA solutions to automate repetitive tasks, users can effectively address common issues and significantly enhance their experience with drill-through cross-report functionality in Power BI. For example, a company that combined RPA with Power BI reported a 40% decrease in report generation time and enhanced accuracy, demonstrating the transformative power of these technologies.
Furthermore, unlocking the power of Business Intelligence can transform raw information into actionable insights, empowering informed decision-making that drives growth and innovation.
Advanced Use Cases for Cross-Report Drill Through in Power BI
Cross-report exploration in Power BI offers a strong opportunity for advanced information utilization across different business functions and can greatly assist in operational efficiency through the integration of Robotic Process Automation (RPA). Here are several impactful use cases:
-
Integrated Reporting: By utilizing detailed analysis features, organizations can effortlessly link financial and operational documents.
This integration empowers stakeholders to analyze financial performance alongside operational metrics, fostering a deeper understanding of business health. The cost of the Power BI Embedded plan is $1 per hour, making it a cost-effective solution for organizations looking to enhance their reporting capabilities and streamline workflows with RPA. -
Customer Journey Analysis: Marketers can utilize drill-through features to transition from marketing summaries to detailed sales information.
This connection provides valuable insights into customer behavior and conversion rates, enabling targeted strategies that enhance customer engagement. With Power BI, the adoption of data analytics is estimated to be 27% faster than with legacy BI tools, underscoring the efficiency benefits that resonate with operational goals. -
Project Management Insights: Drill-through functionality enables individuals to navigate from project dashboards directly to resource allocation documents.
This enhanced visibility into project performance equips project managers with critical information needed to optimize resource use and project outcomes. KASH Tech emphasizes the importance of adoption and provides a comprehensive rollout plan, ensuring that organizations can systematically implement these features to maximize efficiency. -
Sales Performance Monitoring: Sales teams can establish pathways that connect sales reports to real-time inventory information.
This connection ensures that teams understand stock levels and availability, facilitating informed decision-making that can boost sales effectiveness and align with operational strategies driven by RPA. -
Real-Time Information Exploration: Incorporating deep navigation in real-time dashboards offers users the capability to explore live information.
This immediate access to insights fosters a proactive environment where data-driven decisions can be made swiftly, showcasing the power of Business Intelligence in supporting operational efficiency. -
General Management App: The integration of the General Management App further enhances reporting capabilities, offering comprehensive management features and smart reviews that support strategic decision-making.
Exploring these advanced use cases not only maximizes the benefits of drill-through cross-report in Power BI but also promotes more thorough analysis and informed decision-making across the organization. As KASH Tech emphasizes, this systematic approach inspires confidence, ensuring that the process from analysis to strategy to implementation is predictable and effective. With a focus on data consistency and clear guidance, Power BI services empower organizations to drive operational efficiency and achieve their business objectives.

Conclusion
The drill-through feature in Power BI stands as a pivotal tool for enhancing data analysis and reporting within organizations. By enabling seamless navigation between reports, it allows users to dive deeper into specific data points, thereby transforming raw data into meaningful insights. This capability not only enriches the analytical experience but also fosters a more comprehensive understanding of the data narrative, essential for informed decision-making.
Implementing cross-report drill-through effectively requires a clear understanding of its mechanics and best practices. By adopting strategies such as:
- Clear naming conventions
- Limiting options
- Providing contextual information
organizations can significantly improve user engagement and the overall effectiveness of their reporting processes. Regular testing and user feedback further ensure that the drill-through functionality meets evolving needs and continues to deliver valuable insights.
Moreover, troubleshooting common issues, such as permission settings and field mapping, is crucial for maintaining operational efficiency. By employing automated solutions like Robotic Process Automation (RPA), organizations can streamline these processes, reduce errors, and enhance user experience. The integration of advanced use cases demonstrates how cross-report drill-through can facilitate:
- Integrated reporting
- Customer journey analysis
- Real-time data exploration
ultimately driving business growth and operational efficiency.
In conclusion, harnessing the full potential of Power BI’s drill-through feature empowers organizations to make data-driven decisions that propel them forward in a competitive landscape. By prioritizing best practices, leveraging automation, and embracing advanced analytics, stakeholders can unlock new levels of insight and efficiency, paving the way for sustained success.
Introduction
In the realm of data management, the ability to effectively utilize tools like Power Query can transform how organizations approach their analytical processes. Understanding the nuances between Duplicate and Reference Queries is not just a technical necessity; it is a strategic advantage that empowers data professionals to optimize workflows and enhance operational efficiency. As companies increasingly rely on data-driven insights to make informed decisions, mastering these query types can lead to quicker iterations, improved consistency, and ultimately, more reliable outcomes.
Whether experimenting with data transformations or ensuring that analyses reflect the latest updates, the right approach to queries can unlock new levels of agility and insight. This article delves into the fundamentals, practical applications, and step-by-step guides for harnessing the full potential of Duplicate and Reference Queries, equipping professionals with the knowledge to navigate common challenges and drive business success.
Fundamentals of Duplicate and Reference Queries in Power Query
In Power Query, comprehending the differences between duplicate vs reference power query is crucial for efficient information management and modeling, especially regarding utilizing Business Intelligence for operational effectiveness.
-
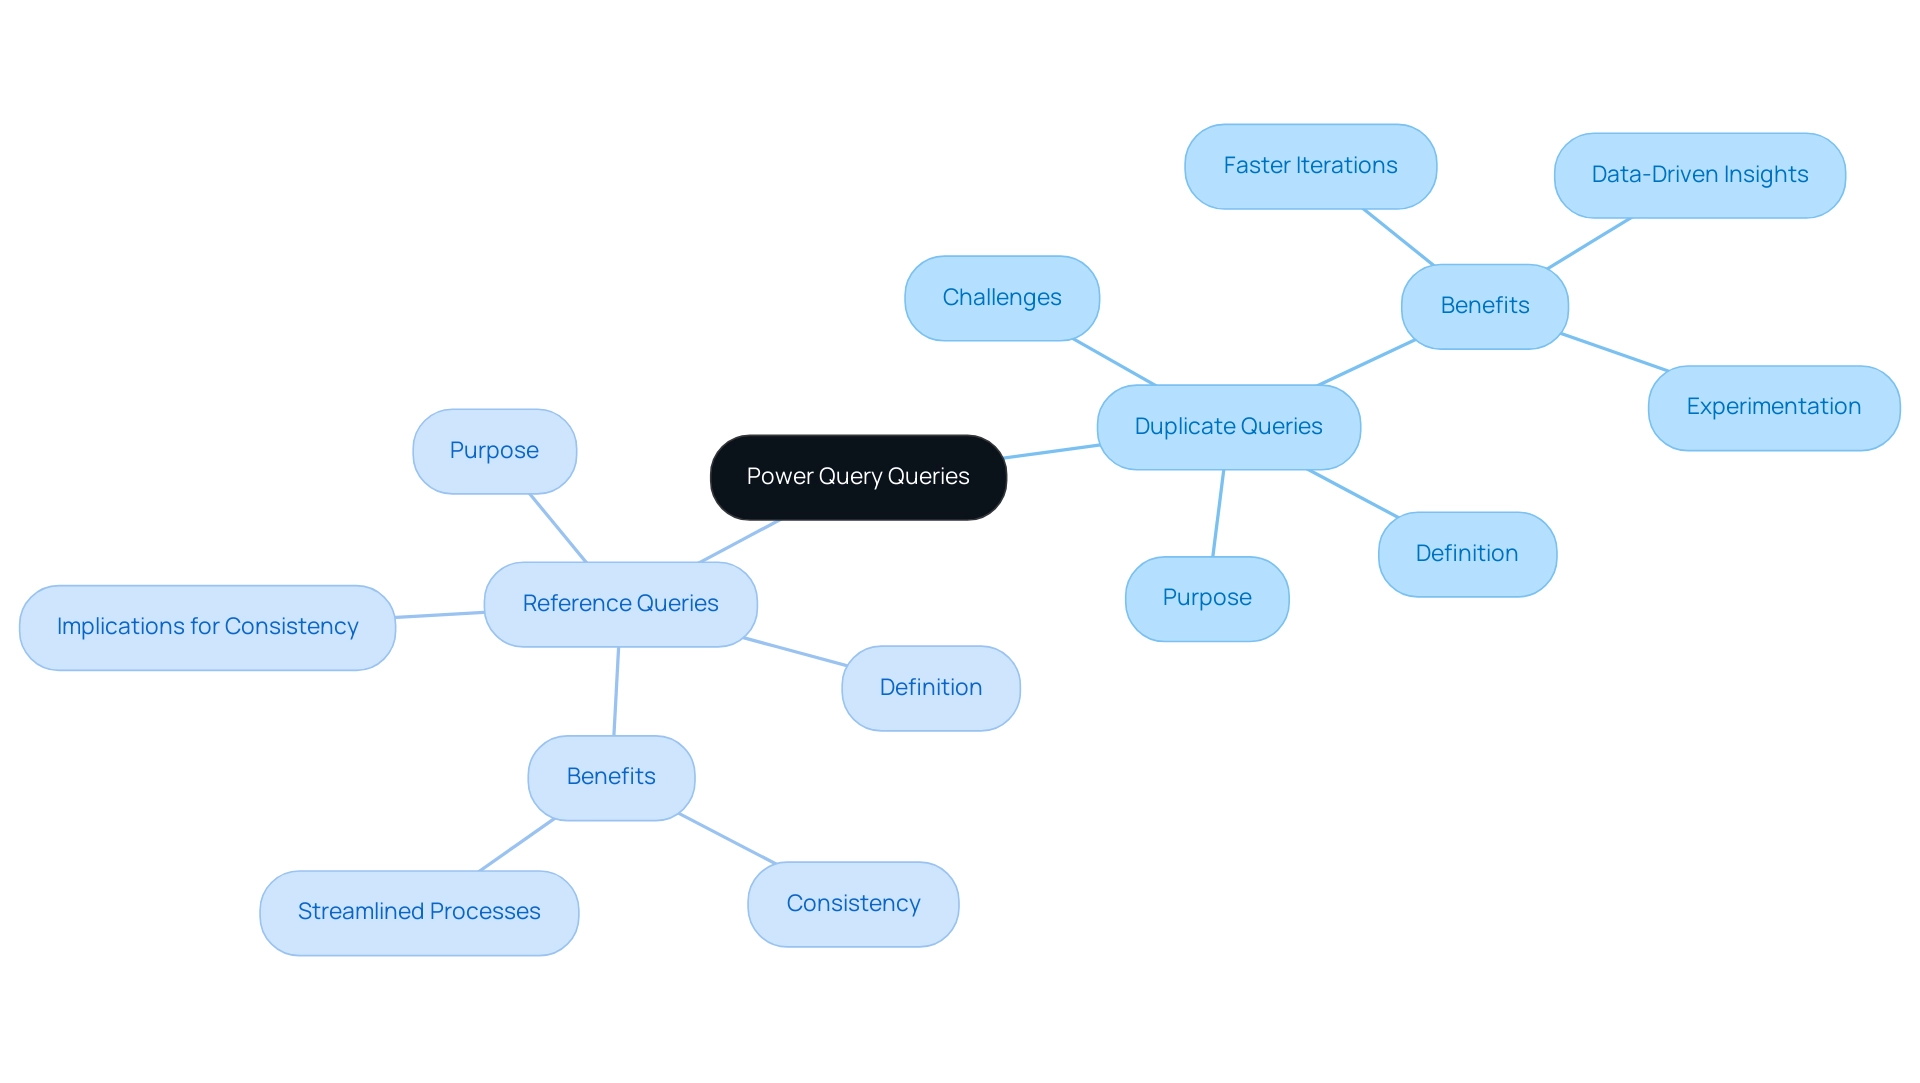
Duplicate Queries: Making a duplicate allows you to produce a copy of the initial dataset. This means that any transformations you apply in the duplicate do not affect the initial data source. Such functionality is particularly beneficial when you want to experiment with various analyses or transformations without altering the core dataset. This practice can help alleviate challenges like time-consuming report creation, enabling quicker iterations and more agile decision-making. As Pablo Genero, a BI Analyst and Data Visualization Engineer, points out,
While these small tips have little or no impact on performance, they can be beneficial in optimizing the workflow.
Furthermore, by enabling experimentation, Duplicate Queries can assist in revealing practical insights that influence strategic choices, tackling the obstacles created by an absence of data-driven insights. -
Reference Searches: Conversely, a reference search establishes a new search that depends on the initial request. Consequently, any modifications made to the original request will automatically cascade to the reference request. This feature is invaluable for maintaining consistency across interconnected queries, ensuring that all analyses derive from the same set of transformations. Such consistency helps address inconsistencies often encountered in Power BI dashboards, enhancing the reliability of insights derived from your information. Furthermore, this approach aligns with RPA solutions by streamlining processes and enhancing operational efficiency.
Understanding these distinctions, particularly in the context of duplicate vs reference power query, is pivotal for effective information modeling. By selecting the appropriate query type—whether for experimentation with duplicate vs reference power query or maintaining consistency with reference queries—you can tailor your approach to align with your objectives and enhance the efficiency of your analysis workflows. Furthermore, establishing clear communication protocols for reporting issues can simplify the investigation and resolution process, which is essential in information management.
Power Query conducts profiling over the first 1,000 rows of your information by default, significantly influencing your management practices. A real-world example of these concepts in action can be seen in the case study involving Kwixand Solutions, where the implementation of Power BI was enhanced through the effective use of Duplicate and Reference Queries, aligning with business needs and improving overall efficiency.
Practical Applications: When to Use Duplicate vs Reference Queries
Effectively utilizing the concept of duplicate vs reference power query can dramatically enhance your workflow, particularly in contexts like Ireland where analysis plays a crucial role in operational decisions. By integrating Robotic Process Automation (RPA) into these processes, you can further streamline tasks, reduce errors, and free your team for strategic initiatives. RPA specifically addresses the time-consuming nature of manual information handling, allowing for quicker and more precise processing.
Here are some key applications to consider:
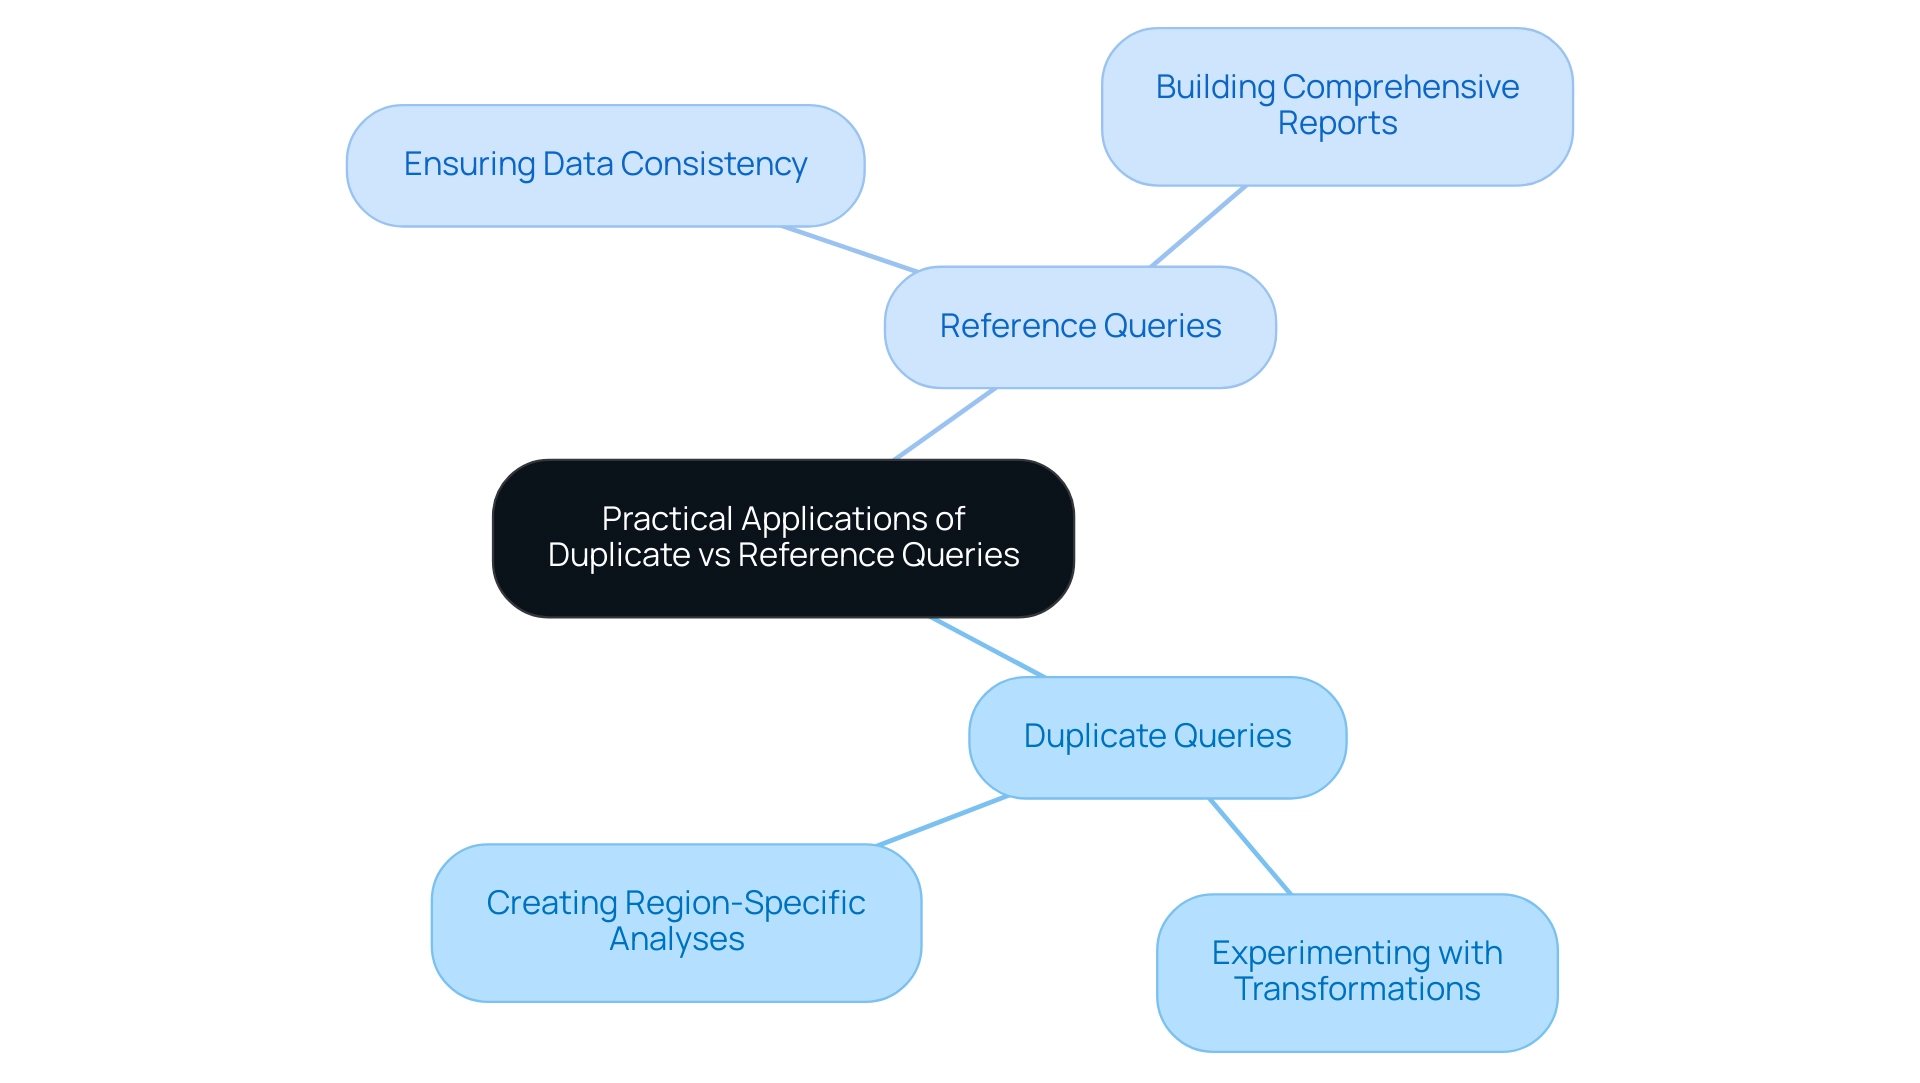
- When to Use Duplicate Queries:
- Experimenting with Transformations: For those looking to explore various data cleaning techniques or visualizations, duplicating a query allows for experimentation without jeopardizing the integrity of the original dataset. This approach ensures that you can test new ideas safely and revert to the original structure if necessary.
-
Creating Region-Specific Analyses: If your analysis involves sales data across different regions, duplicating the query allows you to tailor modifications specific to each region while preserving the original framework. This method enables targeted insights without altering foundational data.
-
When to Use Reference Queries:
- Ensuring Data Consistency: In collaborative settings where multiple analyses are based on a primary dataset, reference queries are essential. They assure that all following analyses reflect any updates made to the original request, maintaining uniformity and accuracy across the board. As noted in a case study about a junior data analyst, organizations that leverage SQL alongside these queries can significantly improve their data handling capabilities, reinforcing SQL’s status as a standard in the professional community.
- Building Comprehensive Reports: When constructing complex reports that aggregate data from multiple sources, reference queries play a critical role. They ensure that all report components are derived from the same transformations, significantly reducing the risk of discrepancies and enhancing the reliability of the insights presented.
For example, utilizing reference searches can result in enhanced information workflows, with statistics indicating an average customer lifetime value of $350, highlighting the significance of precise information analysis.
By using these practical applications alongside RPA, users can make informed choices on which search type to implement in the context of duplicate vs reference power query, ultimately enhancing their information analysis capabilities and promoting operational efficiency. RPA not only simplifies these processes but also tackles the common challenges of manual information handling, ensuring a more streamlined and effective workflow.
Step-by-Step Guide to Creating Duplicate Queries
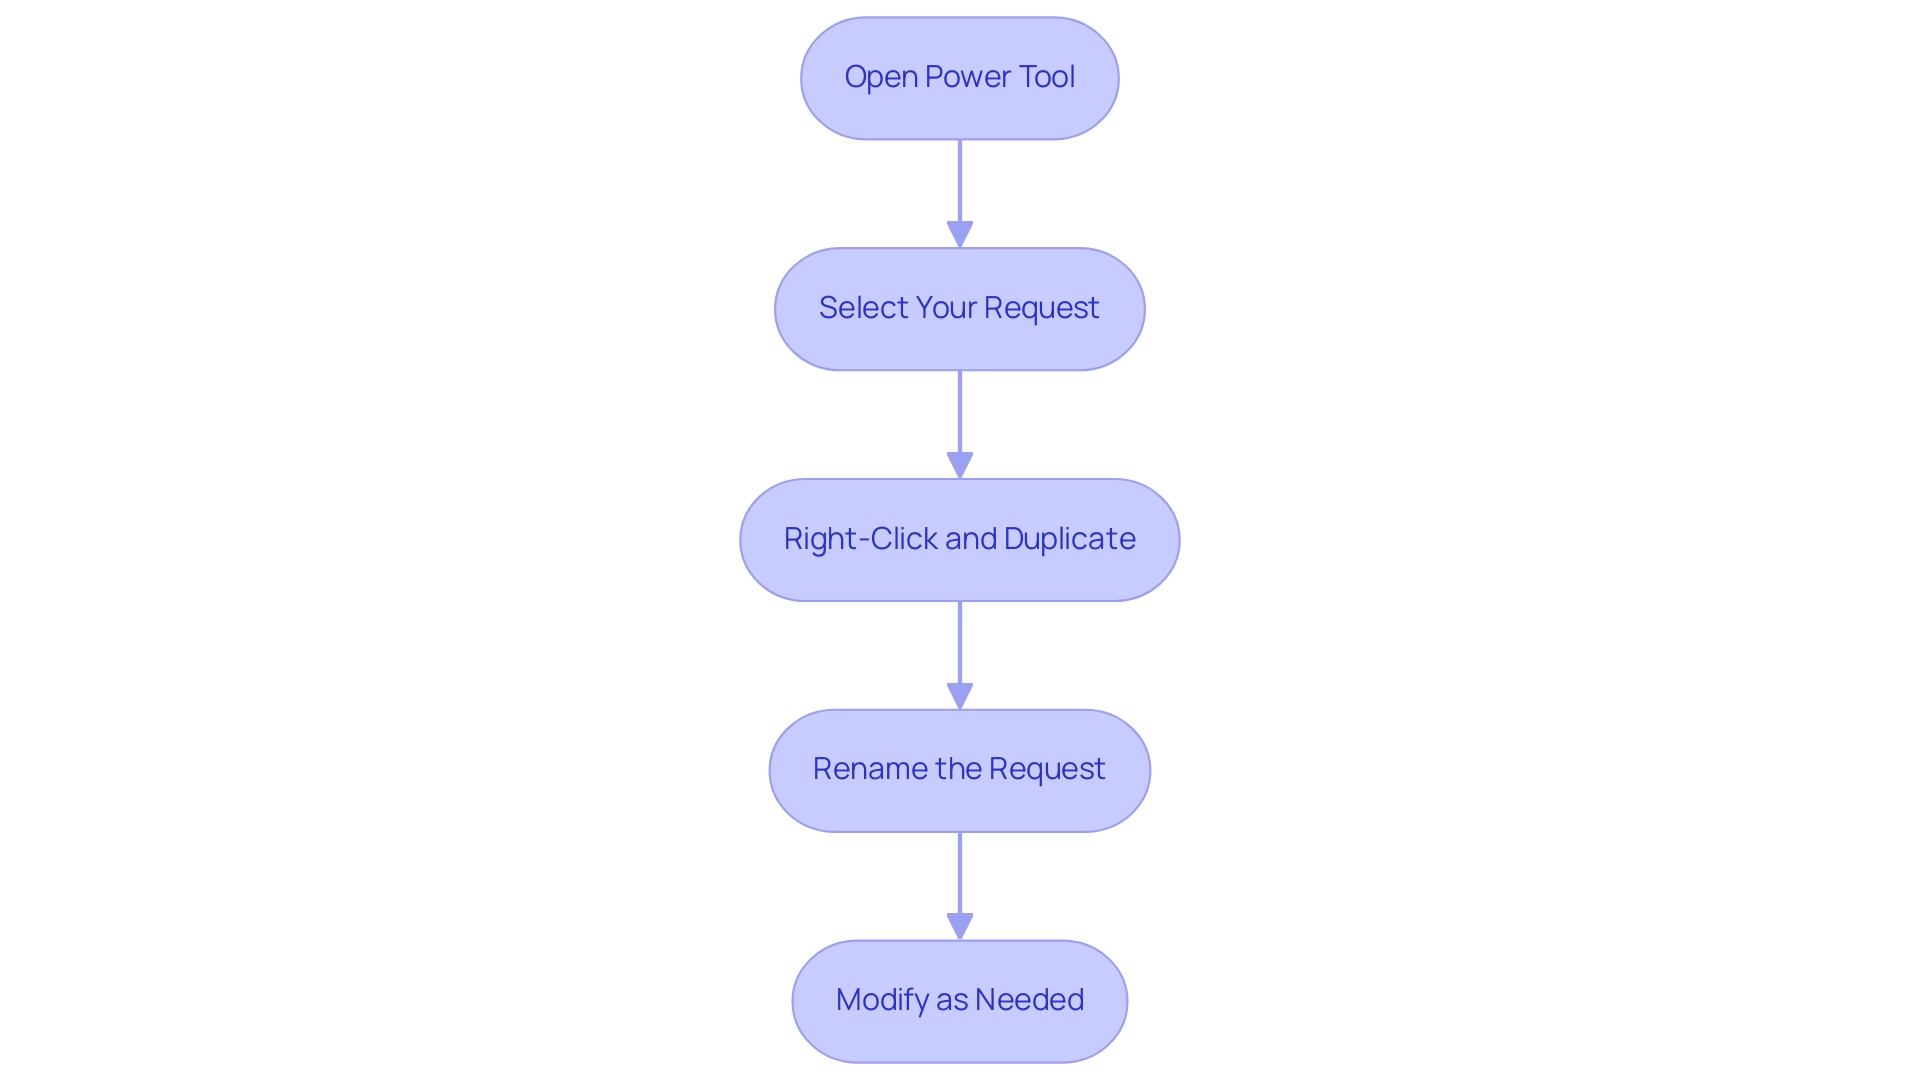
Generating a command in Power Query for the duplicate vs reference power query is a simple procedure that improves your capacity to analyze data while protecting your original dataset. Follow these easy steps:
- Open Power Tool: Launch Power Tool from your Excel or Power BI application to get started.
- Select Your Request: In the Queries pane, identify and select the request you wish to duplicate.
- Right-Click and Duplicate: Right-click on the selected item and choose ‘Duplicate’ from the context menu. This action generates a duplicate of your original request.
- Rename the Request: A new duplicated request will appear in the pane. To keep your work organized, right-click on this new request, select ‘Rename’, and enter a meaningful name such as ‘Sales Data Analysis Duplicate’.
- Modify as Needed: With your duplicated request ready, you can now apply various transformations and analyses without risking changes to the original structure.
Along with generating duplicate entries, it’s crucial to understand the concept of duplicate vs reference power query in order to eliminate duplicates in Power Query Editor. This can be accomplished by navigating to the Home tab and selecting ‘Remove Duplicates’, ensuring your information remains clean and manageable.
Also, keep in mind that Power Query performs profiling over the first 1,000 rows of your information by default, providing you with a thorough understanding of your dataset’s structure and quality.
As Scott Sugar, Head of ProServeIT’s Ho Chi Minh City office, states, “The ability to communicate with people, regardless of distance or location, is one of the best things about tech.” This sentiment emphasizes the significance of effective information management in enhancing operational efficiency.
By following these steps, you empower yourself to explore experimentation while maintaining the integrity of your original structure, thus fostering a more efficient workflow.
Step-by-Step Guide to Creating Reference Queries
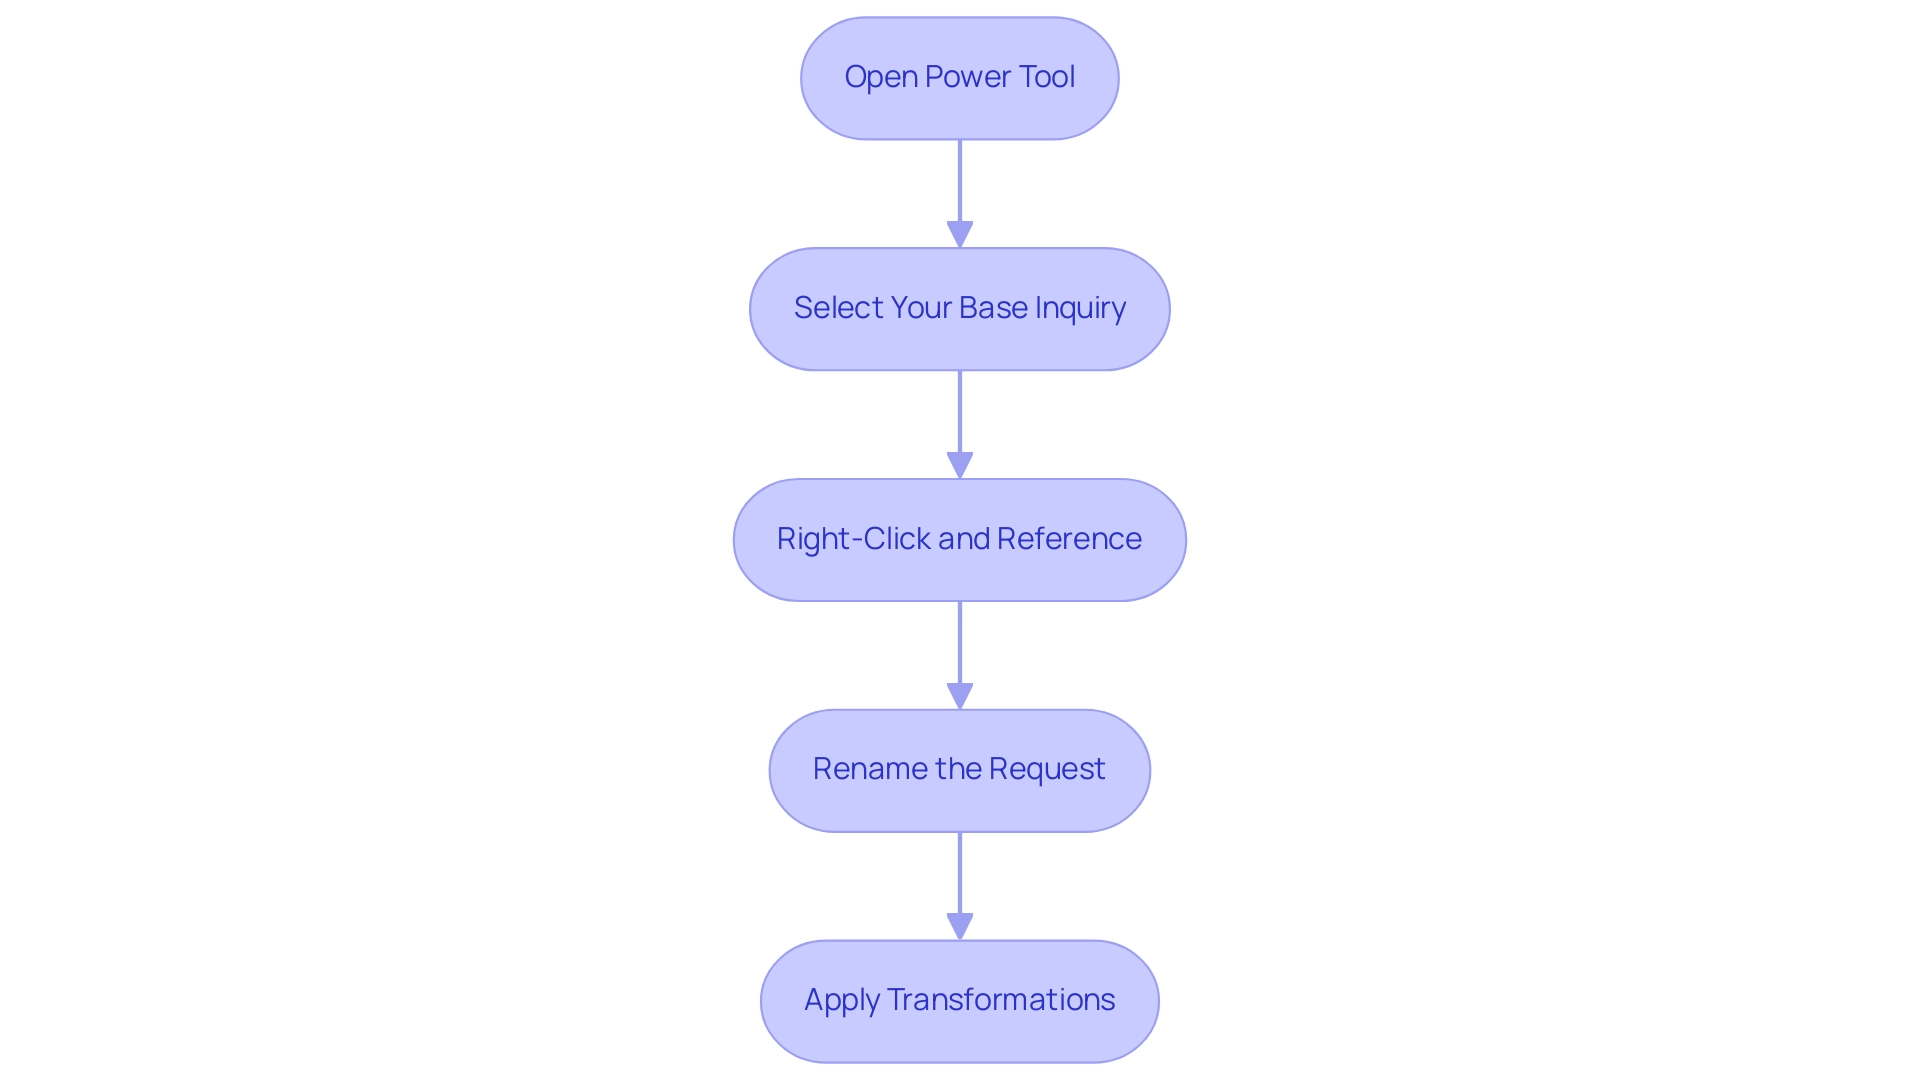
Developing a request for a duplicate vs reference power query in Power is a simple and fulfilling process that can greatly improve your data analysis skills while supporting your overall operational efficiency strategy. Follow these steps to streamline your workflows further:
-
Open Power Tool: Begin by launching Power Tool from your Excel or Power BI application.
-
Select Your Base Inquiry: Identify and select the original inquiry you wish to reference. This serves as the foundation for your new request, enabling consistent data analysis.
-
Right-Click and Reference: Right-click on the selected item and choose ‘Reference’ from the context menu.
This action will generate a new request linked to your original, facilitating automation in your reporting processes related to duplicate vs reference power query. -
Rename the Request: A new reference request will appear. To keep your workspace organized, right-click on it and select ‘Rename,’ then enter a descriptive name, such as ‘Sales Data Analysis Reference.’
-
Apply Transformations: You can now implement any necessary transformations to the reference request. Significantly, these transformations will consistently showcase the most recent modifications made to the initial inquiry, ensuring uniformity in your analysis.
Statistics indicate that utilizing duplicate vs reference power query can enhance consistency by up to 30%, making them an essential resource for information professionals. By mastering these steps, you empower yourself to create reference queries that adapt seamlessly to changes in your datasets, which is essential when evaluating duplicate vs reference power query, paving the way for a more flexible and reliable approach to dynamic information analysis. This technique not only enhances user satisfaction with Power Query’s reference features but also aligns with best practices in RPA and Business Intelligence.
For instance, tools like EMMA RPA and Power Automate can further streamline these processes, allowing for automated information retrieval and reporting, which alleviates the challenges of time-consuming report creation and inconsistencies often faced in Power BI dashboards. As observed by Florentin Smarandache, advancements in statistical analysis have the potential to significantly enhance information management, particularly in contexts of uncertainty. Furthermore, rigorous standards in information analysis, as highlighted in the case study on selective reporting, underscore the importance of maintaining integrity in your datasets.
Common Challenges and Solutions When Working with Queries
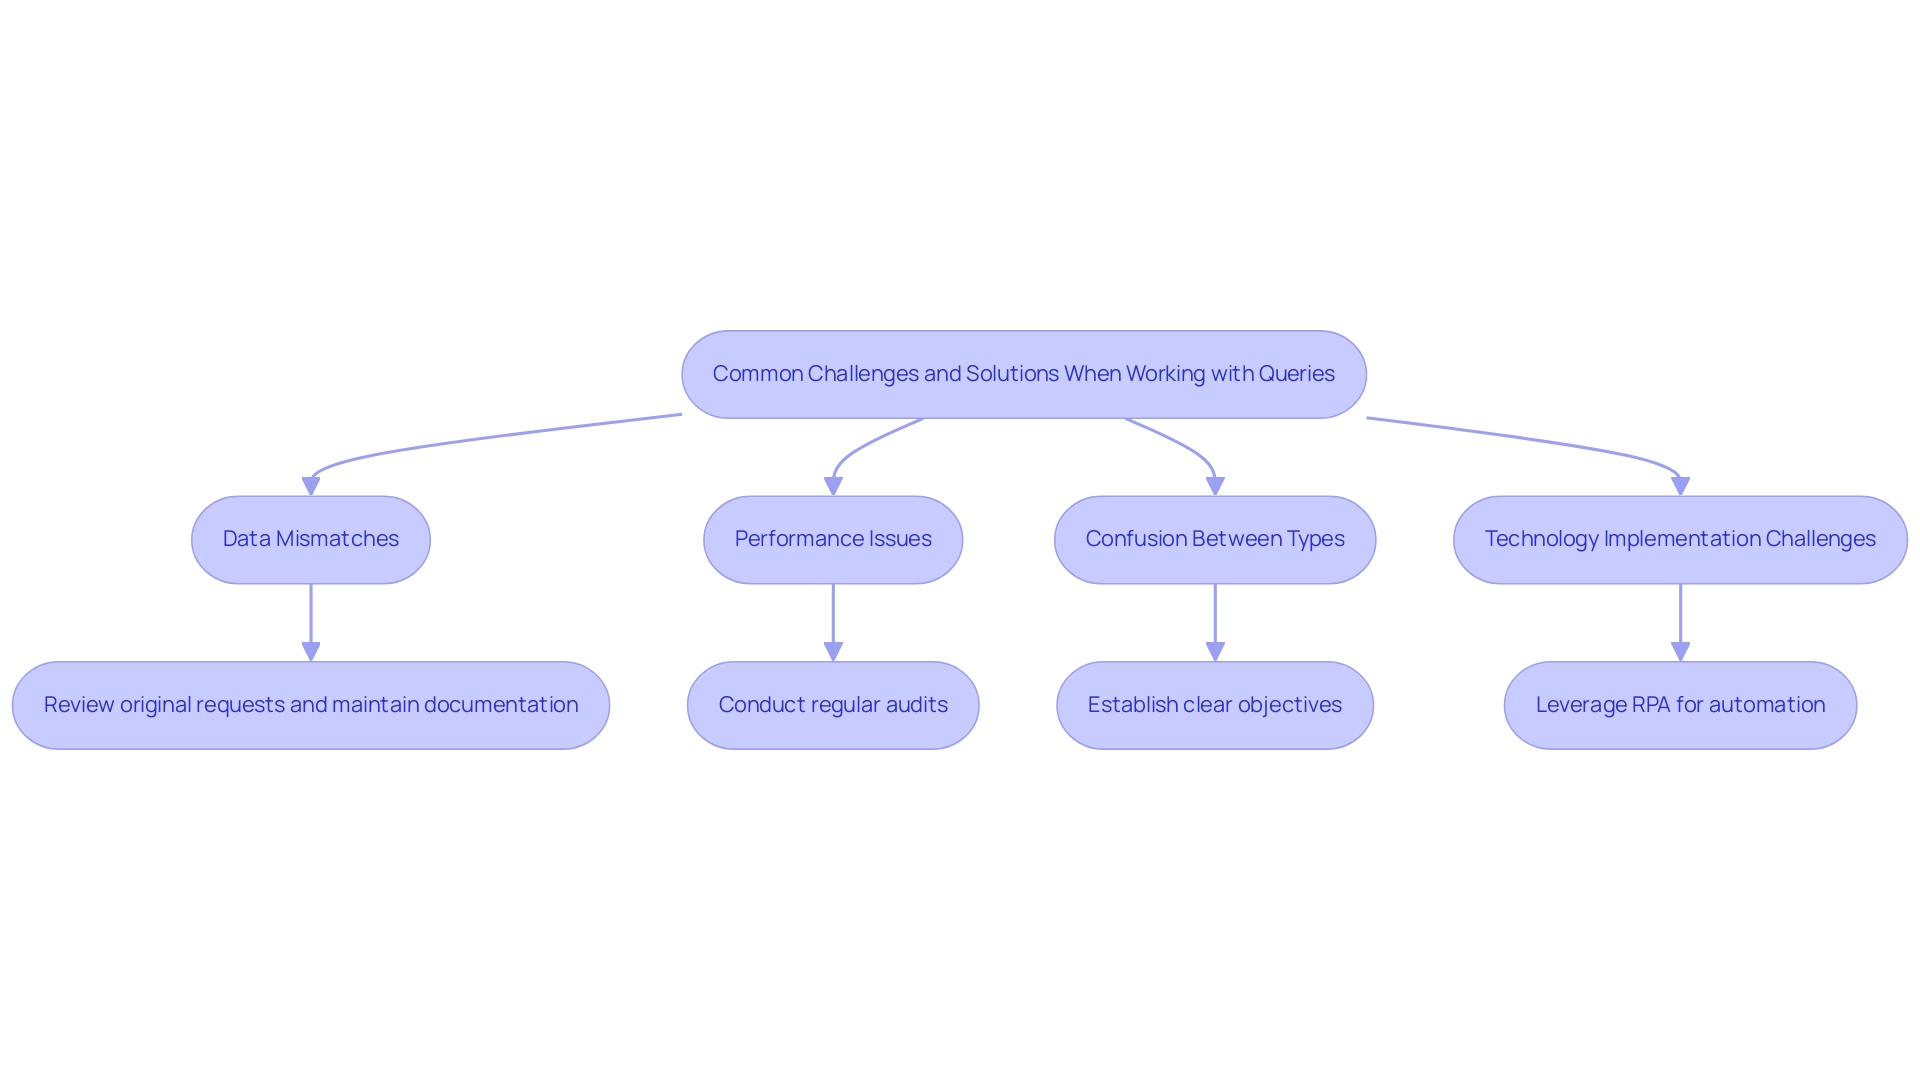
Navigating the complexities of duplicate vs reference power query requests can present various challenges, especially in light of the financial constraints many organizations face; 36% of data leaders report their data analytics budgets remaining the same for 2023. However, leveraging technologies like Robotic Process Automation (RPA) can significantly enhance operational efficiency and streamline manual workflows. Here’s a breakdown of common issues alongside their effective solutions:
-
Data Mismatches: One prevalent issue arises when reference requests experience mismatches due to changes in the initial dataset.
Solution: It is crucial to review the original request for any modifications before executing the reference request. Keeping detailed documentation of these changes will enhance clarity and prevent unexpected discrepancies. As highlighted by Verizon’s latest DBIR, hacking and misconfiguration errors are among the most prevalent sources of breaches, underscoring the importance of maintaining clean and precise management practices. Integrating RPA can streamline these review procedures, ensuring uniformity in information management. -
Performance Issues: Redundant requests can greatly impede performance, especially when numerous duplicates deplete system resources.
Solution: Conduct regular audits of your requests and remove any duplicates that are no longer necessary. This practice not only improves performance but also optimizes resource usage. The organizational framework, as demonstrated in the case study on CDO reporting arrangements, can influence how effectively these inquiries are handled, with 28.3% of CDOs reporting to the COO, which may impact decision-making in data management. By implementing RPA, organizations can automate these audits, further enhancing efficiency. -
Confusion Between Types: Many users encounter confusion regarding when to employ duplicate vs reference power query searches.
Solution: Establishing a clear objective prior to creating a search is essential. Ask yourself whether a duplicate vs reference power query, representing an independent request or a maintained connection to the original dataset, serves your needs best. Utilizing Business Intelligence tools can aid in clarifying these objectives by providing actionable insights that inform the best query strategy. -
Overcoming Technology Implementation Challenges: Implementing RPA can also address various technology challenges, such as resistance to change and integration with existing systems.
For instance, organizations can leverage RPA to automate information migration processes, reducing the burden on IT teams and ensuring smoother transitions. Tailored AI solutions can complement RPA by providing analytics that align with specific business goals, further enhancing operational efficiency.
By proactively addressing these challenges and implementing the suggested solutions, users can significantly enhance their proficiency in utilizing Power Query. Furthermore, embracing RPA and Business Intelligence will drive data-driven insights, ultimately leading to improved data management outcomes and fostering business growth.
Conclusion
Understanding the distinctions between Duplicate and Reference Queries in Power Query is essential for any organization aiming to harness the power of data effectively. Duplicate Queries allow for experimentation and tailored analyses without compromising the integrity of the original dataset, fostering innovation and agility in decision-making. On the other hand, Reference Queries ensure consistency and reliability by linking back to the original query, which is crucial for maintaining accuracy across various analyses and reports.
The practical applications of these query types reveal their importance in real-world scenarios. Whether preparing region-specific analyses or constructing comprehensive reports, the strategic use of Duplicate and Reference Queries can streamline workflows and enhance operational efficiency. Implementing Robotic Process Automation (RPA) alongside these queries further optimizes processes, allowing teams to focus on strategic initiatives rather than manual data handling.
Navigating the complexities of data management can present challenges, but by embracing the right tools and methodologies, organizations can overcome these hurdles. By utilizing the step-by-step guides provided for creating both Duplicate and Reference Queries, professionals can empower themselves to make informed decisions that drive business success. Ultimately, mastering these queries not only enhances data analysis capabilities but also positions organizations to thrive in a data-driven landscape, ensuring they remain agile and competitive in their respective markets.
Introduction
In a world where data is the lifeblood of modern organizations, navigating the complexities of data management has never been more crucial. Delta Lake emerges as a game-changing solution, offering a robust open-source storage layer that enhances the reliability and efficiency of data lakes. By facilitating ACID transactions and enabling seamless integration of streaming and batch data processing, Delta Lake empowers businesses to harness their data effectively.
Coupled with Robotic Process Automation (RPA), organizations can automate tedious workflows, minimize errors, and allocate resources to higher-value tasks. As the demand for real-time analytics grows, understanding the capabilities of Delta Lake becomes essential for those looking to gain a competitive edge in an increasingly data-driven landscape.
This article delves into the transformative power of Delta Lake, exploring its practical applications, key features, and how it can revolutionize data management strategies in conjunction with RPA.
Understanding Delta Lake: Definition and Importance
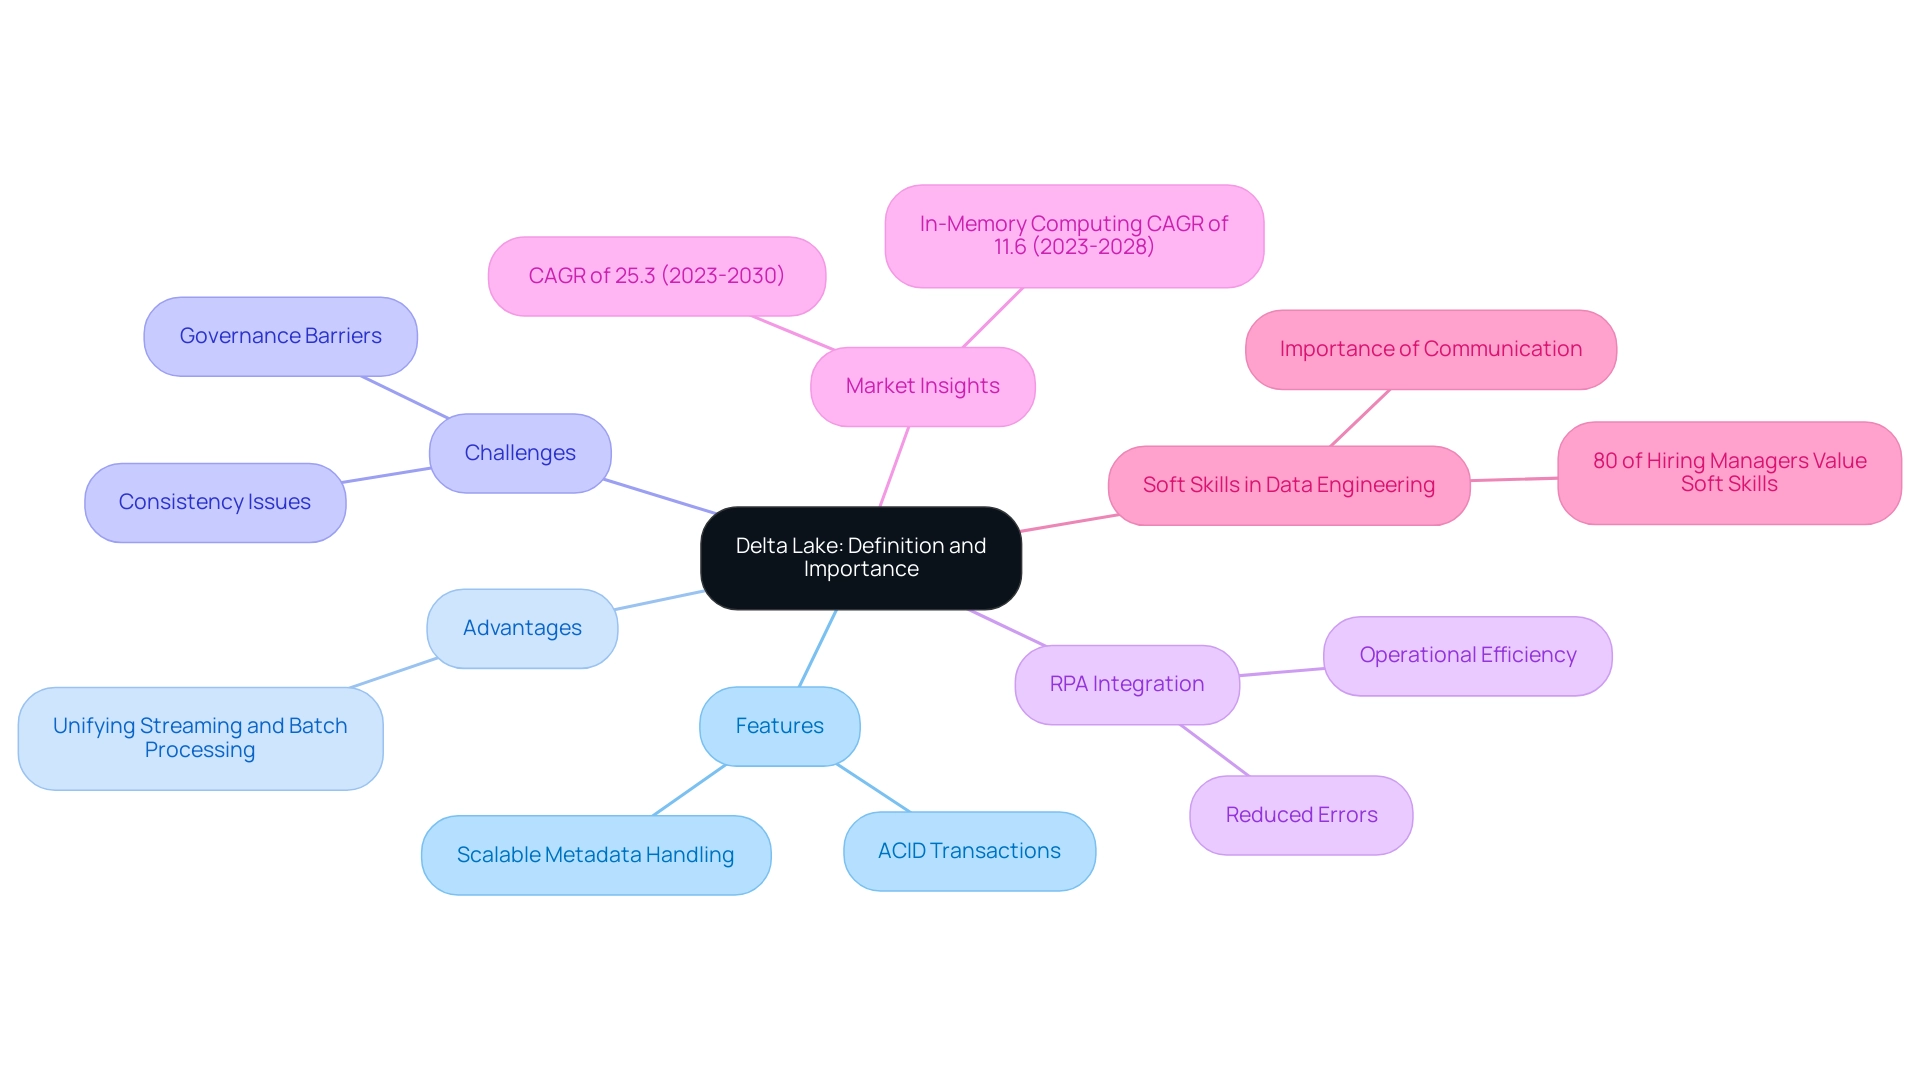
This solution functions as a revolutionary open-source storage layer that improves the reliability and efficiency of information reservoirs, essential for entities seeking to optimize their management through advanced technologies. By enabling ACID transactions and scalable metadata handling, it ensures that information remains consistent and accessible. One of the primary advantages of Delta Lake is its ability to unify streaming and batch information processing, which is essential for organizations seeking to harness their resources effectively.
In conjunction with Robotic Process Automation (RPA), businesses can automate manual workflows, reducing errors and freeing up team resources, thereby enhancing operational efficiency in a rapidly evolving AI landscape. The challenges linked to traditional lakes—such as ensuring consistency and governance—are significant barriers to deriving actionable insights. As Paul Stein, Chief Scientific Officer at Rolls-Royce, notes,
- “We generate tens of terabytes of information on each simulation of one of our jet engines.”
- “We then have to use some pretty sophisticated computer techniques to look into that massive dataset and visualize whether that particular product we’ve designed is good or bad.”
This emphasizes the need for strong frameworks that not only support intricate information operations but also improve integrity and reliability. With the anticipated CAGR of 25.3% for storage technologies from 2023 to 2030, organizations that utilize this framework alongside RPA stand to gain a competitive advantage in information management, ultimately resulting in enhanced decision-making and organizational agility.
Additionally, as emphasized in a case analysis, soft skills like communication are becoming ever more essential for engineers, highlighting the necessity for experts who can efficiently articulate the advantages of RPA and enhance operational efficiency. To explore how RPA can transform your information management processes, consider implementing tailored RPA solutions that align with your business goals.
Practical Applications: Reading and Writing Data in Delta Lake
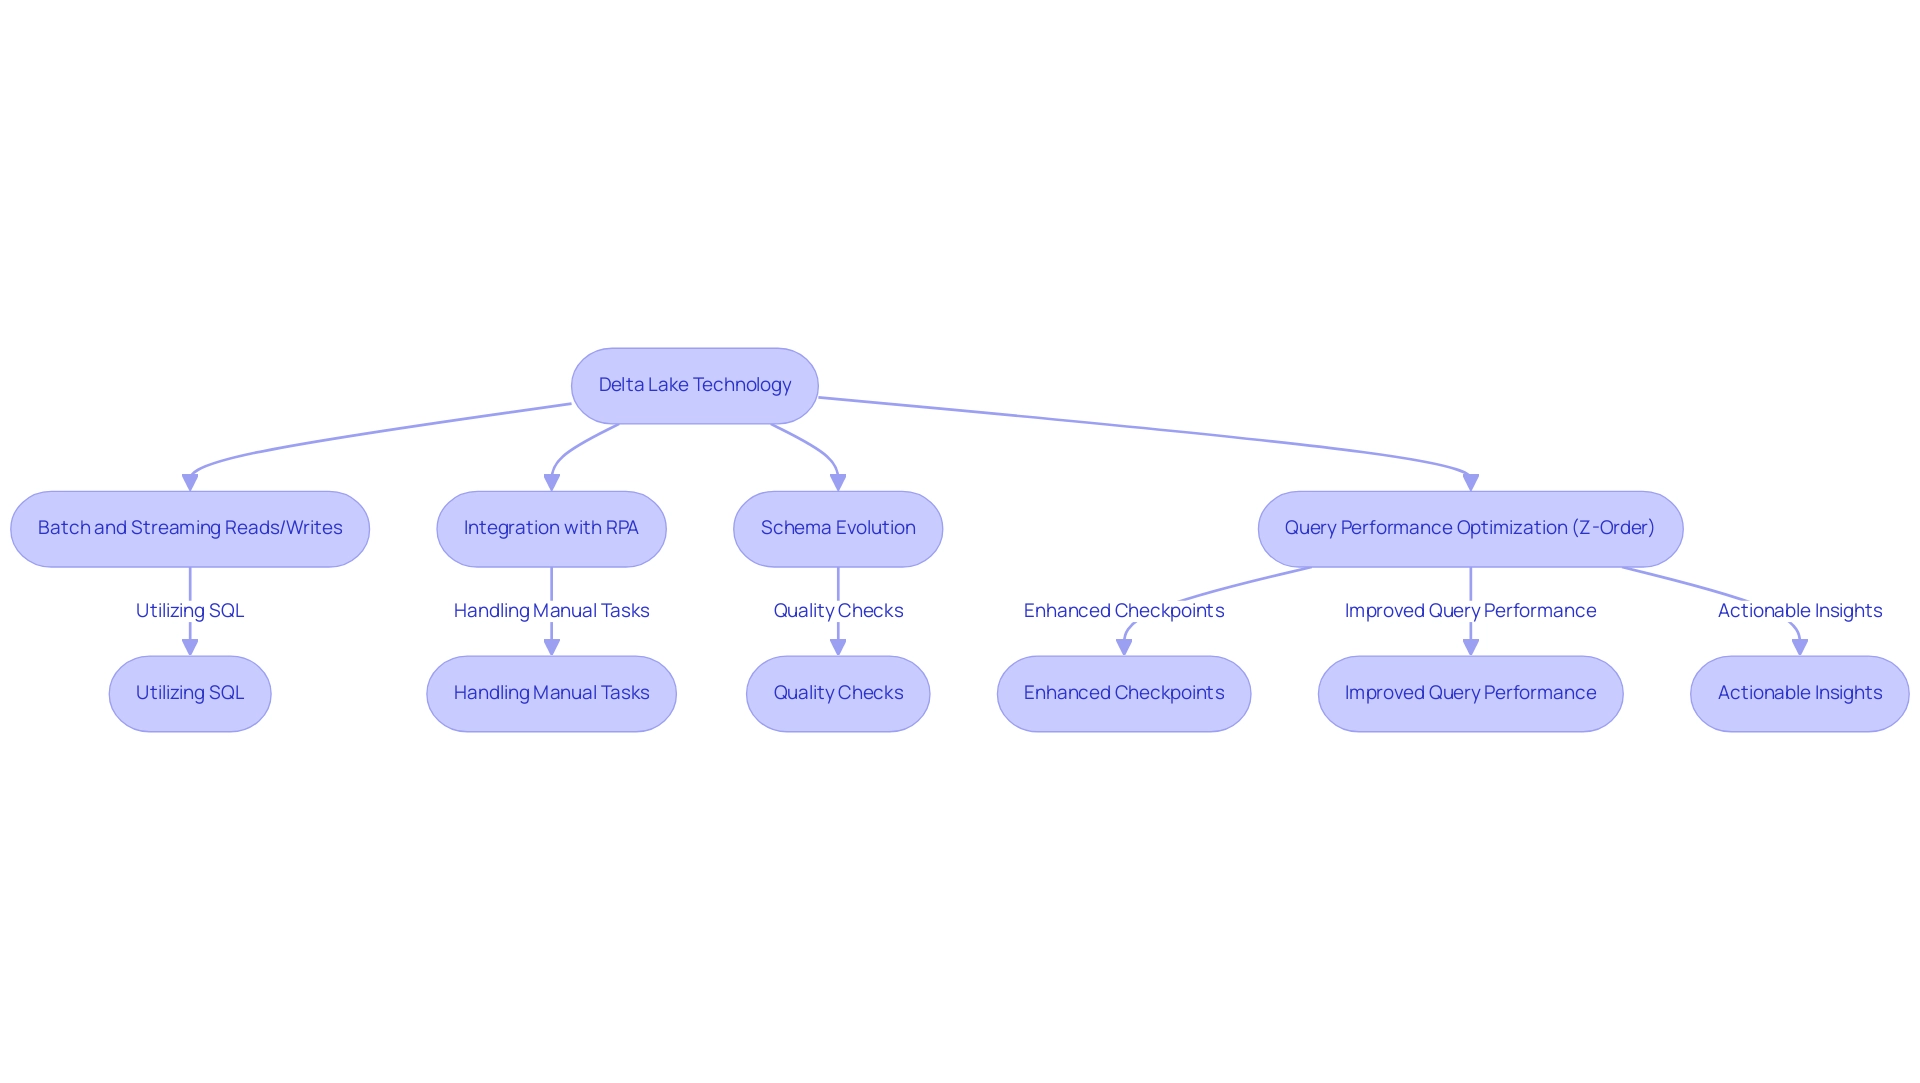
This technology empowers users to effortlessly carry out a range of operations, effectively handling both batch and streaming reads and writes. This flexibility allows users to write information in formats such as Parquet while querying it through SQL or utilizing processing frameworks like Apache Spark. As organizations encounter rising demands for real-time analytics and the challenging task of pinpointing the right AI solutions, integrating a data storage system with Robotic Process Automation (RPA) can streamline workflows, enhance efficiency, and lower operational expenses.
This integration addresses the challenges posed by manual, repetitive tasks, allowing teams to focus on strategic initiatives. As noted by expert Fernando De Nitto, ‘You should partition your information as much as you can since this operation is presented as a best practice in the official Delta Lake documentation.’ This emphasizes the significance of schema evolution and the enforcement of quality checks during operations, significantly enhancing the reliability of management.
Notably, Structured Streaming workloads can enable enhanced checkpoints if they don’t have low latency requirements, which is essential for organizations aiming for efficient data processing. Moreover, utilizing Business Intelligence with a data platform can unveil the potential of actionable insights, fostering informed decision-making that accelerates growth and innovation. For those curious about deeper insights, additional investigation of the transaction log of the data storage can be found in ‘Diving into Data Storage: Unpacking the Transaction Log v2’.
Furthermore, the Z-Order optimization method illustrates a practical use of the technology, enhancing query performance by physically organizing related information together according to specific column values, decreasing execution time from 4.51 seconds to 0.6 seconds. By leveraging Delta’s capabilities alongside RPA and Business Intelligence, organizations can effectively oversee information pipelines that require near real-time updates, ensuring that analytics are consistently reflective of the most current information available.
Where Are Delta Lake Files Stored? Understanding Storage Locations
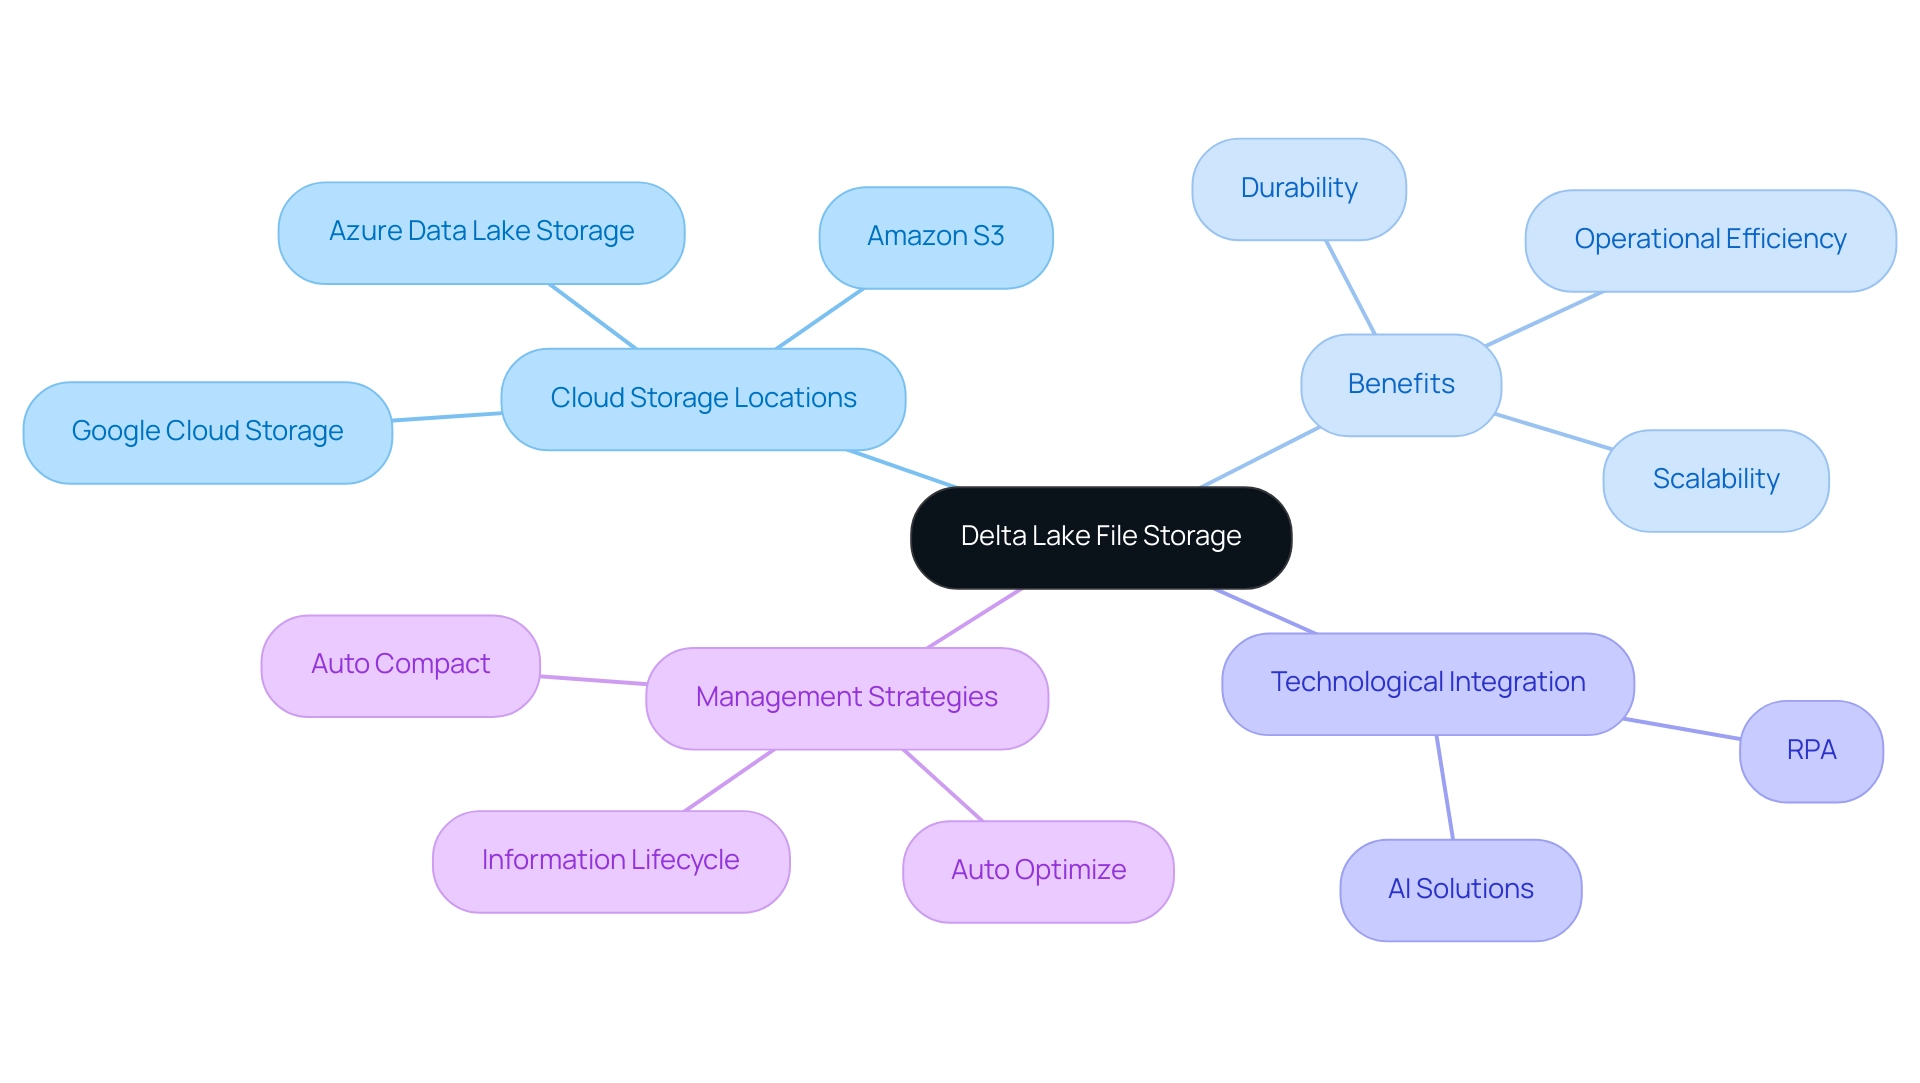
The delta lake location files are predominantly housed within advanced cloud storage systems like Amazon S3, Azure Data Lake Storage, and Google Cloud Storage. Utilizing cloud infrastructure not only ensures scalability and durability of information but also optimizes the management of large datasets. For instance, queries that process significant amounts of information (100 GB+) benefit from acceleration, highlighting the efficiency gains achievable with cloud storage.
In situations where a single table can exceed 400PB, entities can effectively manage the intricacies of their operations. Moreover, by integrating Robotic Process Automation (RPA) into these workflows, businesses can automate manual processes, significantly reducing errors and freeing up team resources for more strategic, value-adding work, further enhancing operational efficiency in the rapidly evolving AI landscape. The directory structure of the system enables efficient management and querying of datasets, highlighting the significance of comprehending the delta lake location for these storage areas.
This knowledge is pivotal for organizations, as it significantly influences information accessibility, compliance, and backup strategies. Furthermore, Delta Lake’s architecture empowers users to effectively manage their information lifecycle, ensuring secure storage and timely retrieval as needed. Significantly, features such as Auto Optimize and Auto Compact dynamically modify partition sizes and look for chances to compact files, enhancing overall management efficiency.
As ByteDance/TikTok highlights, ‘In our scenario, the performance challenges are huge. The maximum volume of a single table reaches 400PB+, the daily volume increase is at the PB level, and the total volume reaches the EB level. This emphasizes the essential role of strong information management strategies and RPA in promoting insight-driven knowledge and operational efficiency for business growth. Additionally, tailored AI solutions can complement RPA by providing targeted technologies that address specific operational challenges, enhancing overall efficiency.
As cloud storage utilization for the platform is expected to increase in 2024, the benefits of embracing these technologies become more evident—improving operational efficiency while tackling modern information management challenges.
Delta Lake and Apache Spark: A Powerful Combination
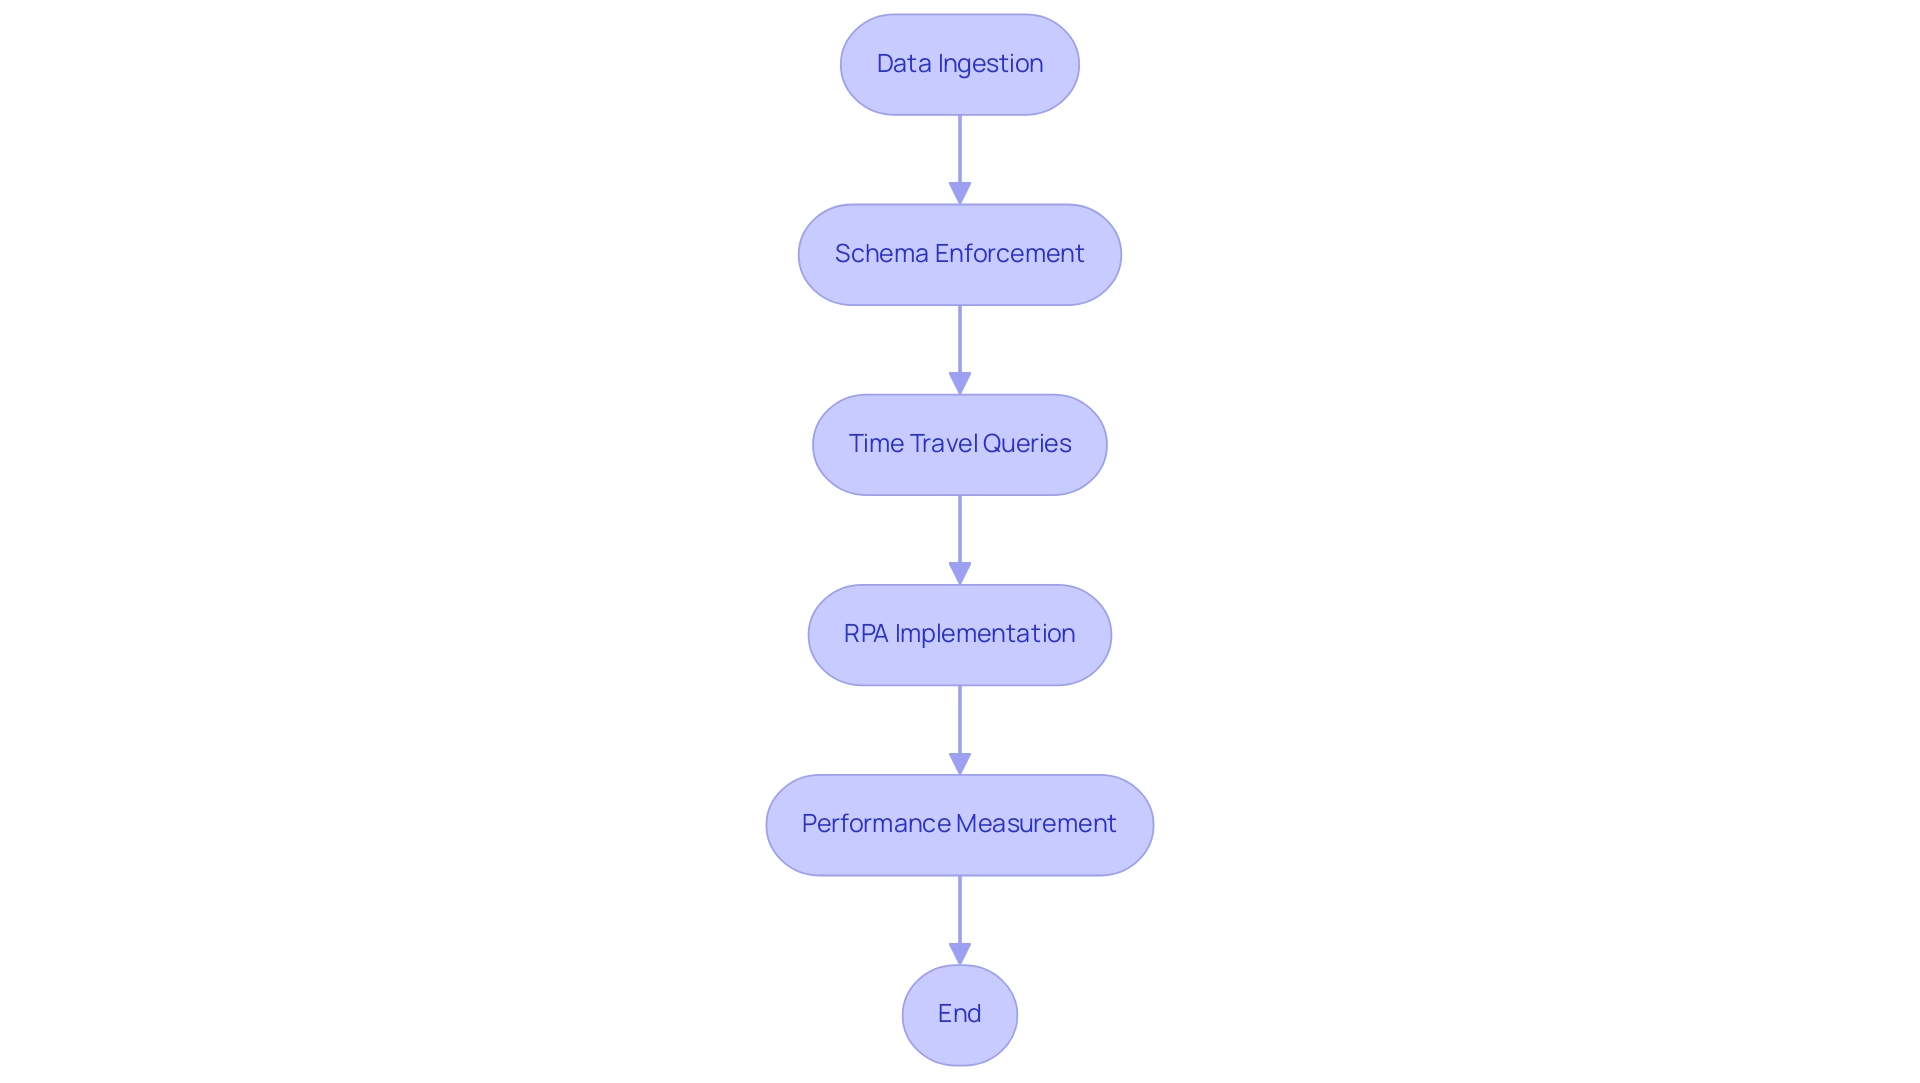
The platform is designed for smooth integration with Apache Spark, enabling organizations to carry out intricate workflows effectively. By utilizing Spark’s robust distributed computing capabilities, users can effectively manage vast datasets at the delta lake location. This partnership is underscored by features such as schema enforcement and time travel, which significantly enhance analytical capabilities.
The ability to query historical information states allows for deeper insights while maintaining integrity during operations, addressing common challenges in leveraging insights from Power BI dashboards, such as time-consuming report creation and inconsistencies. By implementing Robotic Process Automation (RPA), companies can automate these manual tasks, reducing errors and freeing up teams to focus on strategic initiatives. Notably, the trigger execution duration has been measured at 1887 ms, showcasing the performance capabilities of this integration.
With recent advancements like Auto Optimize and Auto Compaction, which are now default in Databricks Runtime 9.1 LTS and above, organizations can unlock the potential for real-time analytics and transformation processes. This is essential in a rapidly evolving AI landscape, where tailored solutions can help navigate complexities. As Alex Ott pointed out, ‘The previous ones lack this functionality, it exists only in DB version,’ emphasizing the benefits of the data structure.
Furthermore, the case study entitled ‘Stack vs Queue in Organization’ demonstrates practical applications and clarifies the differences between stack and queue structures, assisting in choosing the suitable structure for specific use cases. These improvements generate actionable business insights, making the combination of Apache Spark and RPA a strategic asset for operational efficiency and growth.
Key Features of Delta Lake: ACID Transactions and Time Travel
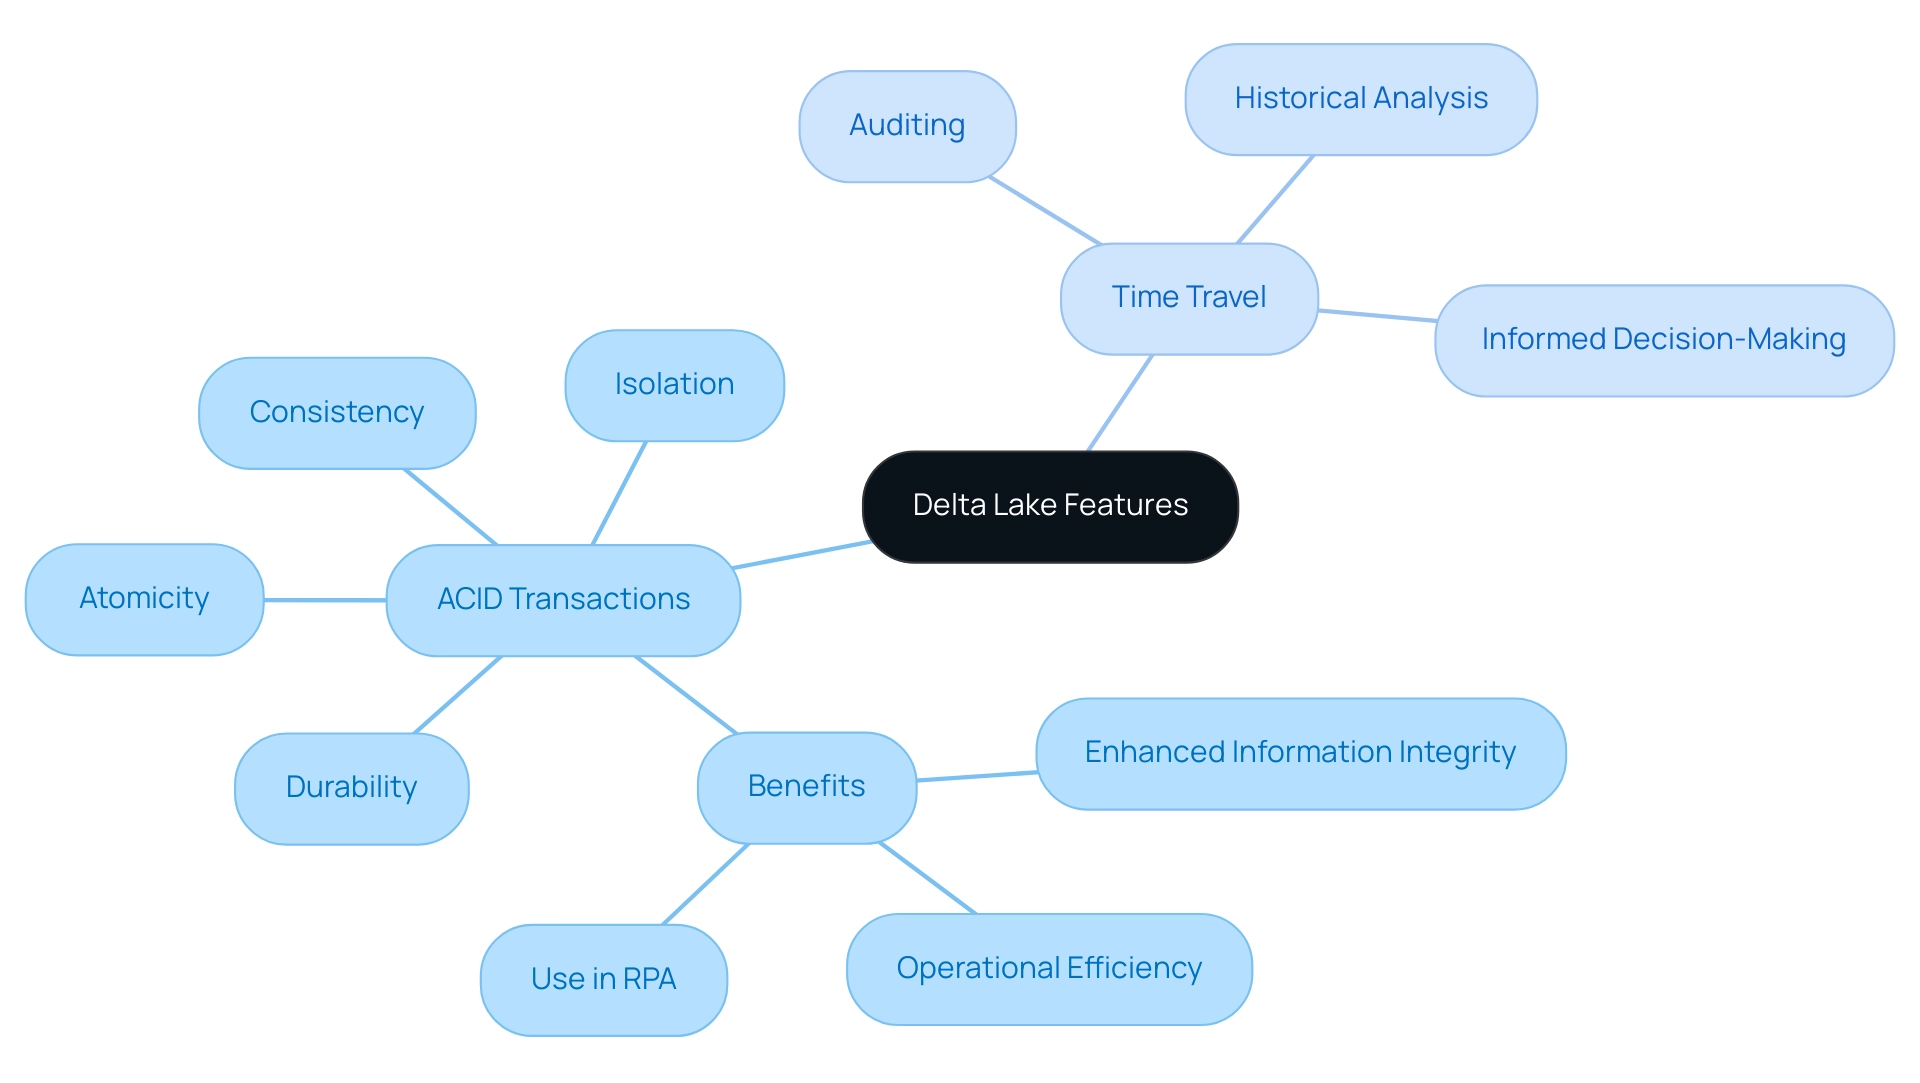
Delta Lake’s robust support for ACID transactions—Atomicity, Consistency, Isolation, and Durability—ensures that every operation is executed reliably, safeguarding integrity even amidst concurrent writes or system failures. This ability is essential for companies aiming for steadfast uniformity in their processes, especially in a time when utilizing Robotic Process Automation (RPA) can streamline manual workflows, minimize mistakes, and allow team members to focus on more strategic, value-enhancing tasks. Recent statistics indicate that 75% of organizations implementing ACID transactions have reported enhanced information integrity and operational efficiency in 2024.
According to industry expert Franco Patano,
ANALYZE is the best return on your compute investment, as it benefits all types of queries, without a lot of pre-planning on the DBA’s part.
Moreover, a case study on the Budibase platform demonstrates how Delta’s ACID transactions enabled smooth information operations, allowing teams to produce actionable insights effectively. Additionally, Delta Lake’s innovative time travel feature empowers users to access and query historical versions of their information, making it an invaluable tool for auditing and detailed historical analysis.
This functionality not only improves information quality but also enables informed decision-making based on precise, current details. By harnessing these advanced capabilities alongside tailored AI solutions, organizations can significantly enhance their governance practices and drive operational efficiencies, positioning themselves for sustained success in an increasingly information-driven landscape. The relevance of these features extends to emerging technologies like blockchain, emphasizing the critical importance of data integrity and management.
As businesses navigate the rapidly evolving AI landscape, tailored AI solutions can help identify the right technologies that align with specific business goals and challenges.
Conclusion
Delta Lake stands out as a pivotal solution for organizations striving to optimize their data management strategies. By enabling ACID transactions and facilitating the integration of streaming and batch data processing, it addresses the inherent challenges of traditional data lakes. The synergy between Delta Lake and Robotic Process Automation (RPA) not only automates repetitive tasks but also enhances operational efficiency, empowering teams to focus on strategic initiatives that drive growth.
The practical applications of Delta Lake, from seamless data reads and writes to its compatibility with cloud storage and Apache Spark, underscore its versatility in managing vast datasets. Features like schema enforcement and time travel further enhance data integrity and accessibility, ensuring organizations can derive actionable insights swiftly. As businesses increasingly demand real-time analytics, leveraging Delta Lake alongside RPA will be crucial for maintaining a competitive edge in a data-driven marketplace.
In conclusion, the transformative power of Delta Lake, coupled with RPA, positions organizations to navigate the complexities of modern data management effectively. By embracing these technologies, businesses can enhance their decision-making processes, improve data governance, and ultimately achieve greater operational efficiency. As the landscape continues to evolve, investing in robust data management frameworks will be key to unlocking future growth and innovation.
Introduction
In the world of data analytics, precision is paramount, and the DAX ISNUMBER function emerges as an essential tool for ensuring data integrity within Power BI. As organizations grapple with the complexities of data validation and reporting, mastering this function can significantly streamline processes and enhance the reliability of insights.
By distinguishing numeric values from non-numeric entries, ISNUMBER not only safeguards the accuracy of analyses but also empowers users to make informed decisions swiftly. This article delves into the intricacies of the ISNUMBER function, exploring its syntax, practical applications, and troubleshooting strategies, all aimed at equipping professionals with the knowledge to tackle common challenges in data management and reporting.
With a focus on actionable solutions, readers will discover how to leverage this powerful function to elevate their data analysis capabilities and drive operational efficiency in their organizations.
Introduction to the DAX ISNUMBER Function
The DAX function, known as dax isnumber, serves as a critical logical tool within Power BI, enabling users to assess whether a given value qualifies as a number. By returning TRUE for numeric values and FALSE for non-numeric entries, dax isnumber plays a vital role in validating types—a fundamental aspect of effective analysis. This validation ensures that subsequent calculations and analyses, especially those involving dax isnumber, are conducted on suitable information, significantly enhancing the accuracy and reliability of reports and dashboards.
In a knowledge-abundant setting, mastering such tasks is vital to tackling obstacles like lengthy report generation and information inconsistencies. For instance, by guaranteeing that only valid numeric information is processed using dax isnumber, the function can assist in simplifying report generation, cutting down the time spent on rectifying errors and discrepancies. To enhance consistency in the validation procedure, it is crucial to establish a standard collection of tests for every item type, which corresponds with the significance of numerical checks, such as dax isnumber, in ensuring information integrity.
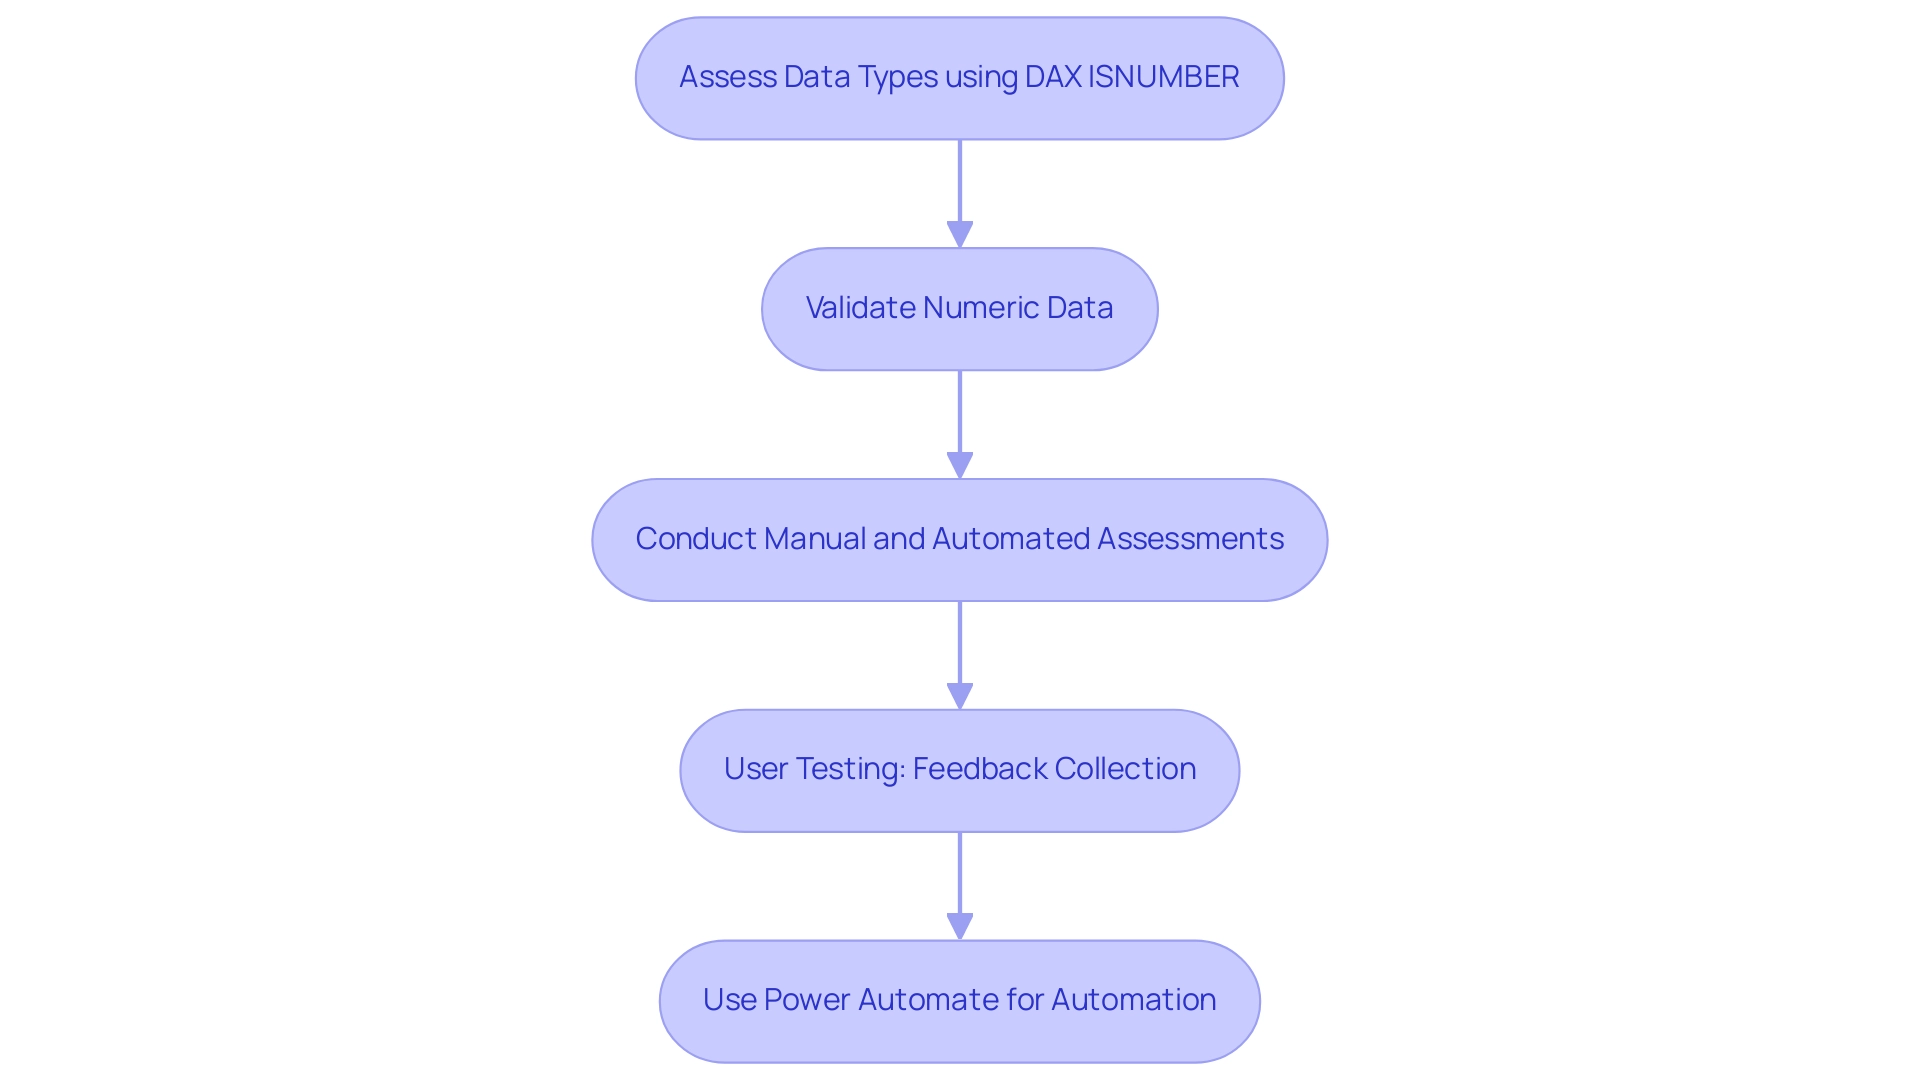
For example, in the case study named ‘User Validation of Content,’ after content undergoes manual and automated assessments, it advances to user testing where participants offer feedback on business requirements and performance. This process, which includes observatory testing, focus group testing, and user acceptance testing (UAT), highlights the necessity of thorough validation to ensure accuracy and reliability before deployment to production.
Furthermore, as noted by grazitti_sapna, ‘If you want to schedule or trigger the validation process: Use Power Automate to refresh datasets and email validation reports automatically.’ This quote emphasizes the practical application of automation in the validation process, showcasing how RPA can streamline workflows and enhance operational efficiency. By utilizing the numeric verification capability of dax isnumber alongside tools like Power Automate, you can enhance the accuracy of your data insights, fostering more informed decision-making within your organization.
In a rapidly evolving AI landscape, understanding and utilizing such capabilities becomes integral to unlocking the power of Business Intelligence and driving business growth and innovation.
Understanding the Syntax of ISNUMBER
The DAX ISNUMBER function serves as a powerful tool to evaluate whether a specified value is numeric, with straightforward syntax:
ISNUMBER(value)
In this syntax, value can encompass a column reference, a direct numeric input, or an expression yielding a value. The method returns TRUE if the value is numeric, as determined by DAX ISNUMBER, and FALSE otherwise. Mastering this syntax is essential for effectively utilizing the DAX ISNUMBER function within the numeric verification capability to address frequent issues in Power BI, such as time-consuming report creation and inconsistencies, while also offering actionable guidance to stakeholders.
It’s essential to note that not all DAX calculations are supported in earlier versions of Power BI Desktop, Analysis Services, and Power Pivot in Excel, making it critical to ensure the applicability of the numeric validation in your projects.
To maximize the utility of the function, consider best practices that improve accuracy and streamline calculations. For example, using a specific formula alongside other DAX tools can assist in filtering or conditionally formatting data sets, ensuring that only pertinent numeric entries are processed. Be cautious of common pitfalls, such as inadvertently passing non-numeric types, which can lead to errors when using DAX ISNUMBER in your expressions.
For practical insights, the case study titled “Power BI DAX Tutorial for Beginners” serves as an excellent resource, demonstrating how the numerical validation tool is taught and applied in real-world scenarios. This tutorial, which takes about 9 minutes to read, highlights the accessibility and significance of mastering DAX capabilities, including how DAX ISNUMBER can be used to check for numeric values, especially in addressing challenges related to report usability and actionable insights.
Moreover, implementing governance strategies can significantly mitigate inconsistencies, ensuring that your reports are reliable and trustworthy. Looking ahead, updates to the numeric check syntax in 2024 may introduce enhancements that further refine its capabilities. Staying informed about these changes is vital to maintaining the relevance and efficiency of your DAX applications.
As Richie Cotton aptly states, he ‘spends all day engaging in conversation about statistics,’ emphasizing the importance of comprehending operations within the larger framework of analysis. By embracing these best practices and remaining vigilant about syntax updates, you can ensure your Power BI projects are both effective and accurate, ultimately leveraging insights more efficiently.
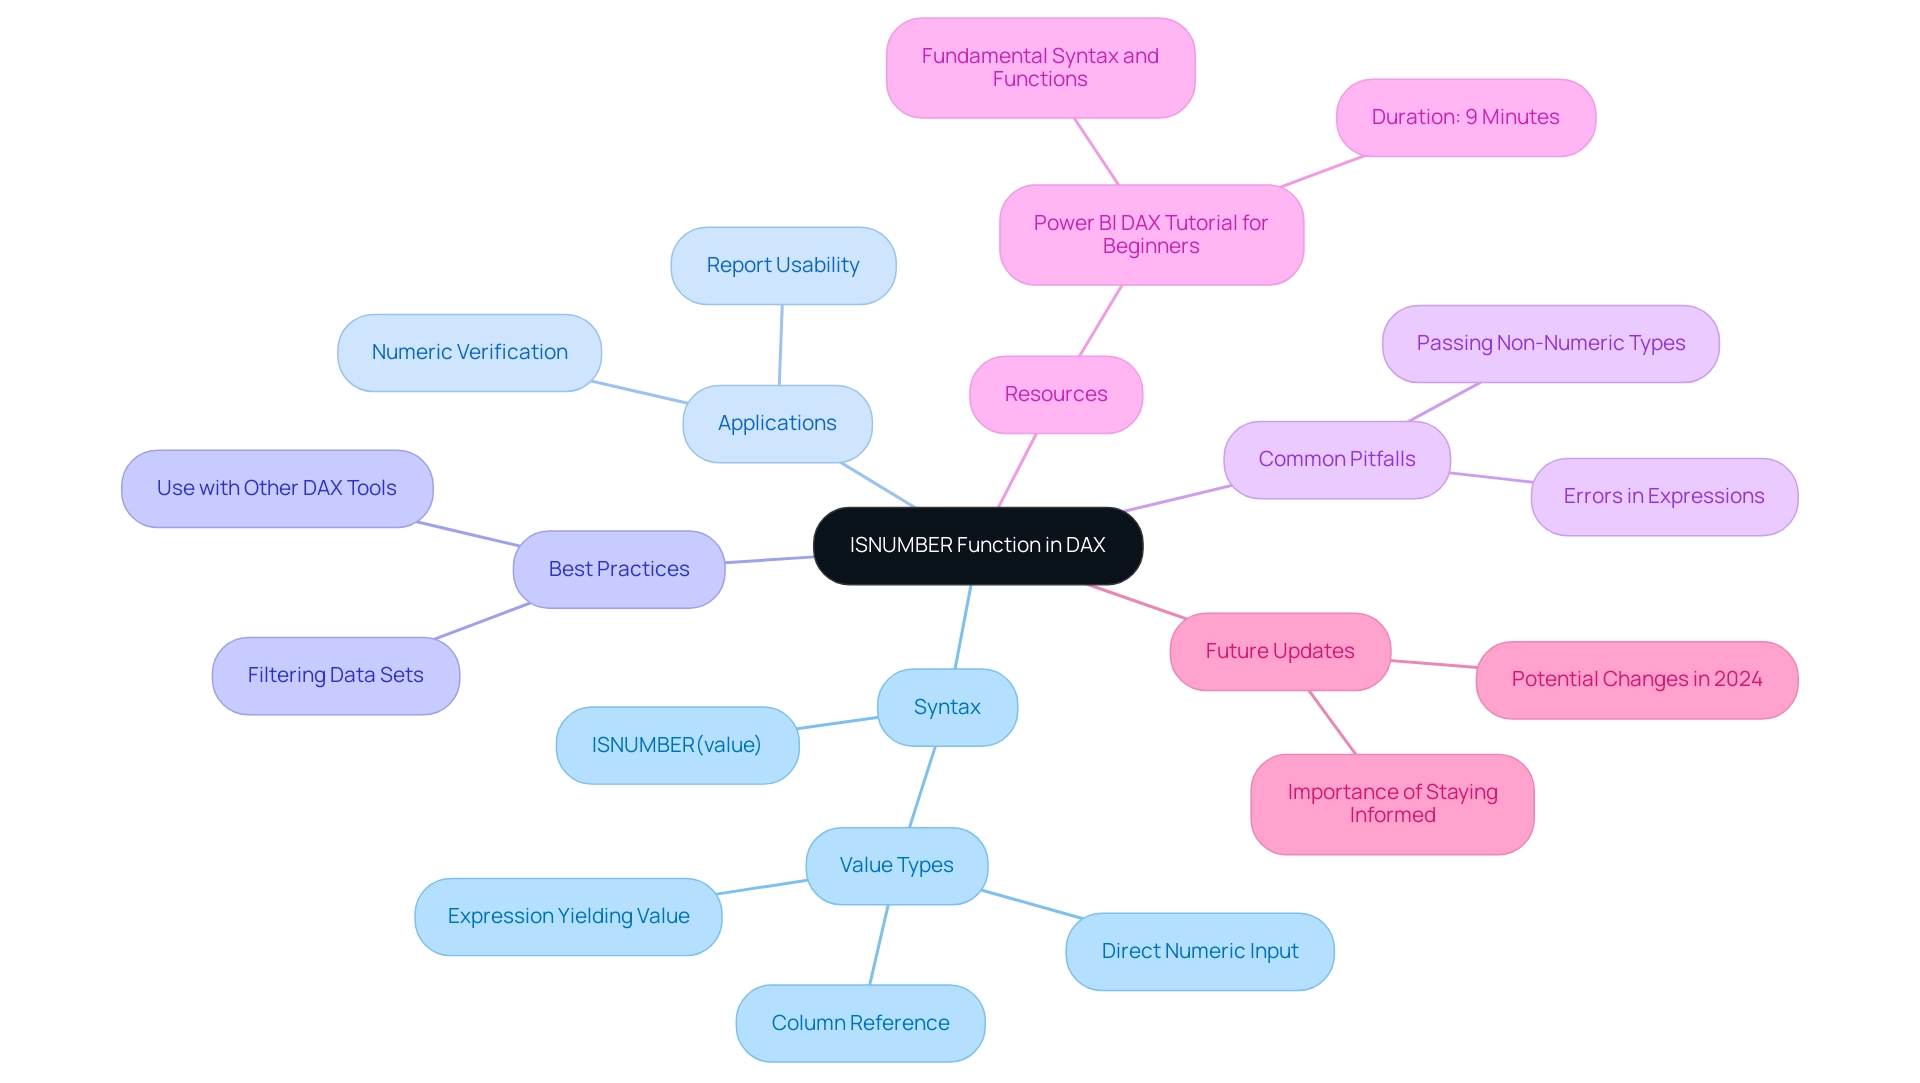
Practical Examples of ISNUMBER in Power BI
Employing the ISNUMERIC formula in Power BI can greatly improve your information validation procedures, similar to the adaptable SUMPRODUCT formula in Excel, which enables flexible information aggregations. In a setting where numerous organizations face challenges with lengthy report generation and information inconsistencies, utilizing DAX tools such as ISNUMBER becomes crucial to enhance operational efficiency and enable informed decisions. Here are some practical examples that illustrate its versatility:
- Basic Usage: To determine whether a value in the ‘SalesAmount’ column is numeric, you can implement the following DAX formula:
DAX

   ISNUMBER(Sales[SalesAmount])
This function will return TRUE for valid numeric sales amounts and FALSE for any non-numeric entries, ensuring that your analysis is based on accurate data and reducing the confusion often seen in inconsistent reports.
- Conditional Column: If you want to create a new column that classifies the validity of each sales amount, use this formula:
DAX

   Sales[IsValidSales] = IF(ISNUMBER(Sales[SalesAmount]), "Valid", "Invalid")
This approach tags each entry as ‘Valid’ or ‘Invalid’, allowing you to quickly assess which sales amounts are usable for reporting and analysis, ultimately providing clearer guidance to stakeholders and enhancing decision-making processes.
- Filtering Information: The numerical identifier can also be essential in sifting through information within measures. For instance, to calculate the total of only valid numeric sales amounts, apply the following DAX code:
DAX

   TotalValidSales = CALCULATE(SUM(Sales[SalesAmount]), ISNUMBER(Sales[SalesAmount]))
This measure effectively sums only those entries that are numeric, excluding any non-numeric values from your total, thereby enhancing the accuracy of your sales analysis and addressing the challenge of producing actionable insights from your data.
As Mynda wisely noted, sharing a sample file with anticipated results can greatly clarify the practical implications of these operations. For instance, in the case study ‘Power BI MCQ Poll Questions – Part 3,’ participants employed the numerical verification tool to validate responses, showcasing its practical use in real-life situations. Comprehending how to utilize the function not only confirms sales figures but also enhances the overall quality of your analysis, resulting in more dependable insights, increased transparency, and informed strategic choices.

Common Use Cases for the ISNUMBER Function
The dax isnumber function acts as a strong partner in numerous situations, especially in the areas of analysis and reporting, which are essential for navigating the overwhelming AI landscape and improving business intelligence. Here are some key applications:
-
Data Cleaning: This function is essential for identifying and filtering out non-numeric values within datasets. Ensuring information quality before analysis helps organizations avoid the pitfalls of inaccurate insights derived from flawed information. For example, utilizing the formula
=SUMPRODUCT(--(A2:A5))>0can swiftly determine if a range includes any numeric values, leading to cleaner datasets and tackling issues of inadequate master information quality. -
Conditional Logic: DAX ISNUMBER can be effectively utilized within IF statements, allowing you to control the flow of calculations based on numeric validation. This capability enhances decision-making processes by ensuring that only valid information influences outcomes, thereby supporting operational efficiency.
-
Information Validation: In the context of business intelligence, ensuring that key metrics are grounded in valid numeric information is crucial for accurate reporting. The function serves as a gatekeeper, verifying information inputs and enhancing the reliability of analytical outcomes. Significantly, the tool is relied upon by more than 50,000 companies and has over 500,000 satisfied users, highlighting its effectiveness in improving information integrity and promoting insight-driven decisions.
-
Creating Dynamic Reports: By utilizing a numeric check for conditional formatting, users can dynamically showcase or format information based on the presence of numeric values. This not only enhances the visual appeal of reports but also improves user experience by making critical information easily identifiable, further driving growth and innovation.
-
Integration with Tailored AI Solutions: The function plays a vital role in customized AI solutions by ensuring that information fed into AI algorithms is accurate and reliable. This is particularly important in an era where businesses face overwhelming choices in AI technologies. By using dax isnumber to validate information, organizations can confidently leverage AI tools that require high-quality input for effective outputs, thereby enhancing their decision-making capabilities.
As highlighted by Hannah Recker, a Growth Marketer with an extensive background in analytics, “This fascination drove her to taking a deep dive into the analytics industry over the past 4 years in her work at StreamSets and Coefficient.” Her insights emphasize the significance of mastering such tasks in today’s data-driven environment. Furthermore, the case study named ‘Practical Applications of the Function’ demonstrates its crucial role in verifying information, error checking, and improving worksheet functionality.
For instance, a prominent retail firm utilized a function to optimize their inventory management system, significantly minimizing mistakes in stock information and enhancing overall operational efficiency. This demonstrates that mastering the function can significantly simplify the Excel experience and improve analytical precision for various users, from analysts to educators.
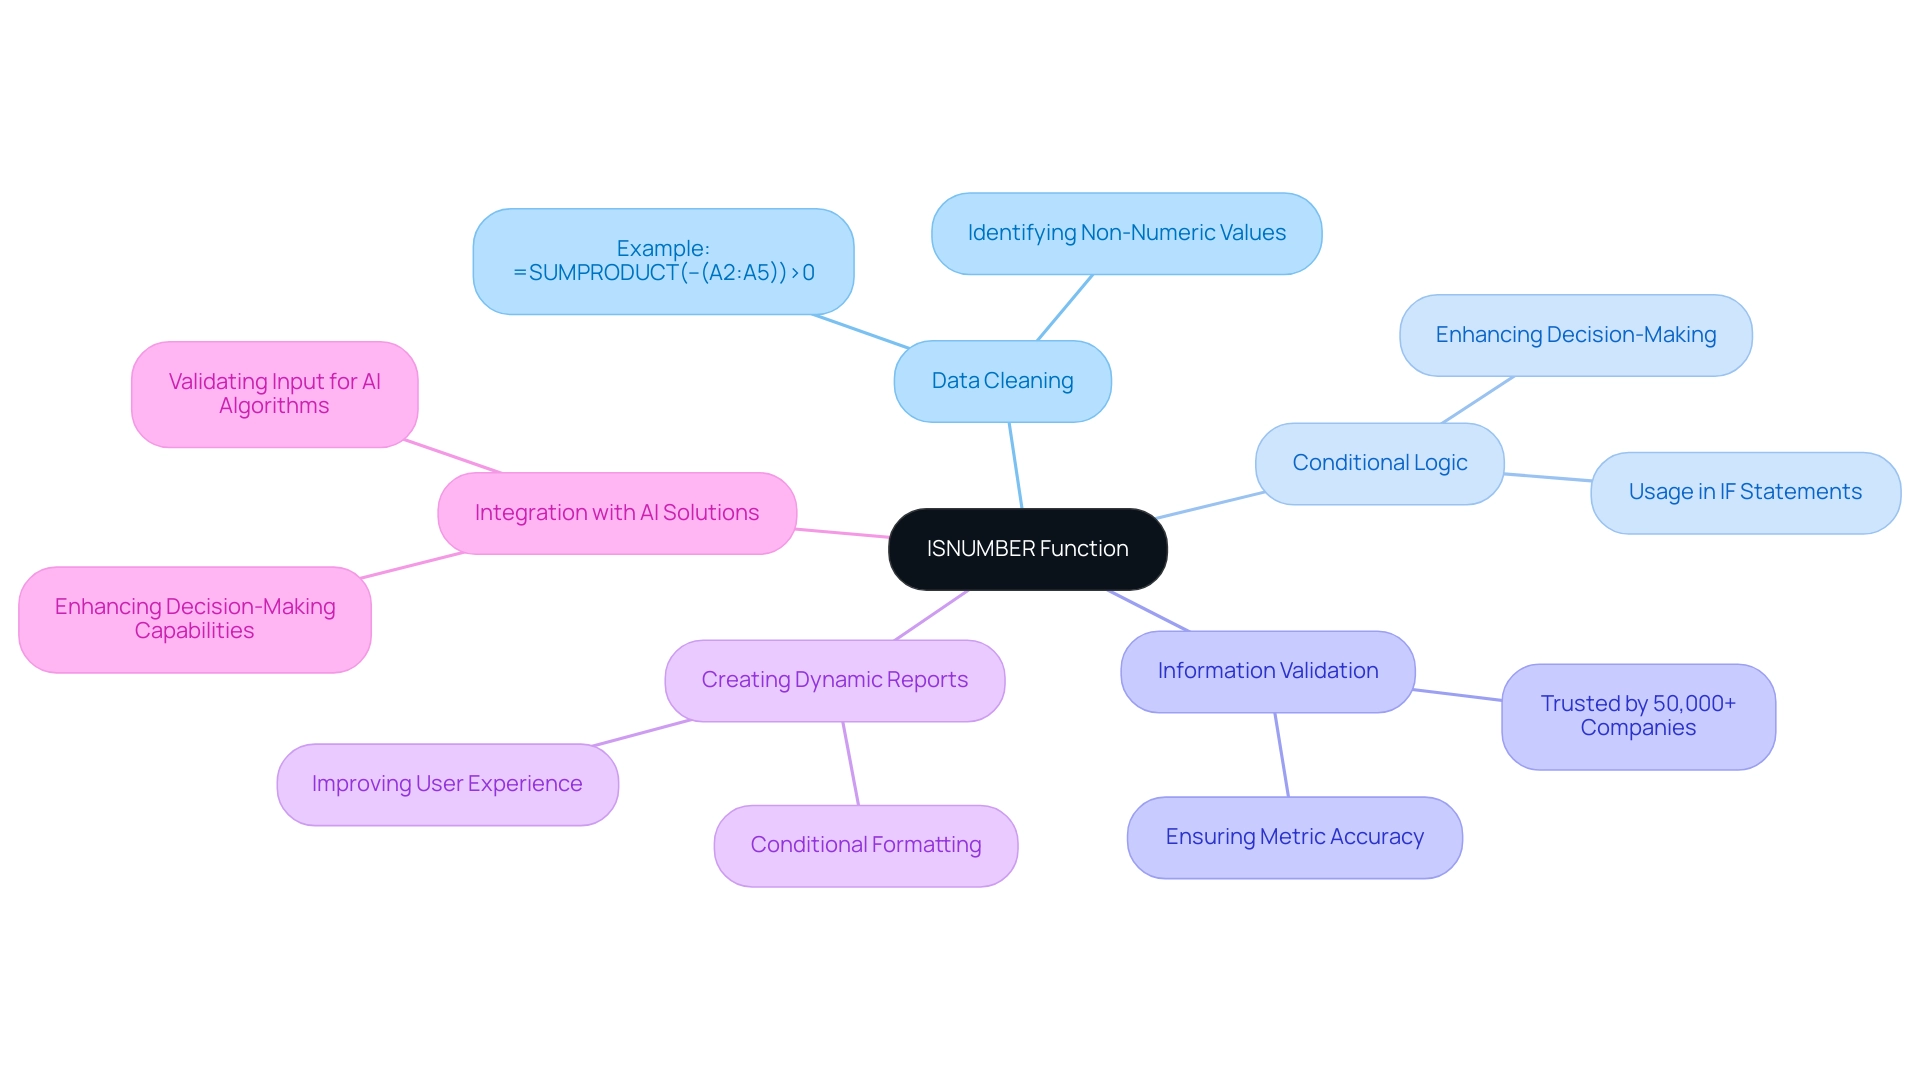
Troubleshooting ISNUMBER: Common Errors and Solutions
When employing the dax isnumber formula in DAX, users may face several typical obstacles that can impede their analysis efforts. Here are some prevalent issues and strategies for resolution:
-
Error: Value not found: If the function returns an error, verify that the value being tested is accurately referenced and exists within your dataset. Ensuring accurate information referencing is crucial for effective DAX function performance.
-
Unexpected FALSE results: If the function unexpectedly returns FALSE for values anticipated to be numeric, it is essential to inspect the data types by utilizing dax isnumber. In many situations, numbers may be stored as text, which the dax isnumber function cannot recognize as numeric. Converting these text entries to numeric format can resolve this issue.
-
Performance Issues: Using the function with large datasets may lead to performance slowdowns. This issue is especially pertinent in the context of managing relationships in information models; bi-directional and many-to-many relationships can degrade performance due to increased complexity in query resolution. Defaulting to Many-to-One and Single Direction relationships can simplify the model and enhance performance, making it easier to utilize DAX functions like dax isnumber effectively. In such instances, consider optimizing your DAX expressions or implementing calculated columns instead of measures where feasible. This approach can significantly enhance performance, particularly in complex information models.
To successfully tackle these challenges, it’s crucial to verify your types and references. By leveraging Robotic Process Automation (RPA), you can eliminate manual entry errors and streamline your workflows, allowing your team to focus on strategic analysis rather than repetitive tasks. Additionally, utilizing tailored AI solutions can help cut through the noise, ensuring that your information is actionable and aligned with your business goals.
Business Intelligence tools play a crucial role in this process, as they assist in cleaning and transforming information, making it ready for analysis. As noted by Mohan Raju, a results-driven business analyst, “this guidance can be immensely helpful in bridging information gaps and optimizing analytical processes,” especially when addressing the significance of validating types. Furthermore, the impact of manual, repetitive tasks on operational efficiency cannot be overlooked; RPA helps in automating these tasks, thereby enhancing productivity.
Leveraging Power Bi’s data transformation tools can also aid in cleaning and preparing your data before applying DAX functions, leading to improved performance and user experience. This guide was last updated on July 27, 2023, ensuring the relevance of the information provided.
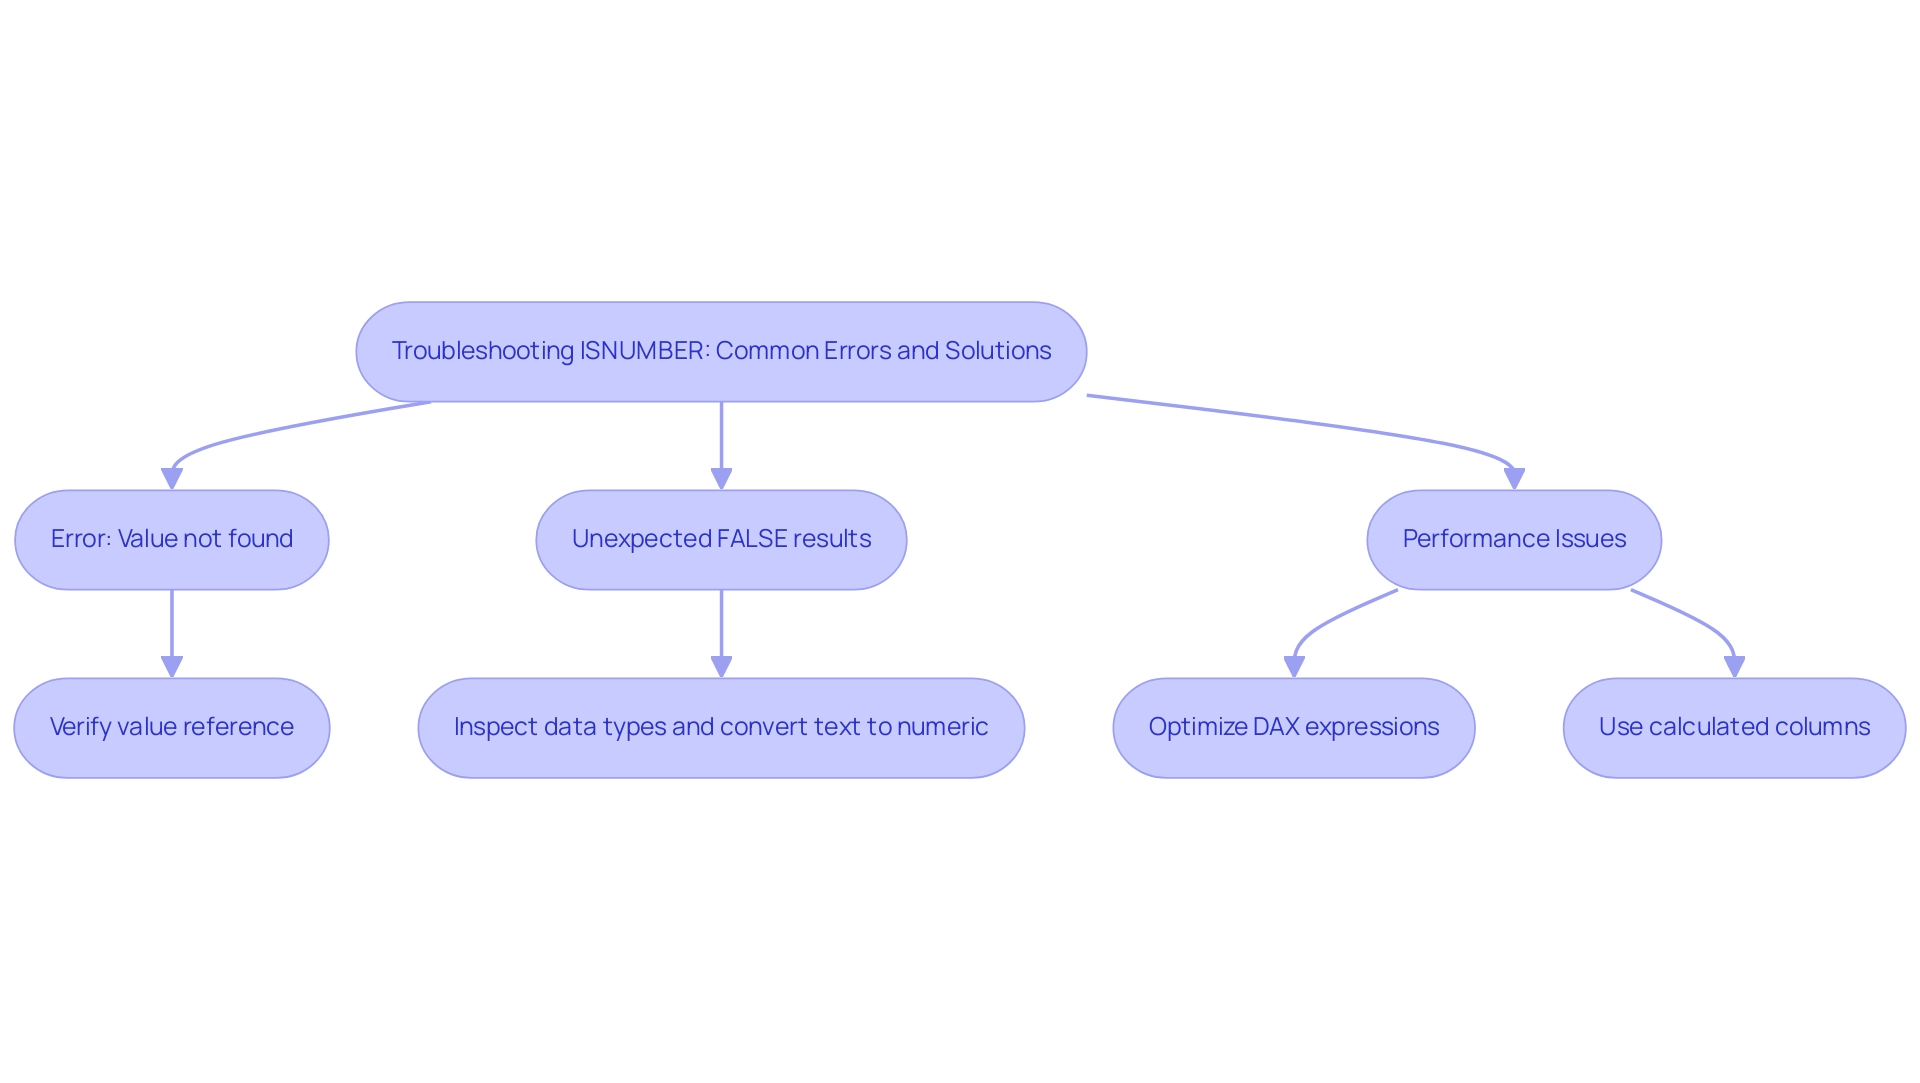
Conclusion
Mastering the DAX ISNUMBER function is essential for ensuring data integrity and enhancing the accuracy of analyses within Power BI. By effectively distinguishing numeric values from non-numeric entries, ISNUMBER serves as a critical component in data validation, enabling organizations to streamline report generation and make informed decisions. The practical applications discussed—from basic usage to conditional logic and dynamic reporting—demonstrate how this function can significantly improve data quality and operational efficiency.
Moreover, understanding the common challenges associated with ISNUMBER, such as troubleshooting errors and optimizing performance, empowers users to overcome obstacles that may hinder their data analysis efforts. By implementing best practices and leveraging automation tools like Power Automate, organizations can enhance their workflows and foster a data-driven culture.
Ultimately, the ISNUMBER function is more than just a tool; it is a gateway to unlocking the full potential of data analytics. By prioritizing precision in data management, professionals can ensure that their insights are not only reliable but also actionable, paving the way for strategic growth and innovation in an increasingly complex business landscape. Embracing this knowledge equips organizations to navigate the challenges of data-driven decision-making with confidence and clarity.
Introduction
In the realm of data analysis, the ability to derive meaningful insights from complex datasets is paramount, especially in fast-paced environments where informed decision-making can drive success.
The DAX ISONORAFTER function emerges as a powerful ally for analysts using Microsoft Power BI, enabling them to evaluate whether specific values occur after a defined reference point within the same column. This function not only facilitates time-based and sequential analysis but also enhances the overall efficiency of data manipulation.
By mastering ISONORAFTER, professionals can unlock the potential to identify trends, assess performance, and streamline reporting processes, all while integrating advanced tools like Robotic Process Automation (RPA) to further optimize workflows.
As organizations strive to harness the full power of their data, understanding and implementing such functions becomes crucial for maintaining a competitive edge in today’s data-driven landscape.
Introduction to the DAX ISONORAFTER Function
The dax isonorafter feature is an essential resource for conducting analysis within Microsoft Power BI and similar applications that utilize DAX. This operation assesses whether the values in a specified column take place after a defined value within the same column. Its utility shines in scenarios requiring time-based or sequential analysis, as dax isonorafter enables analysts to filter and manipulate information in a manner that respects chronological conditions.
For example, when evaluating sales performance over time, the DAX ISONORAFTER tool allows users to identify trends and anomalies based on defined time intervals. According to recent statistics, DAX operations are utilized in over 70% of analytical tasks within Power BI, highlighting their significance in enhancing modeling capabilities and driving informed decision-making. Furthermore, the integration of Business Intelligence tools, such as Power BI with RPA solutions like EMMA RPA and Power Automate, tackles challenges encountered in report creation and inconsistencies, ensuring that insights are actionable and timely.
As Yana Khare observes, ‘Integration and Collaboration: Power BI is compatible with Microsoft Excel, Azure, and SharePoint tools,’ which emphasizes the role of this capability in a wider analytical framework. Additionally, a case study named ‘Understanding Data Models and Analysis Services’ illustrates how effective utilization of this method can aid cross-table analysis and enhance performance, enabling efficient sharing of insights. Mastering this capability not only enhances information modeling abilities but also empowers users to derive actionable insights that promote informed decision-making, ultimately fostering business growth in today’s competitive environment.
Failing to leverage such insights can leave businesses at a significant competitive disadvantage, underscoring the critical role of tools like EMMA RPA and Power Automate in optimizing operational efficiency.
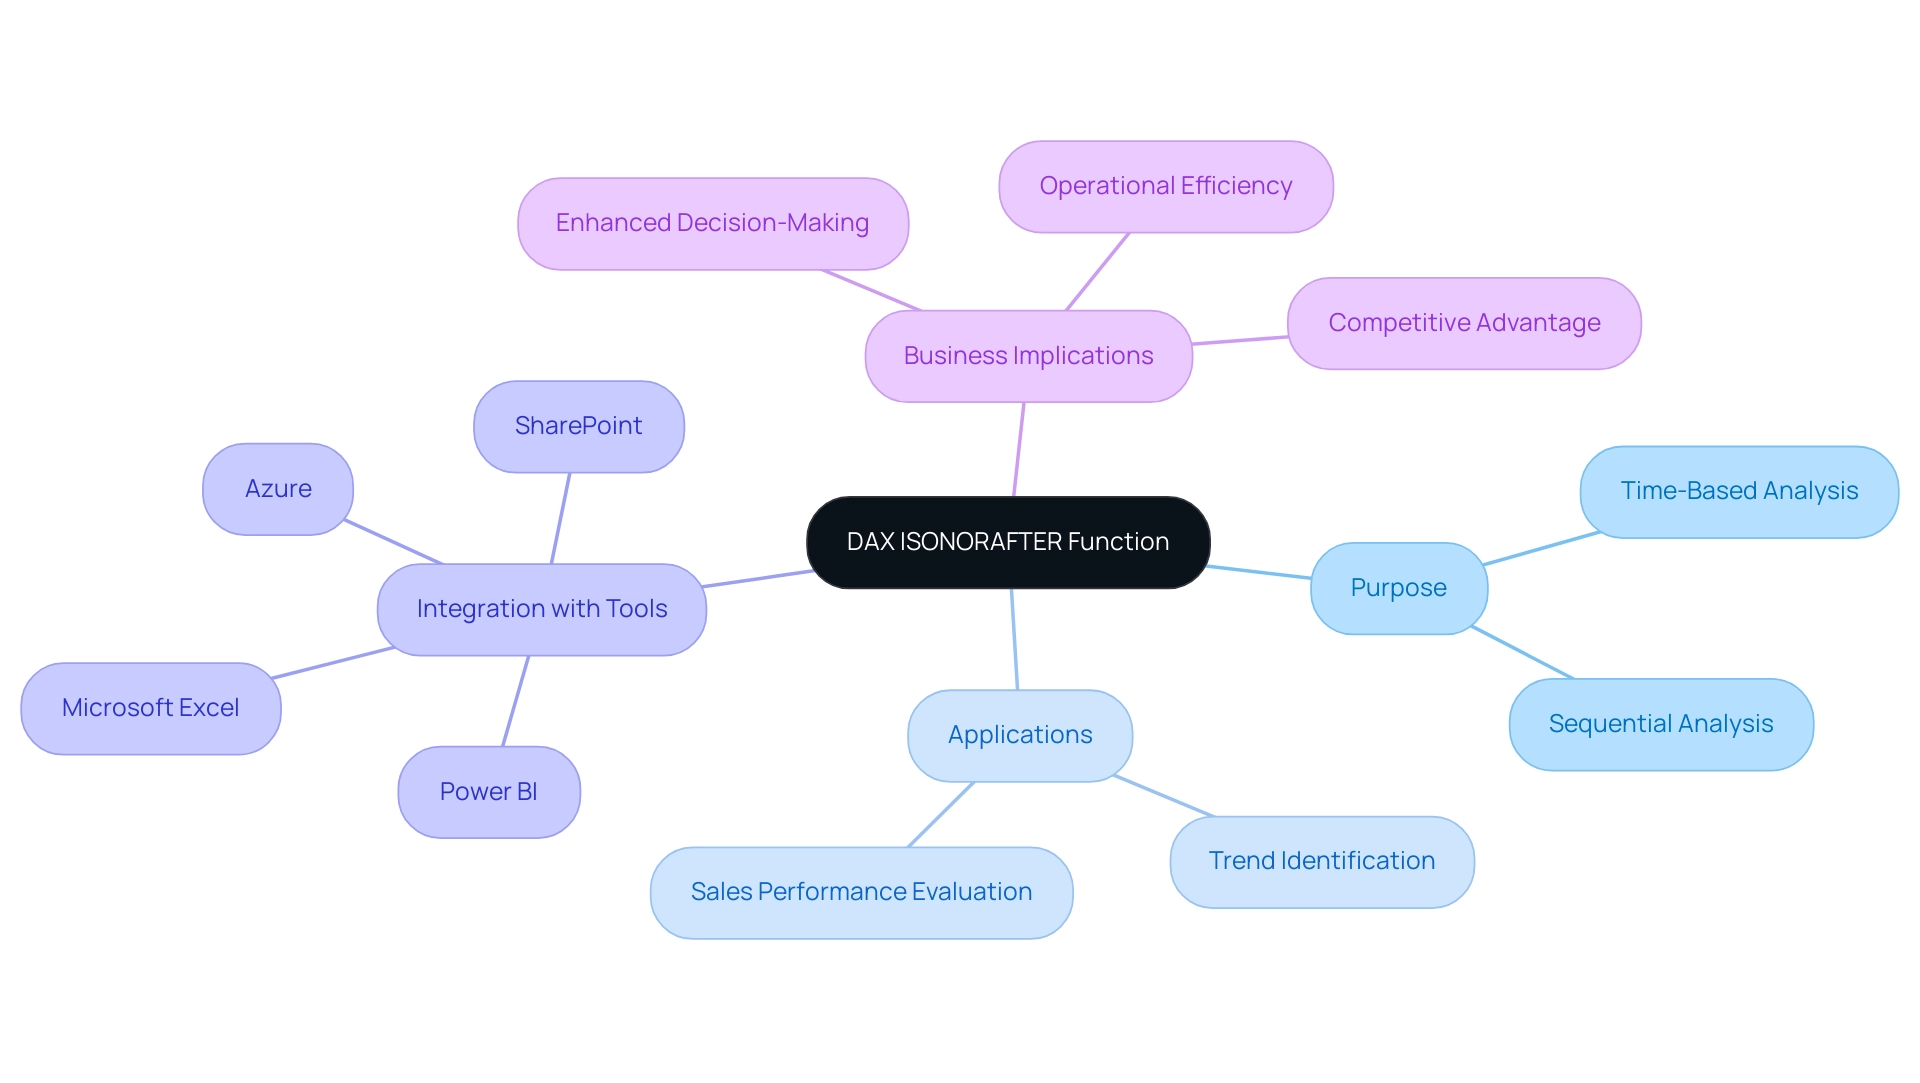
How to Use the ISONORAFTER Function: Syntax and Examples
The function represents a powerful tool in DAX, enabling users to assess information against a specific reference point—essential for improving insight-driven decisions in the realm of Business Intelligence. The syntax is organized as follows: Function Name(columnName, value, [alternateResult]), where ‘columnName’ indicates the column under evaluation, ‘value’ serves as the reference for comparison, and ‘alternateResult’ is an optional parameter that designates a return value if a match is absent.
A significant element of utilizing the FILTER expression is its integration, which permits defined sorting criteria—an essential characteristic when addressing the challenges of time-consuming report creation and inconsistencies in Power BI dashboards. This combination can significantly enhance data analysis by filtering datasets based on dynamic conditions, ultimately driving operational efficiency and informed decision-making.
Example 1: Consider a sales table featuring a ‘SalesDate’ column. You can utilize the function to determine whether a specific sale occurred after the dax isonorafter date. For instance, the formula:
DAX

SalesAfterDate = ISONORAFTER(Sales[SalesDate], DATE(2022, 1, 1))
This will yield TRUE for all sales that transpired following January 1, 2022.
Example 2: In a more intricate scenario, you may wish to return a specific message when the condition isn’t satisfied:
DAX

SalesMessage = IF(ISONORAFTER(Sales[SalesDate], DATE(2022, 1, 1)), "Sale after target date", "Sale before target date")
This approach facilitates more nuanced reporting within dashboards, addressing the lack of actionable guidance by providing clear, contextual insights into sales data.
Furthermore, in a practical application, this tool can be utilized in a table named Info to filter results based on specific country and state values, demonstrating its versatility in business analytics and its importance in overcoming operational challenges. Additionally, integrating RPA solutions can further streamline processes, reducing repetitive tasks and enhancing overall efficiency. As emphasized by DAX specialist Marco Russo, the progress in DAX capabilities, with the latest SSDT version updated from v14.0.1.432 to v16.0.70.21, enable users to apply such efficient solutions effectively.
In today’s competitive environment, not utilizing BI tools such as this one could leave your business at a disadvantage, underscoring the need for effective data-driven strategies.
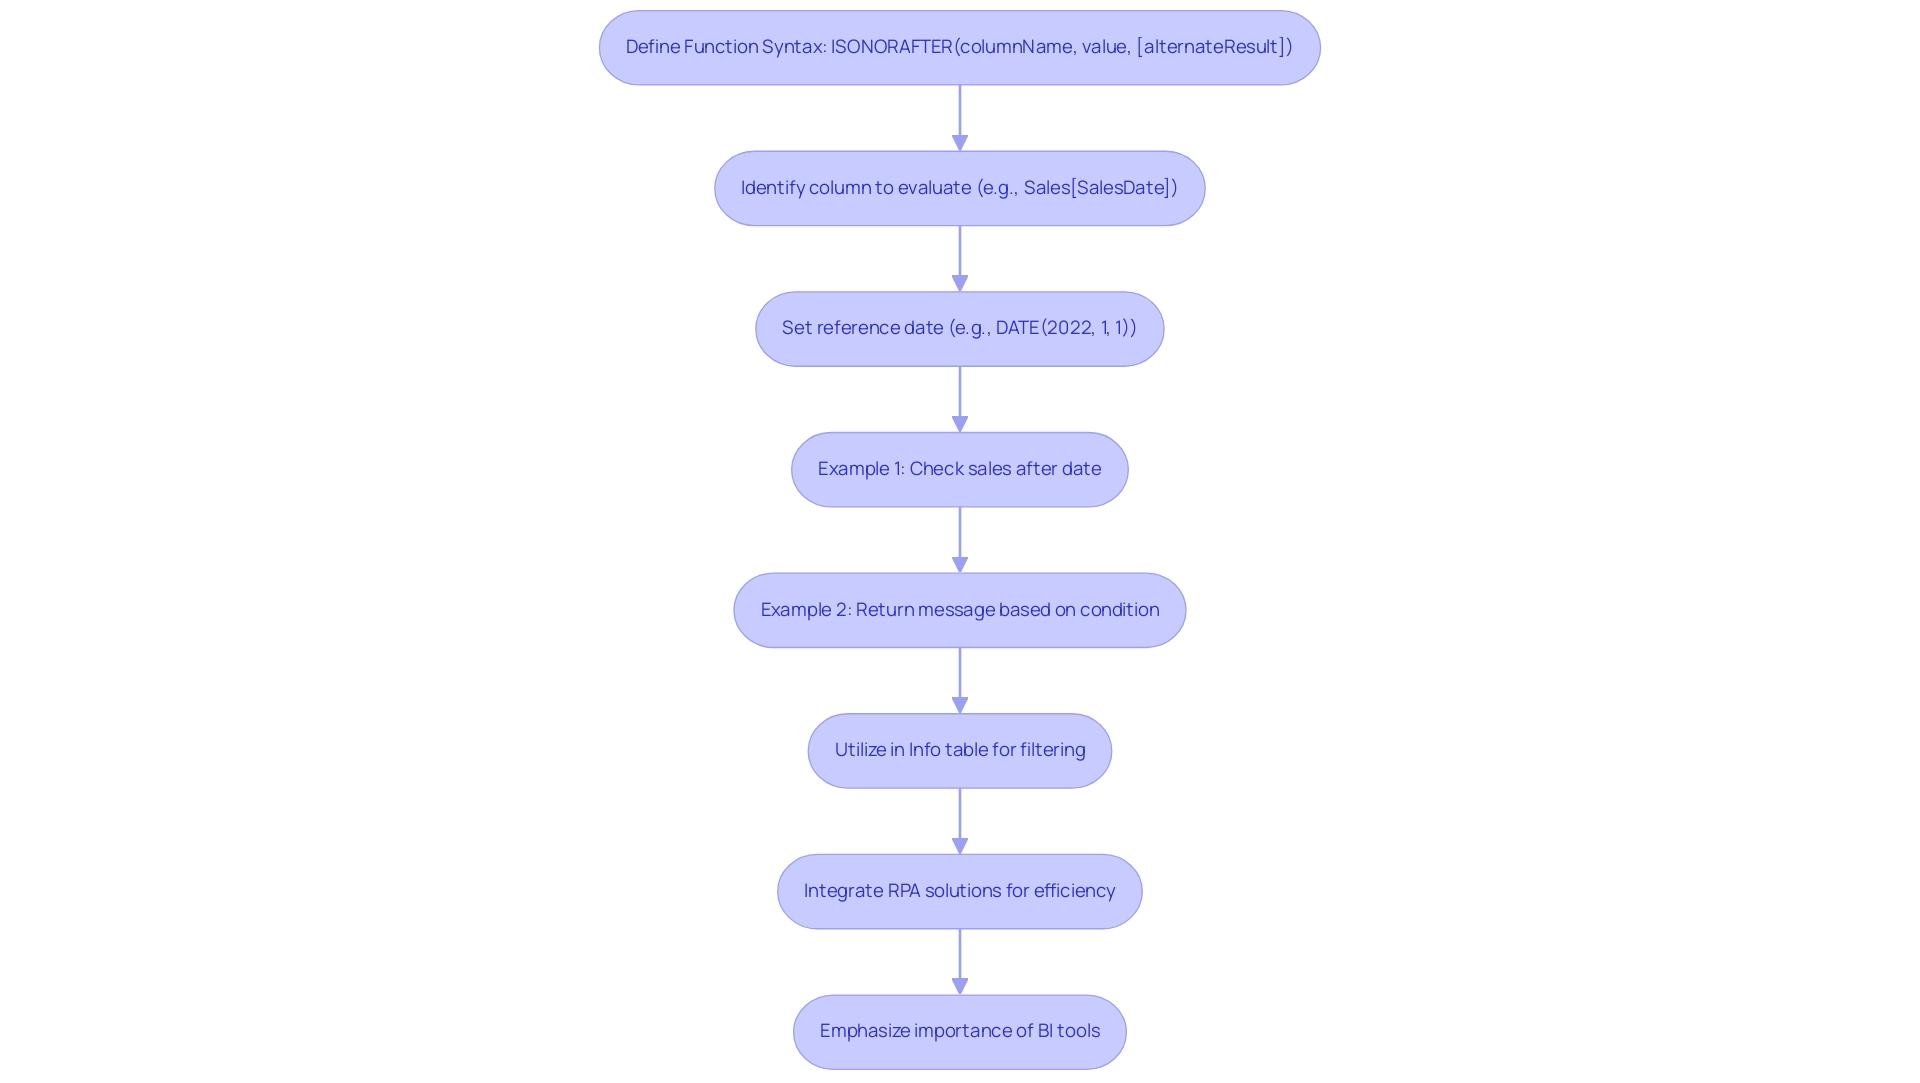
Common Use Cases for the ISONORAFTER Function
The ISONORAFTER function serves as a powerful tool across multiple scenarios, demonstrating its effectiveness in enhancing data analysis capabilities while complementing the advantages of Robotic Process Automation (RPA) in streamlining workflows:
-
Sales Analysis: Analysts can utilize
dax isonorafterto identify sales transactions that took place after a specific promotional event, allowing for the evaluation of the effectiveness of marketing strategies. Coupled with RPA, this insight can be automated, significantly reducing the time spent on manual information collection and analysis, thus improving operational efficiency. However, it is crucial to implement RPA properly to avoid potential data inconsistencies that can arise from improper data handling. -
Project Management: In the realm of project tracking, this function assists in identifying tasks that are
dax isonoraftertheir designated deadlines. By integrating RPA, teams can automatically generate reports on project timelines, enhancing accountability and enabling timely interventions when deadlines are missed. RPA can also help address the challenge of time-consuming report creation by automating the report generation process. -
Financial Reporting: Financial analysts utilize
dax isonorafterto assess transactions that occurred after specific dates, a practice essential for accurate reporting periods. RPA can automate the reporting process, ensuring compliance with regulations and reducing the risk of human error. This automation is especially advantageous in settings where accuracy is critical. -
Customer Behavior Insights: By analyzing customer purchases made after targeted marketing campaigns, businesses can gain critical insights into customer responses, particularly focusing on how
dax isonorafterthese interactions. RPA can facilitate the collection and analysis of this data, enabling quicker adjustments to marketing strategies based on real-time insights. This agility can significantly enhance business adaptability in competitive markets. -
Case Study on Cumulative Totals: A notable application of the system is illustrated in the case study titled “Calculating Cumulative Totals on Non-Numeric Fields,” which explores challenges in calculating cumulative totals on non-numeric fields. The use of an alternative function alongside operations like
RANKXdemonstrates how cumulative totals can be effectively calculated based on sub-category IDs, showcasing the function’s versatility in complex scenarios. RPA can further enhance this process by automating data entry and calculation tasks, thereby minimizing the potential for human error in these processes. -
Expert Insights: Marcelo Skovronsky, a Data Science expert, highlights a common challenge when using ISONORAFTER: “Thanks for sharing your ideas. How would you deal with ties? I have implemented a slight variation of your last suggestion, with a tie-break, but the performance is very poor.” This quote highlights the significance of considering potential ties when utilizing the
dax isonorafteroperation, which can affect cumulative sums. RPA can help mitigate performance issues by automating the tie-breaking logic and ensuring efficient data processing.
It is also essential to note that the ISONORA feature is unstable, meaning it may produce varying results each time it is called with the same arguments. Understanding this characteristic is crucial for ensuring accurate analysis and operational efficiency. By utilizing RPA in conjunction with the corresponding capability, organizations can promote informed decision-making and improve analytical accuracy in diverse operational scenarios, while being aware of the necessity for proper implementation to prevent pitfalls.
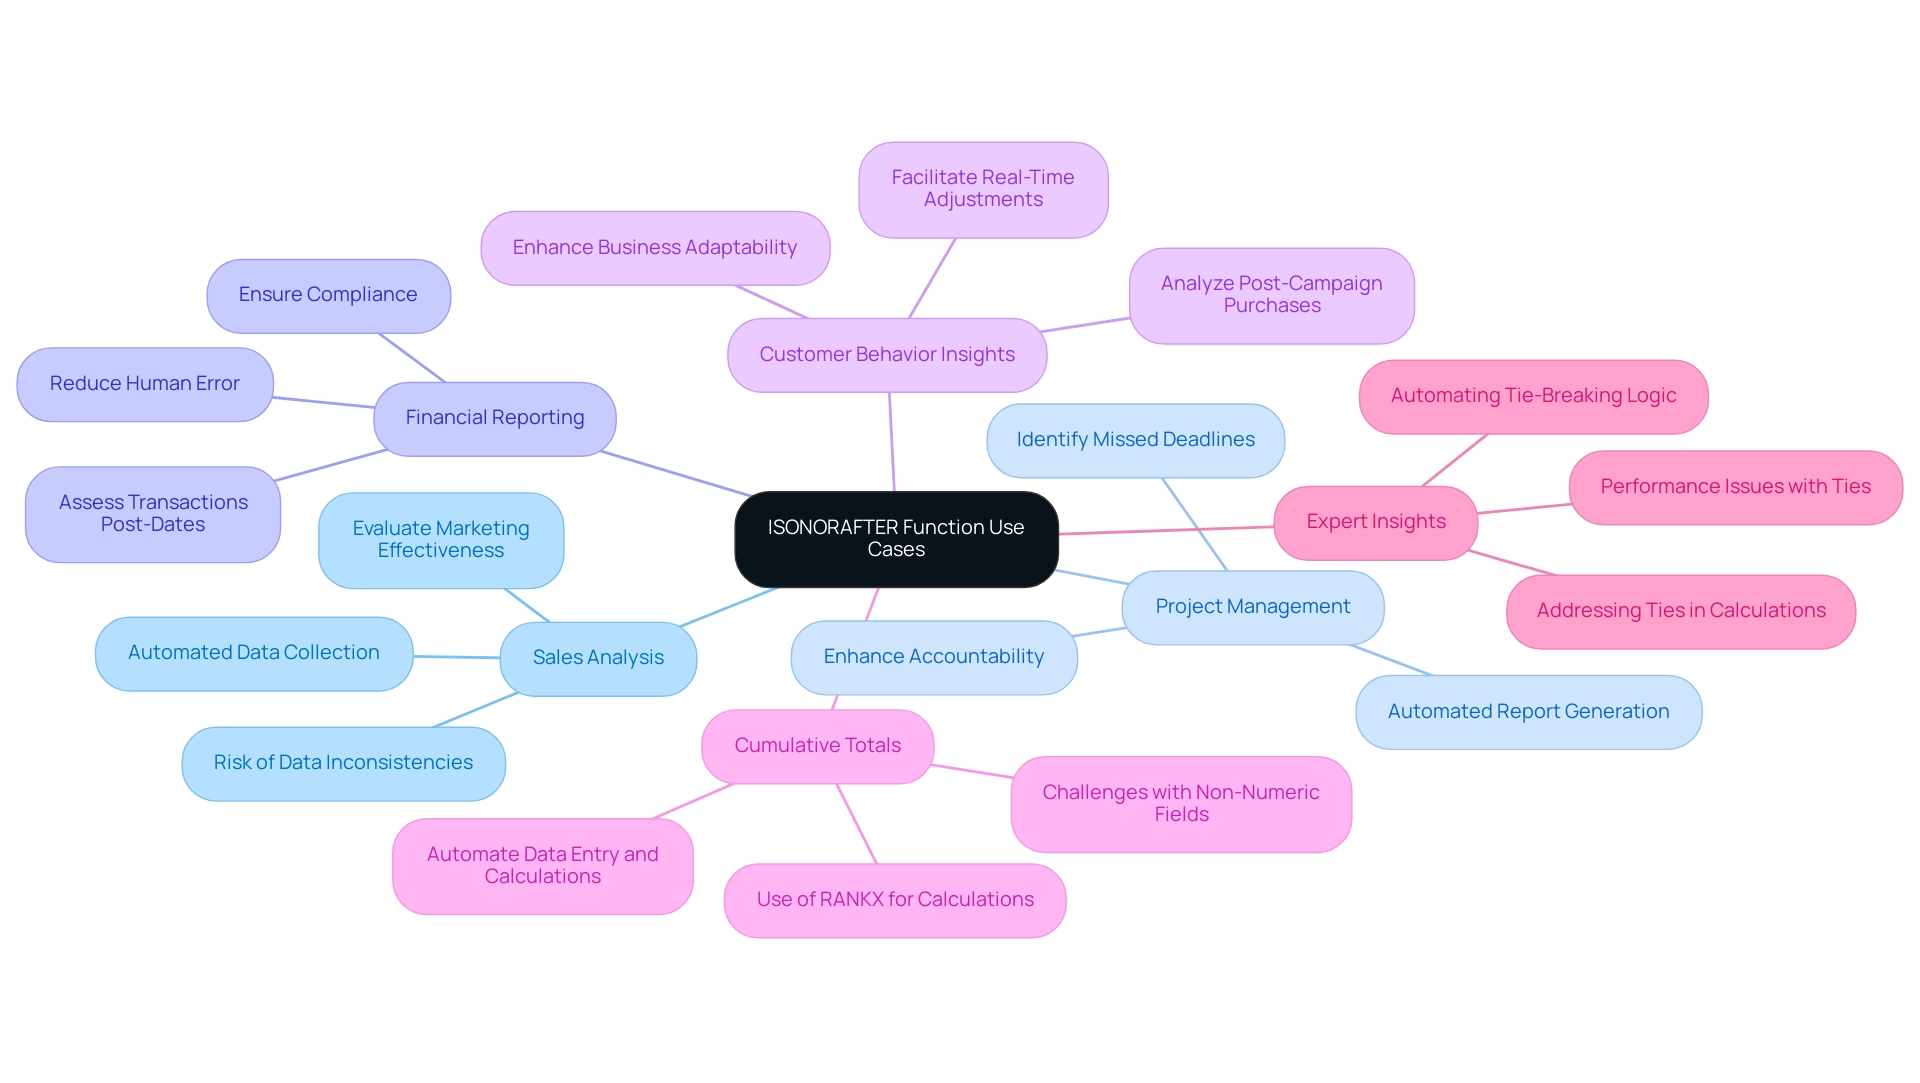
Best Practices for Using the ISONORAFTER Function
To harness the full potential of the ISONORAFTER function while integrating Robotic Process Automation (RPA) and Business Intelligence for enhanced operational efficiency, follow these essential best practices:
-
Ensure Information Accuracy: Begin by confirming that your information is clean and precise. Accurate data is fundamental to reliable outcomes, preventing misleading insights that could detract from decision-making. Notably, the mode is calculated using the dax isonorafter pattern since there is no inherent DAX operation for it, emphasizing the necessity of accuracy in your calculations.
-
Enhance your analysis by combining DAX ISONORAFTER with tools like CALCULATE and FILTER. This synergy allows for the creation of intricate queries that unveil deeper insights, facilitating more informed operational strategies. Utilizing RPA can further automate these processes, ensuring timely insights that drive efficiency.
-
Test with Sample Data: Before launching the process widely, experiment with a small dataset. This testing phase helps you comprehend its behavior and guarantees that it aligns with your analytical expectations, paving the way for smoother integration into automated workflows.
-
Document Your Logic: Maintain clear documentation of the logic behind your DAX formulas. This practice not only aids collaboration within teams but also streamlines future adjustments, ensuring continuity and clarity in your analytical processes. Effective documentation supports the efficient automation of reporting through RPA, and dax isonorafter helps in minimizing inconsistencies.
-
Stay Informed about DAX Modifications: DAX is constantly advancing, with new features and improvements appearing frequently. Staying informed about these updates ensures that you are maximizing the capabilities available to you, ultimately refining your analysis and decision-making processes through dax isonorafter. Embracing AI advancements alongside DAX updates can elevate your operational strategies.
Manual, repetitive tasks can significantly hinder efficiency, leading to wasted time and resources. By integrating tailored AI solutions alongside RPA, you can address these challenges effectively, streamlining workflows and enhancing operational efficiency.
As Douglas Rocha, a Software Engineer, aptly stated, “Hope I’ve helped you in some way and see you next time!” This sentiment reflects the collaborative spirit necessary for mastering DAX functions.
Additionally, consider the case study titled “Visualizing Insights: Integrating DAX with Power BI Visuals,” which highlights effective visualization techniques combined with DAX calculations. This integration not only improves the presentation of insights but also drives actionable outcomes, particularly when RPA is utilized to address the challenges encountered in visualization and reporting.
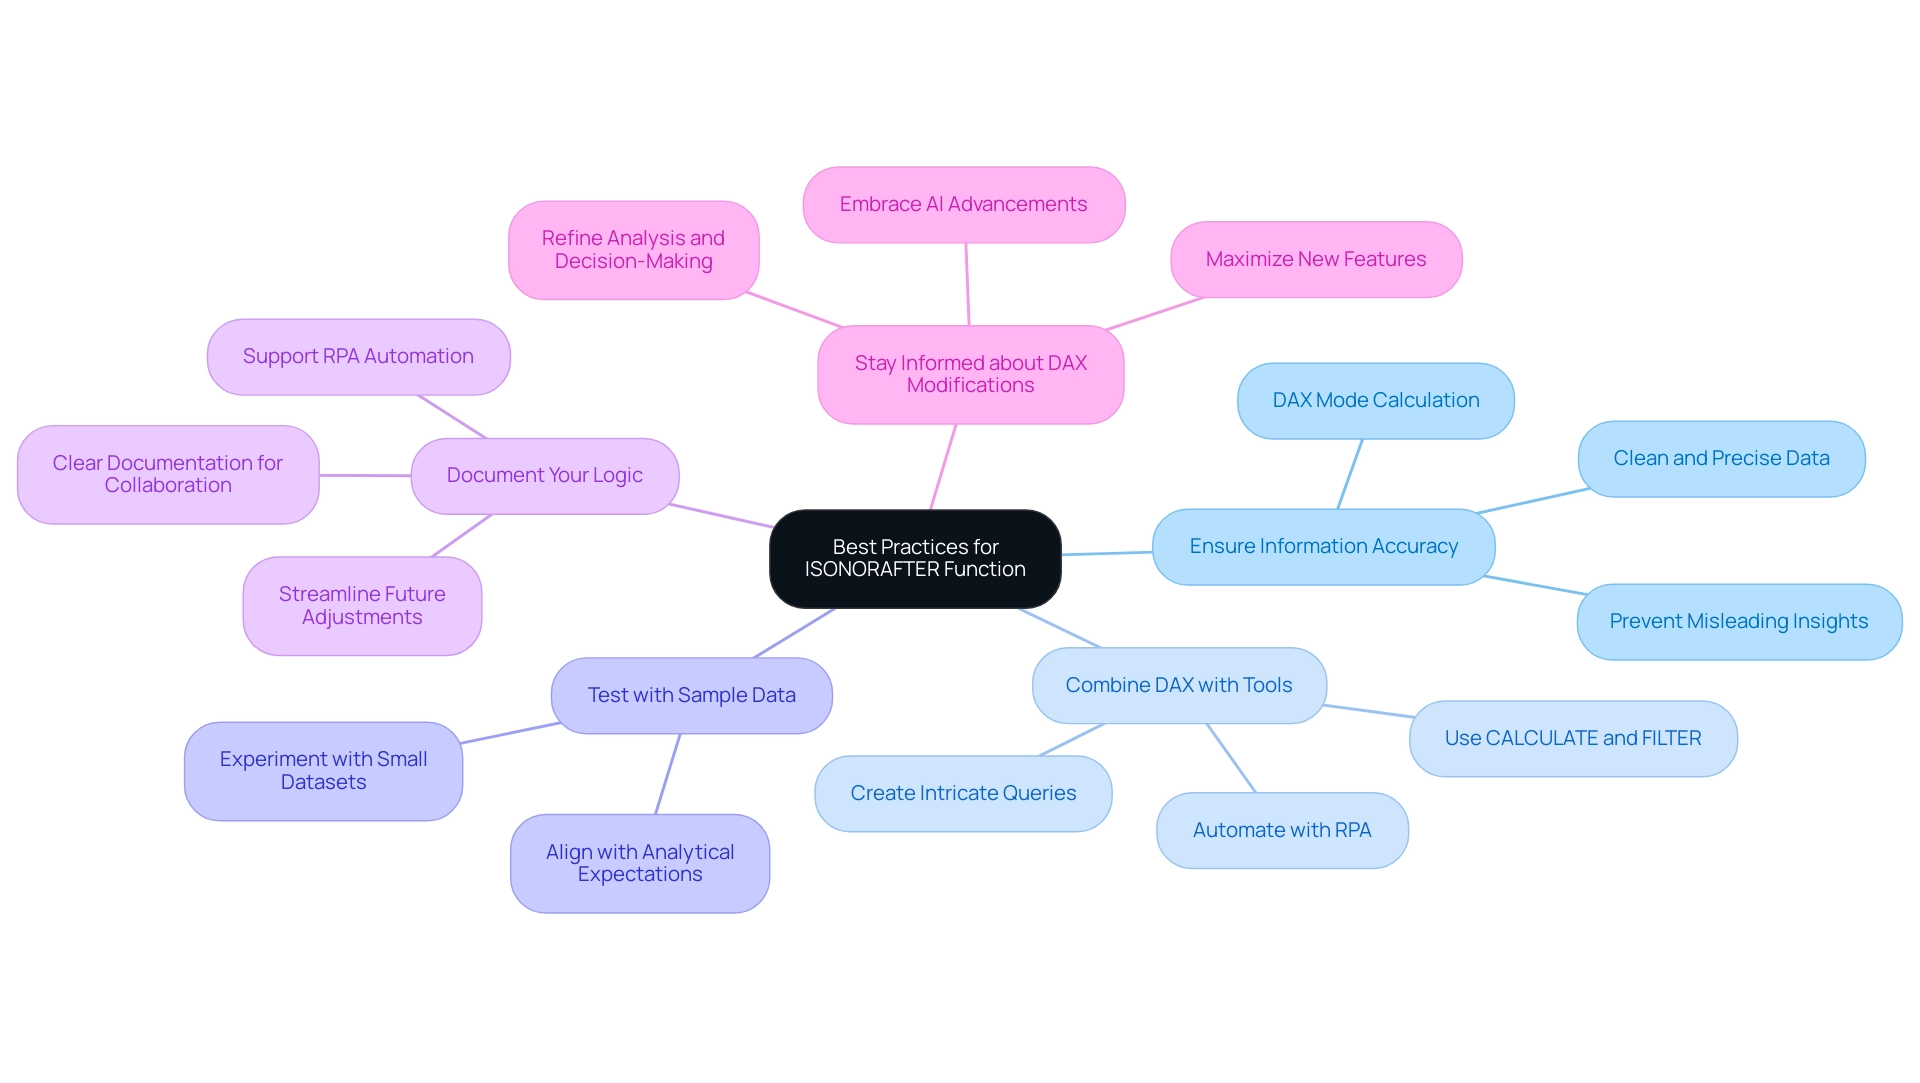
Troubleshooting Common Issues with ISONORAFTER
When utilizing the dax isonorafter function, users may encounter several common challenges that can hinder their analysis, particularly in a data-rich environment where actionable insights are crucial for operational efficiency. Addressing these issues not only resolves potential errors but also enhances user-query performance and the overall user experience, which is vital for driving business growth. Here are key issues and their solutions:
-
Incorrect Information Types: One of the most frequent issues arises from incorrect information types. It’s essential to confirm that the evaluated column is of the correct type—such as date or numeric—to prevent comparison errors. Mismatched information types can lead to unexpected outcomes and complicate your analysis, ultimately hindering your ability to extract valuable insights.
-
Logical Errors: Another common pitfall is logical errors within the formula. Ensure that the logic aligns with your analytical objectives. Misplaced parentheses, incorrect parameters, or flawed logic can trigger misleading results that might distract from your insights. A thorough review of your formula can help clarify the intended analysis, enabling more informed decision-making.
-
Performance Issues: For users working with large datasets, performance can become a significant concern. To enhance performance, consider optimizing your data model. Strategies may include shrinking the dataset size or simplifying DAX expressions. These adjustments can lead to faster query responses, improving efficiency in report creation and allowing you to focus on actionable insights.
-
No Results Returned: If the function dax isonorafter does not yield results, double-check the specified value. Ensure that there are records in the evaluated column that meet the criteria. Sometimes, adjusting the reference value can lead to the expected results, unlocking insights that were previously inaccessible and driving operational improvements.
By proactively addressing these common issues with effective solutions, users can significantly enhance the functionality and reliability of their DAX queries. Furthermore, integrating Robotic Process Automation (RPA) can streamline these processes, reducing the time spent on repetitive tasks and allowing for a more efficient analysis workflow.
As noted by industry experts, whether you are an experienced BI professional or a novice striving to make an impact in the reporting landscape, mastering these foundational concepts is vital for success in using DAX effectively. This mastery is crucial, as highlighted in the case study on foundational concepts of DAX, which underscores that understanding evaluation contexts and iterators is essential for proficiency in the language. Failure to address these challenges can leave businesses at a competitive disadvantage, underscoring the importance of leveraging insights from Power BI dashboards effectively.
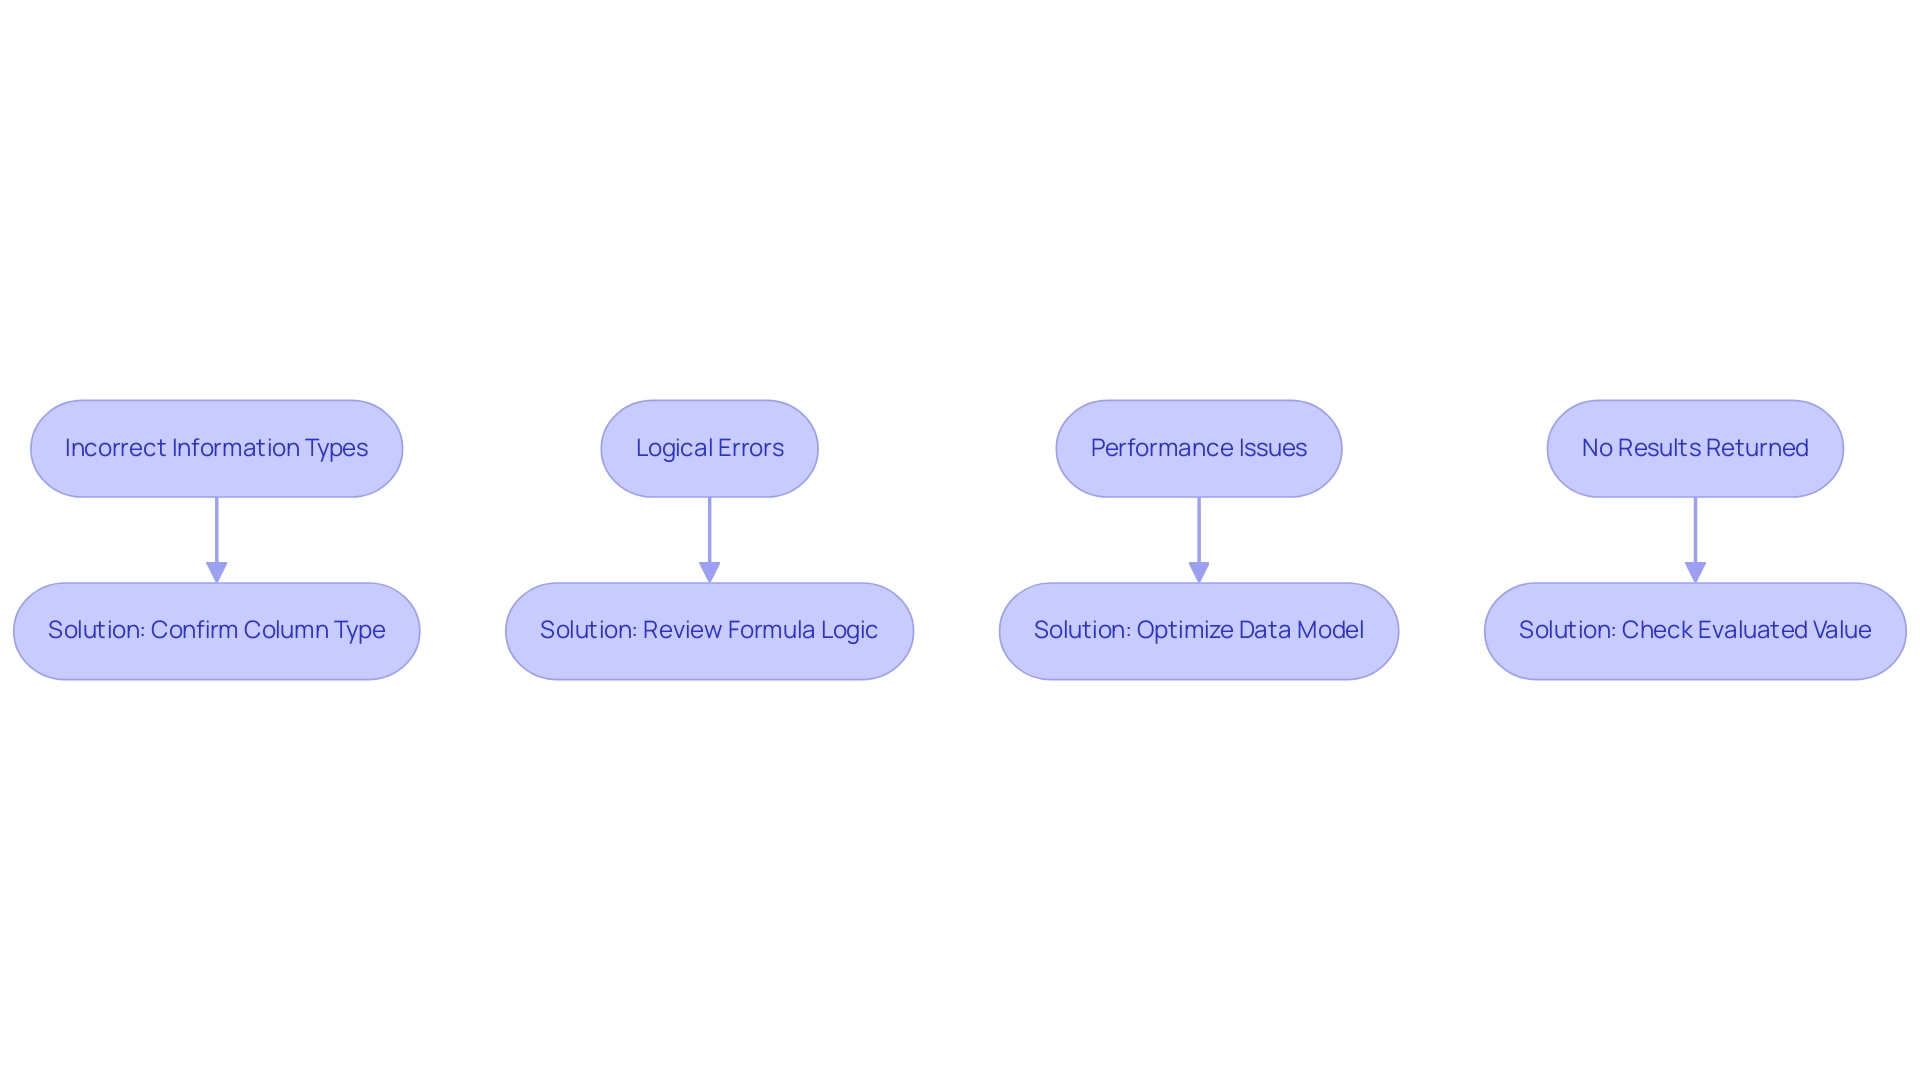
Conclusion
The DAX ISONORAFTER function stands as a pivotal tool for data analysts seeking to enhance their analytical capabilities within Microsoft Power BI. By allowing users to determine whether values in a column occur after a specific reference point, it empowers analysts to conduct time-based and sequential analyses with precision. This functionality not only aids in identifying trends and evaluating performance but also streamlines reporting processes, making it indispensable in today’s data-centric environment.
Integrating ISONORAFTER with Robotic Process Automation (RPA) further amplifies its effectiveness, automating repetitive tasks and optimizing workflows. From sales analysis to financial reporting, the diverse applications of this function demonstrate its versatility in driving informed decision-making across various operational contexts. Best practices, such as ensuring data accuracy and testing with sample datasets, are essential for maximizing the function’s potential while mitigating common issues that may arise.
Ultimately, mastering the ISONORAFTER function is crucial for organizations aiming to maintain a competitive edge. As businesses continue to navigate complex datasets, leveraging advanced tools like ISONORAFTER and RPA will not only enhance operational efficiency but also unlock actionable insights that propel growth. Embracing these capabilities is a vital step toward achieving excellence in data analysis and fostering a data-driven culture within organizations.
Introduction
In the realm of data analysis, the ability to discern whether a dataset holds meaningful information is paramount. The ISEMPTY function in DAX emerges as a crucial ally for data analysts, providing a straightforward means to validate the presence of data within tables and columns. By employing this function, analysts can enhance their reporting accuracy and ensure that insights are grounded in reliable data.
As organizations increasingly rely on Business Intelligence to inform their strategies, mastering ISEMPTY becomes essential for navigating the complexities of data management and delivering actionable insights.
This article delves into the nuances of the ISEMPTY function, exploring its practical applications, common pitfalls, and best practices to empower analysts in their quest for operational efficiency and informed decision-making.
Understanding the ISEMPTY Function in DAX
The dax isempty method serves as an essential resource for analysts to determine whether a specific table or column contains any information. Its syntax is simple and effective: ISEMPTY(<table>). When applied, if the chosen table is empty, as determined by dax isempty, the function returns TRUE; conversely, it returns FALSE when information is present.
This functionality is especially vital in situations requiring rigorous information validation, such as the preparation of comprehensive reports or interactive dashboards. By utilizing a condition check, analysts can create more robust DAX formulas that precisely represent the information landscape, ensuring that their insights and reporting are grounded in trustworthy information. In an era where organizations are increasingly relying on Business Intelligence to drive growth and innovation, using dax isempty in real-world scenarios—like verifying the existence of sales information before performing calculations—safeguards against erroneous outputs that could misinform business strategies.
Moreover, as Yana Khare observes, “Integration and Collaboration: Power BI is compatible with Microsoft Excel, Azure, and SharePoint tools,” this emphasizes the significance of validation within the broader context of effective management. Additionally, RPA solutions can enhance this process by automating repetitive checks, thereby improving operational efficiency. Functions such as DIVIDE can enhance ISEMPTY; for instance, determining average order value only when dax isempty for sales information is available improves the precision of evaluations.
In time-series evaluation, utilizing ISEMPTY with tools such as TOTALYTD can assist analysts in verifying if dax isempty prior to executing year-to-date calculations, thus enhancing the reliability of their assessments. However, challenges such as time-consuming report creation and inconsistencies often hinder effective utilization in Power BI dashboards. Expertise in the ISEMPTY feature not only enhances information integrity but also enables analysts to make informed choices based on precise details, ultimately tackling these challenges and utilizing RPA tools for better operational efficiency.
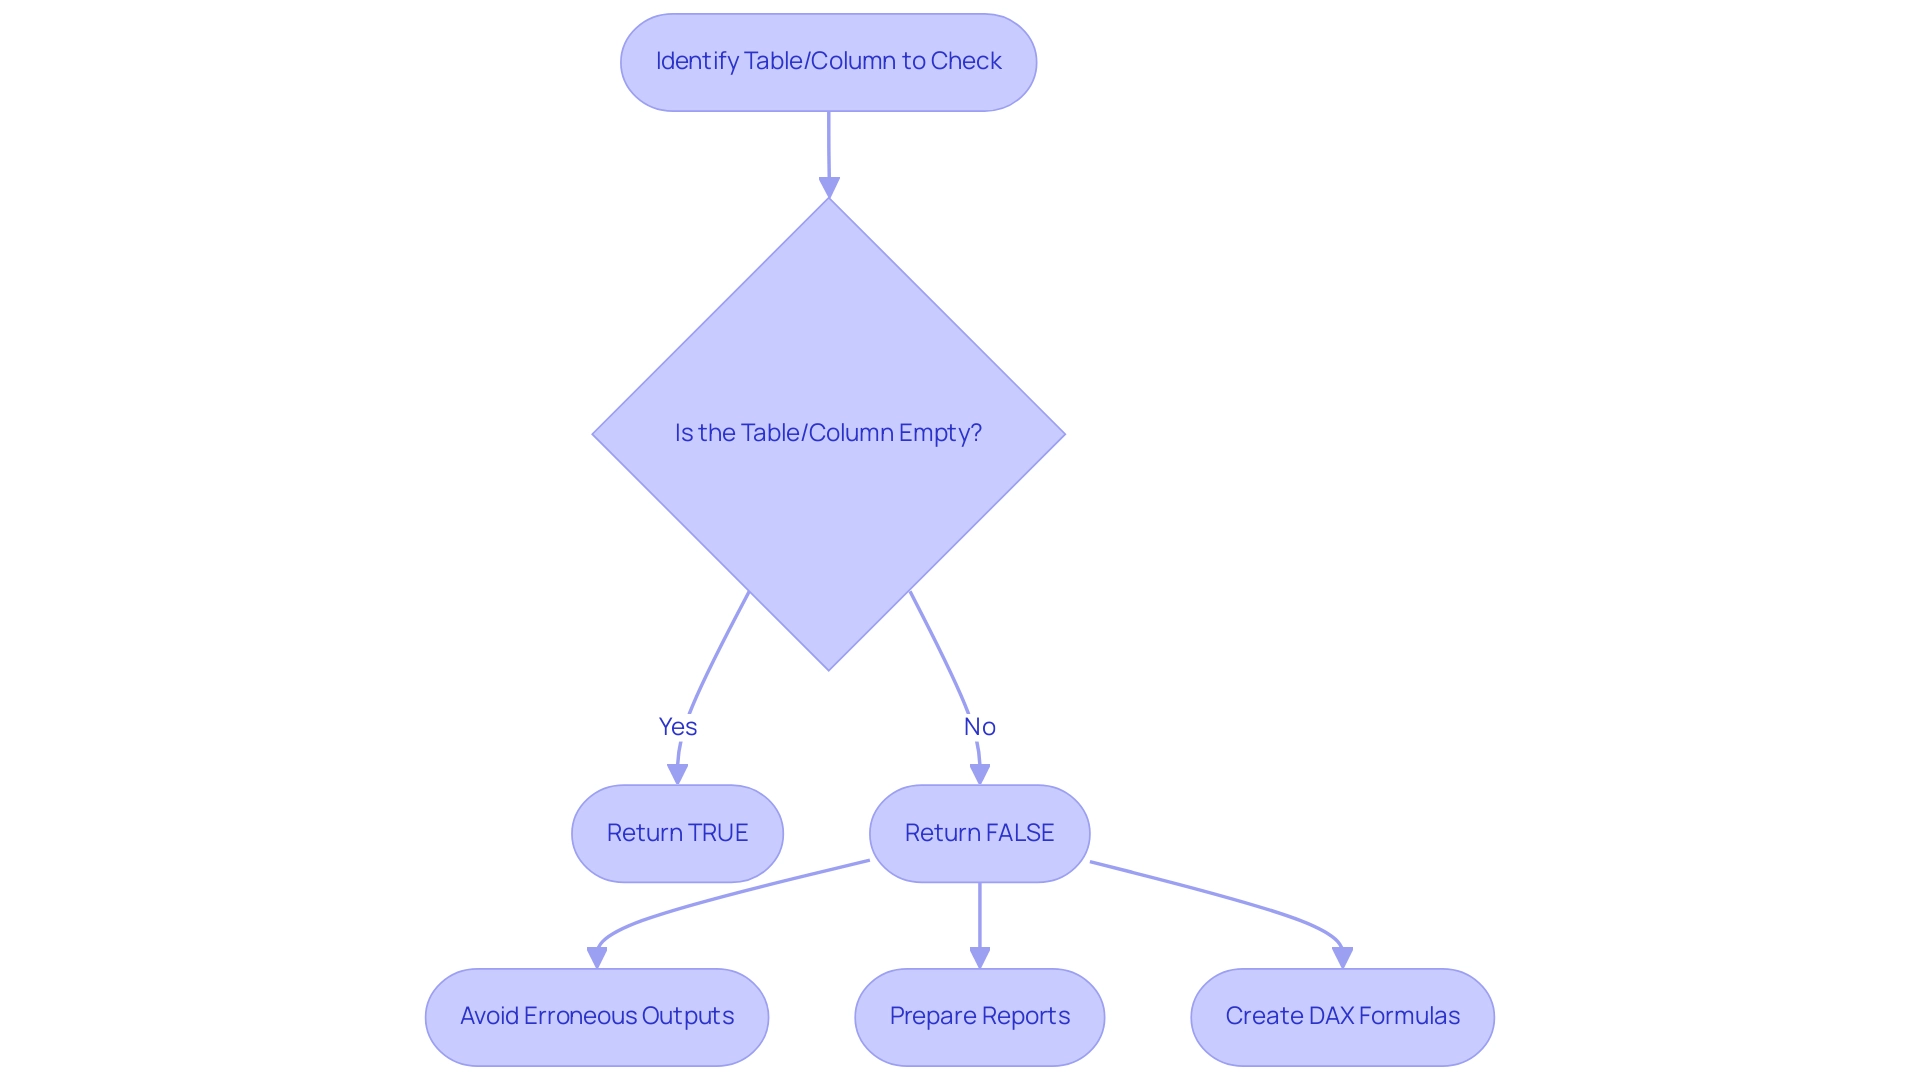
Practical Applications and Examples of ISEMPTY in Data Analysis
The function in DAX presents numerous practical applications that can significantly enhance your analytical capabilities in Power BI, addressing the challenges of data-driven insights and operational efficiency. In a landscape where companies encounter competitive disadvantages due to ineffective information extraction, leveraging Business Intelligence alongside Robotic Process Automation (RPA) can be transformative. Here are some effective uses:
-
Conditional Formatting: Utilize the function to apply conditional formatting to your visuals. For instance, if a measure yields a dax isempty table, you can configure a visual to display a clear message like ‘No Data Available’, thus improving user experience and ensuring clarity in your reports.
-
Dynamic Measures: Create dynamic measures that adjust according to information availability. A practical example is:
Sales Status = IF(ISBLANK(Sales[Total Sales]), 'No Sales Data', 'Sales Recorded'). This functionality enables analysts to communicate insights effectively, making data storytelling more impactful and actionable. -
Error Handling: In intricate DAX calculations, a function can assist in managing potential errors. For instance, when certain conditions lead to empty outputs, verifying before conducting further calculations can prevent errors and ensure smooth processing, thus saving time and effort in report creation.
-
Data Quality Checks: Include the empty check into your validation workflows. When collecting information from multiple sources, use a function to check if any source generates a dax isempty table, enabling you to mark it for review before analysis, thus tackling inconsistencies.
Additionally, incorporating RPA solutions such as EMMA RPA and Power Automate can assist in automating repetitive tasks, enhancing efficiency and employee morale. By streamlining information processes, these tools can alleviate task repetition fatigue and enhance operational effectiveness.
It’s important to note that the ISEMPTY feature is not supported for use in DirectQuery mode when utilized in calculated columns or row-level security (RLS) rules.
Additionally, users are encouraged to submit ideas or suggestions for improving the List.IsEmpty content, fostering community involvement and enhancing the overall resource.
By implementing the ISEMPTY feature in these scenarios, analysts can optimize their processes, ensuring analyses are both accurate and insightful. A pertinent case study titled ‘Using Tuple Syntax in DAX’ demonstrates how similar operations can enhance clarity and efficiency in DAX expressions. As Sreemala Singha wisely mentions,
The next time you face vacant areas in your information, select your method carefully, and reveal the true potential of your analysis.
This approach not only streamlines your workflow but also enhances the quality of your insights, supporting your business growth and innovation.
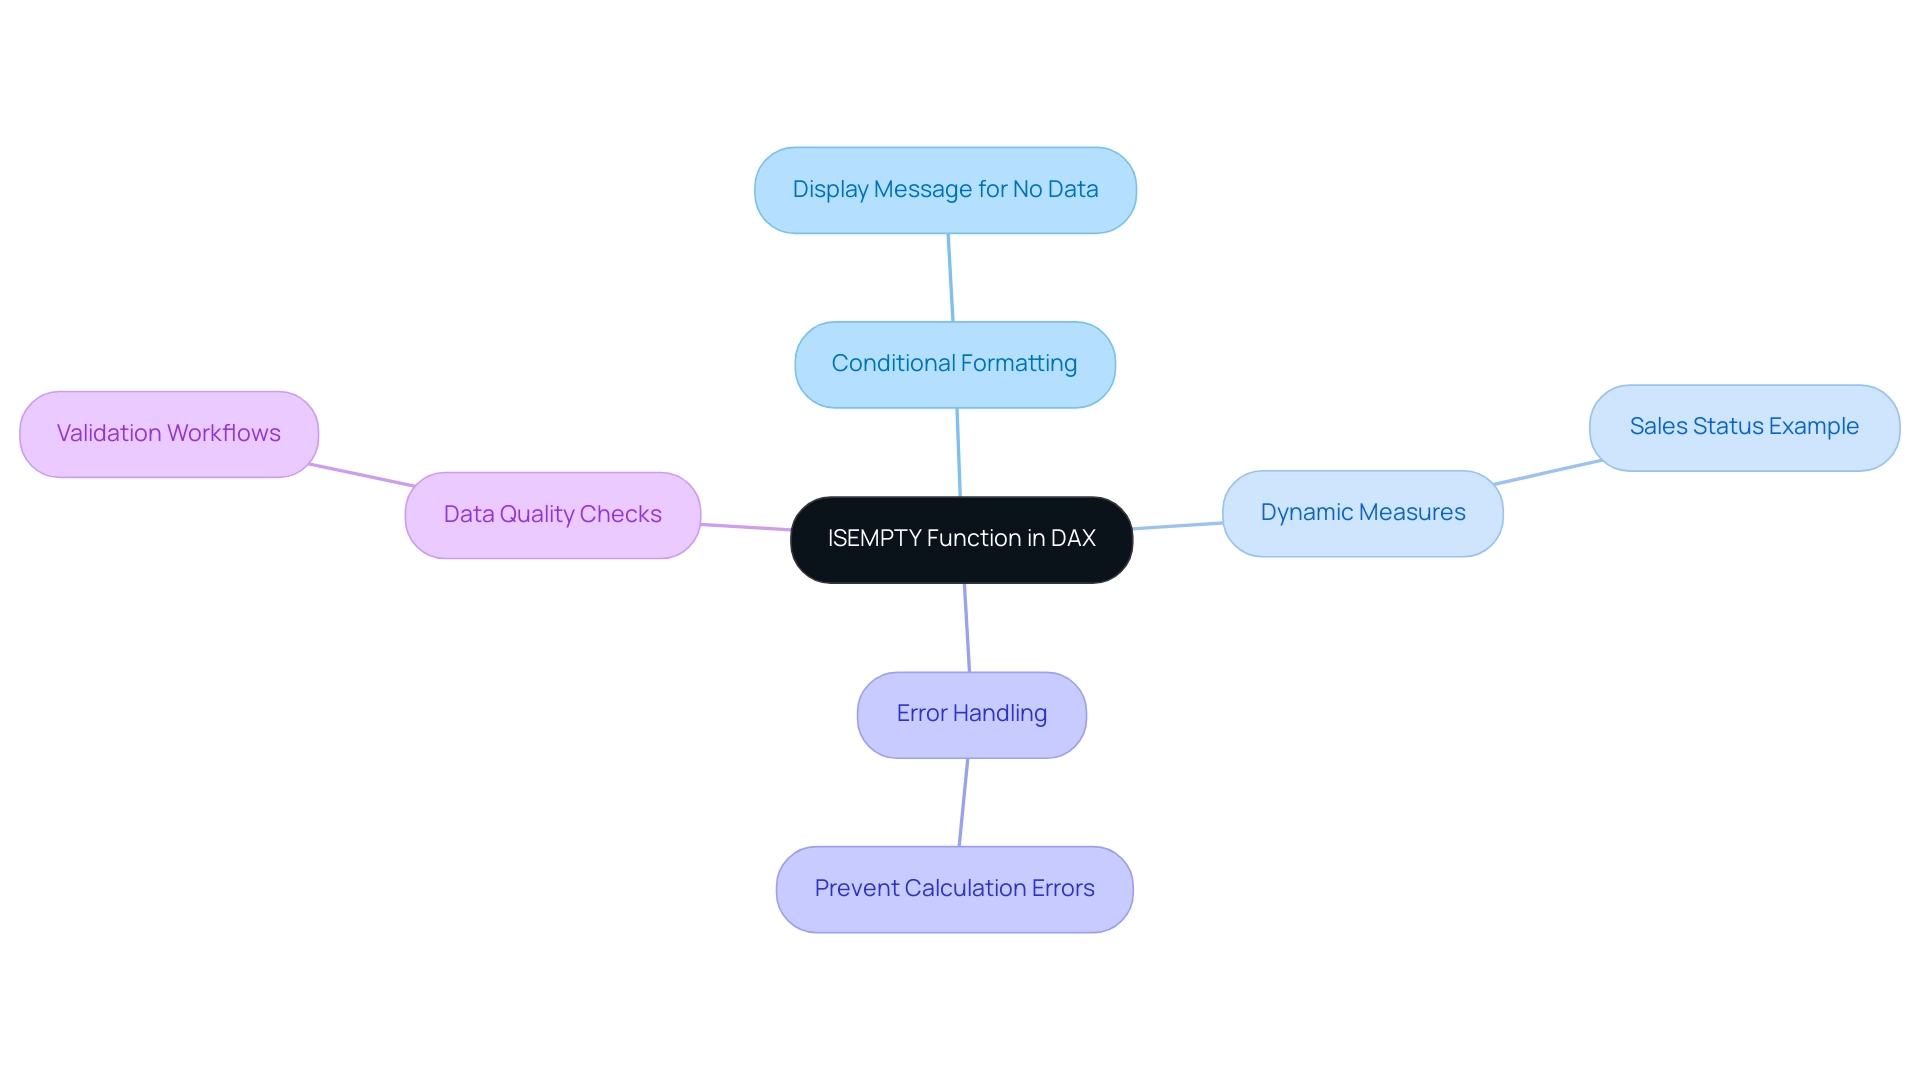
Combining ISEMPTY with Other DAX Functions
Integrating the dax isempty function with other DAX functions can significantly enhance your analysis capabilities, especially considering that there are over 250 DAX functions available in Power BI as of 2024. In today’s information-rich environment, leveraging Business Intelligence and RPA tools is crucial for transforming raw information into actionable insights, driving growth and innovation. However, challenges such as time-consuming report creation and information inconsistencies can hinder this process.
Here are practical examples illustrating the application of the function that also address these challenges:
-
Utilizing a function with CALCULATE: Leveraging this feature enables you to control the behavior of your measures based on availability of information. For instance:
DAX

   Measure = IF(ISEMPTY(SUM(Sales[Total Sales])), 0, CALCULATE(SUM(Sales[Total Sales])))
This DAX expression ensures that if the total sales table is empty, it returns 0, thus preventing misleading zero values in your reports and enhancing the clarity of your data, which is essential for effective decision-making. -
By utilizing the dax isempty check within a FILTER operation, you can create a more dynamic dataset. For example:
DAX

   Filtered Sales = FILTER(Sales, NOT ISEMPTY(Sales[Total Sales]))
This expression generates a table that includes only those rows with non-empty total sales, facilitating cleaner and more accurate analyses, addressing the issue of data inconsistencies.
Mastering these combinations empowers data analysts to extract deeper insights and craft more dynamic reports, ultimately enhancing operational efficiency. Moreover, integrating these DAX operations with RPA solutions can streamline the reporting process, reducing the time spent on manual tasks. As noted by Kamal Sharma, founder and principal consultant, ‘These methods are beneficial for both new and experienced professionals,’ reinforcing their value in your DAX toolkit. Moreover, grasping the syntax for Percent of Total, defined as
DAX

   Percent of Total = DIVIDE([Total Sales], [Total Sales All Countries])
can further improve your proficiency in employing DAX tools to promote data-driven decision-making.
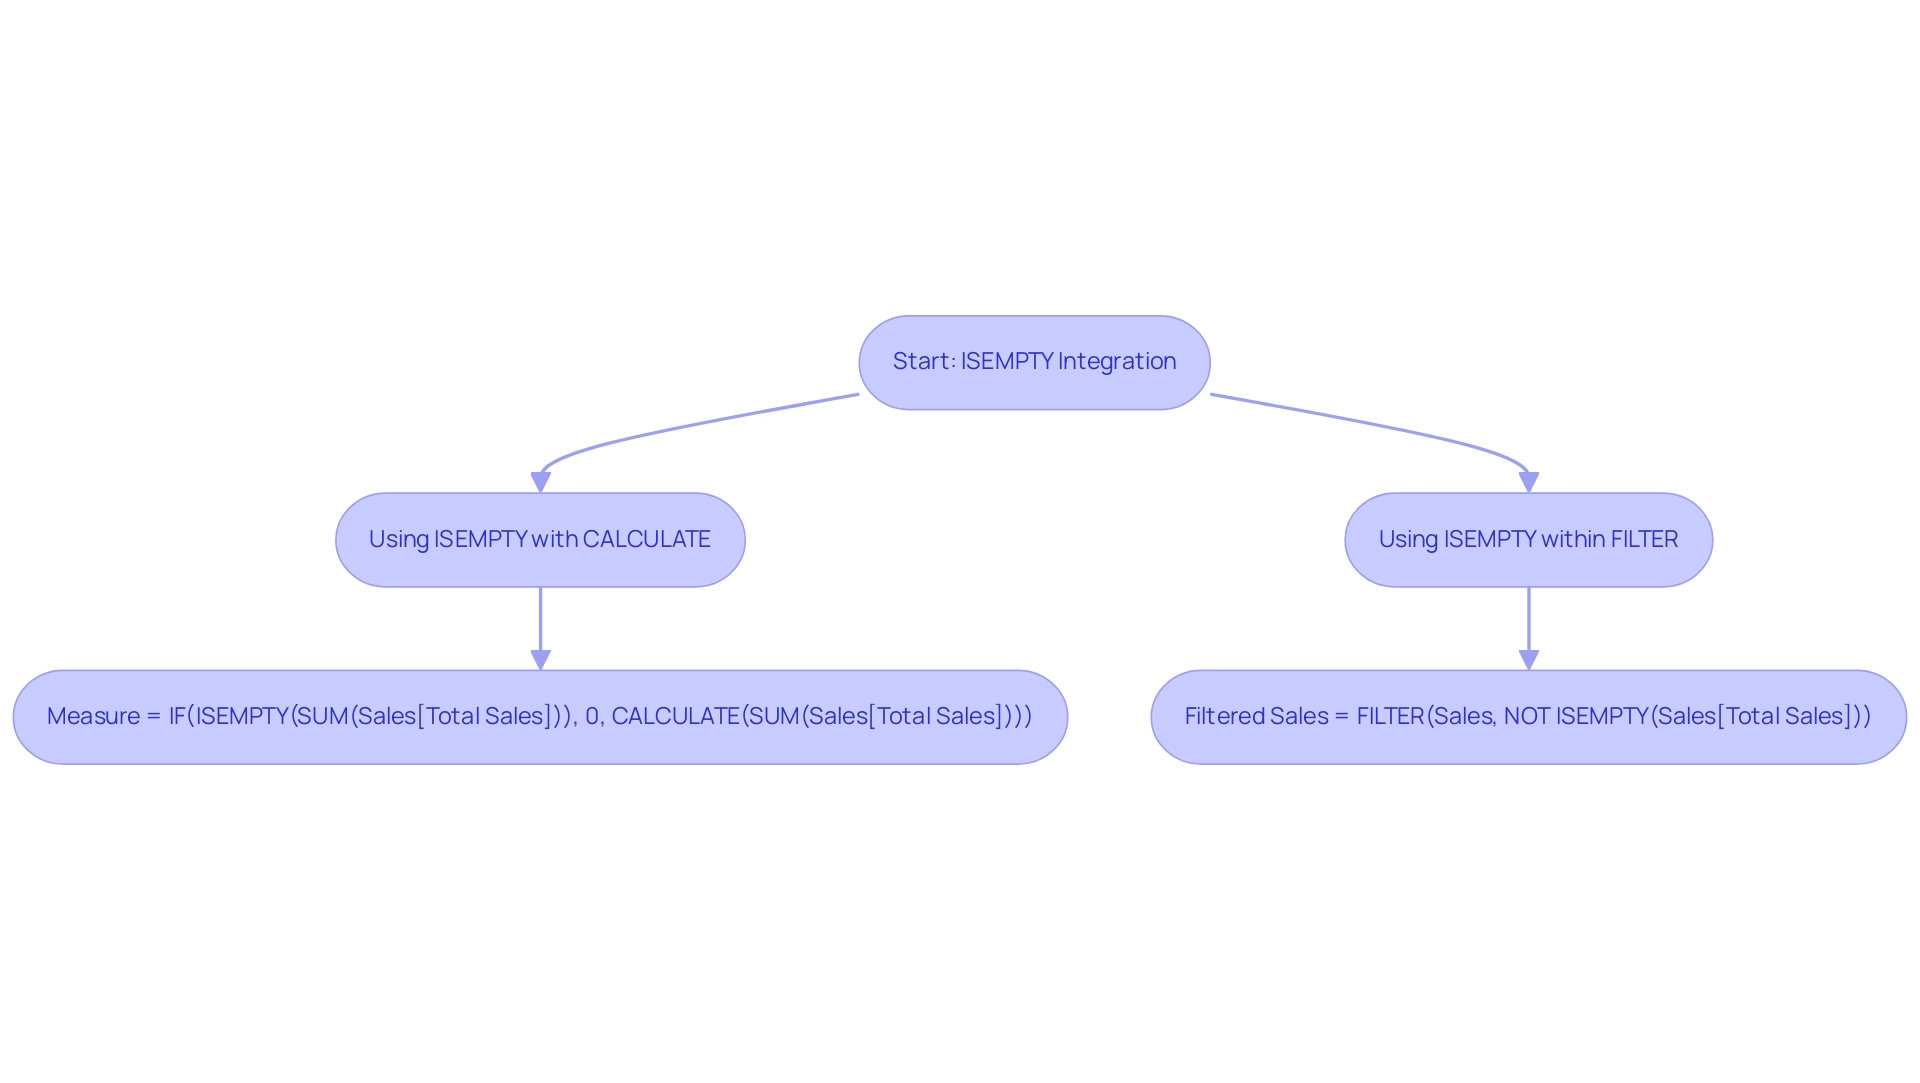
Common Pitfalls When Using ISEMPTY
When utilizing the ISEMPTY function, analysts must navigate several prevalent pitfalls to harness its full potential effectively, especially in the context of poor master data quality which can hinder decision-making and operational efficiency:
-
Distinguishing Between ISBLANK and an Empty Check: Although both operations deal with vacant values, it is essential to understand their unique objectives. The function checks for tables where
dax isempty, while ISBLANK assesses blank values within columns. Choosing the suitable operation based on your particular situation is crucial for precise analysis, especially when handling unreliable information that may hide insights. -
Recognizing Table Context: The ISEMPTY function’s behavior can be significantly influenced by the table context. If the table is subject to filtering or impacted by other calculations, understanding whether
dax isemptyis important for accurately interpreting results. Overlooking these nuances may result in misleading conclusions, particularly considering frequent quality issues. As highlighted in the case study titled “Data Quality Issues in Power BI,” neglecting data quality can result in flawed analyses and poor decision-making, underscoring the importance of validating results to ensure actionable insights. -
Emphasizing Result Validation: After applying the ISEMPTY tool, confirming results within your reports is imperative. Relying solely on this function without thorough cross-checking risks missing critical insights, potentially jeopardizing the integrity of your analysis. To enhance accuracy, especially in environments grappling with inconsistencies, it is advisable to work upstream by creating calculated columns or flags in the back end for complex DAX formulas or repeated filters, particularly when checking if
dax isempty. -
Integrating AI for Enhanced Data Quality: Organizations often hesitate to adopt AI due to perceived complexities and costs. However, integrating AI can significantly enhance information quality processes, making it easier to identify and rectify inconsistencies. By leveraging AI tools, analysts can automate validation processes and gain deeper insights from their datasets, ultimately enhancing decision-making capabilities. Beginning with small AI projects centered on quality can assist organizations in gaining confidence in their AI adoption journey.
By staying alert to these typical missteps, analysts can utilize the empty-checking tool with greater efficacy and precision in their data analysis processes, thus improving the overall quality of insights produced. Additionally, recognizing that ISBLANK is frequently applied in situations where an alternative might be more suitable emphasizes the necessity for careful thought in choosing the method. As Goodly Chandee observes, > DAX has specific conventions for referencing columns and measures within formulas <, underscoring the importance of adherence to these conventions to avoid errors and facilitate a smoother data-driven decision-making process.

Best Practices for Using ISEMPTY in DAX
To fully utilize the empty-checking capability in your DAX analysis and enhance your data-driven insights, consider implementing the following best practices:
-
Document Your Formulas: It is essential to annotate your DAX formulas, especially when employing the function that checks if dax isempty. Clarity in your logic not only streamlines future maintenance but also fosters collaboration among team members. As Henry Chukwunwike Morgan-Dibie states, ‘Simplifying complex topics to empower understanding and decision-making’ is key in ensuring your formulas are accessible to all team members, ultimately driving better business outcomes.
-
Test with Sample Data: Prior to deploying any complex DAX formulas in production environments, rigorously test them against sample datasets. For instance, when utilizing the Related Table Count feature, which provides the total rows in a related table, you can confirm your empty logic. This proactive approach allows for the early identification of logical errors, ensuring your calculations perform as intended and contribute to operational efficiency. Addressing potential information inconsistencies at this stage can significantly reduce time-consuming report creation later on.
-
Combine with Error Management: Improve the robustness of your DAX statements by incorporating a mechanism to check dax isempty alongside error management features like IFERROR. This strategy effectively manages unexpected results, ensuring your reports remain trustworthy even when anomalies occur, thereby supporting informed decision-making.
-
Stay Updated on DAX Improvements: The DAX landscape is continually evolving, with updates and new features regularly introduced. To optimize your use of available tools and other capabilities, participate in community forums and consult official Microsoft documentation to remain updated on the latest developments. Additionally, consider creating calculated columns or flags in the backend for complex DAX formulas, as illustrated in the case study titled ‘Working Upstream for Complex Calculations.’ This approach can simplify your calculations and enhance performance, ensuring your insights are actionable and tackling the challenges of extracting meaningful insights from Power BI dashboards.
By following these best practices, analysts can unlock the full potential of the ISEMPTY function, ensuring that dax isempty is properly leveraged, leading to more impactful analysis, comprehensive reporting, and ultimately, improved operational efficiency and business growth. This approach not only mitigates the challenges of time-consuming report creation and data inconsistencies but also transforms raw data into actionable insights.
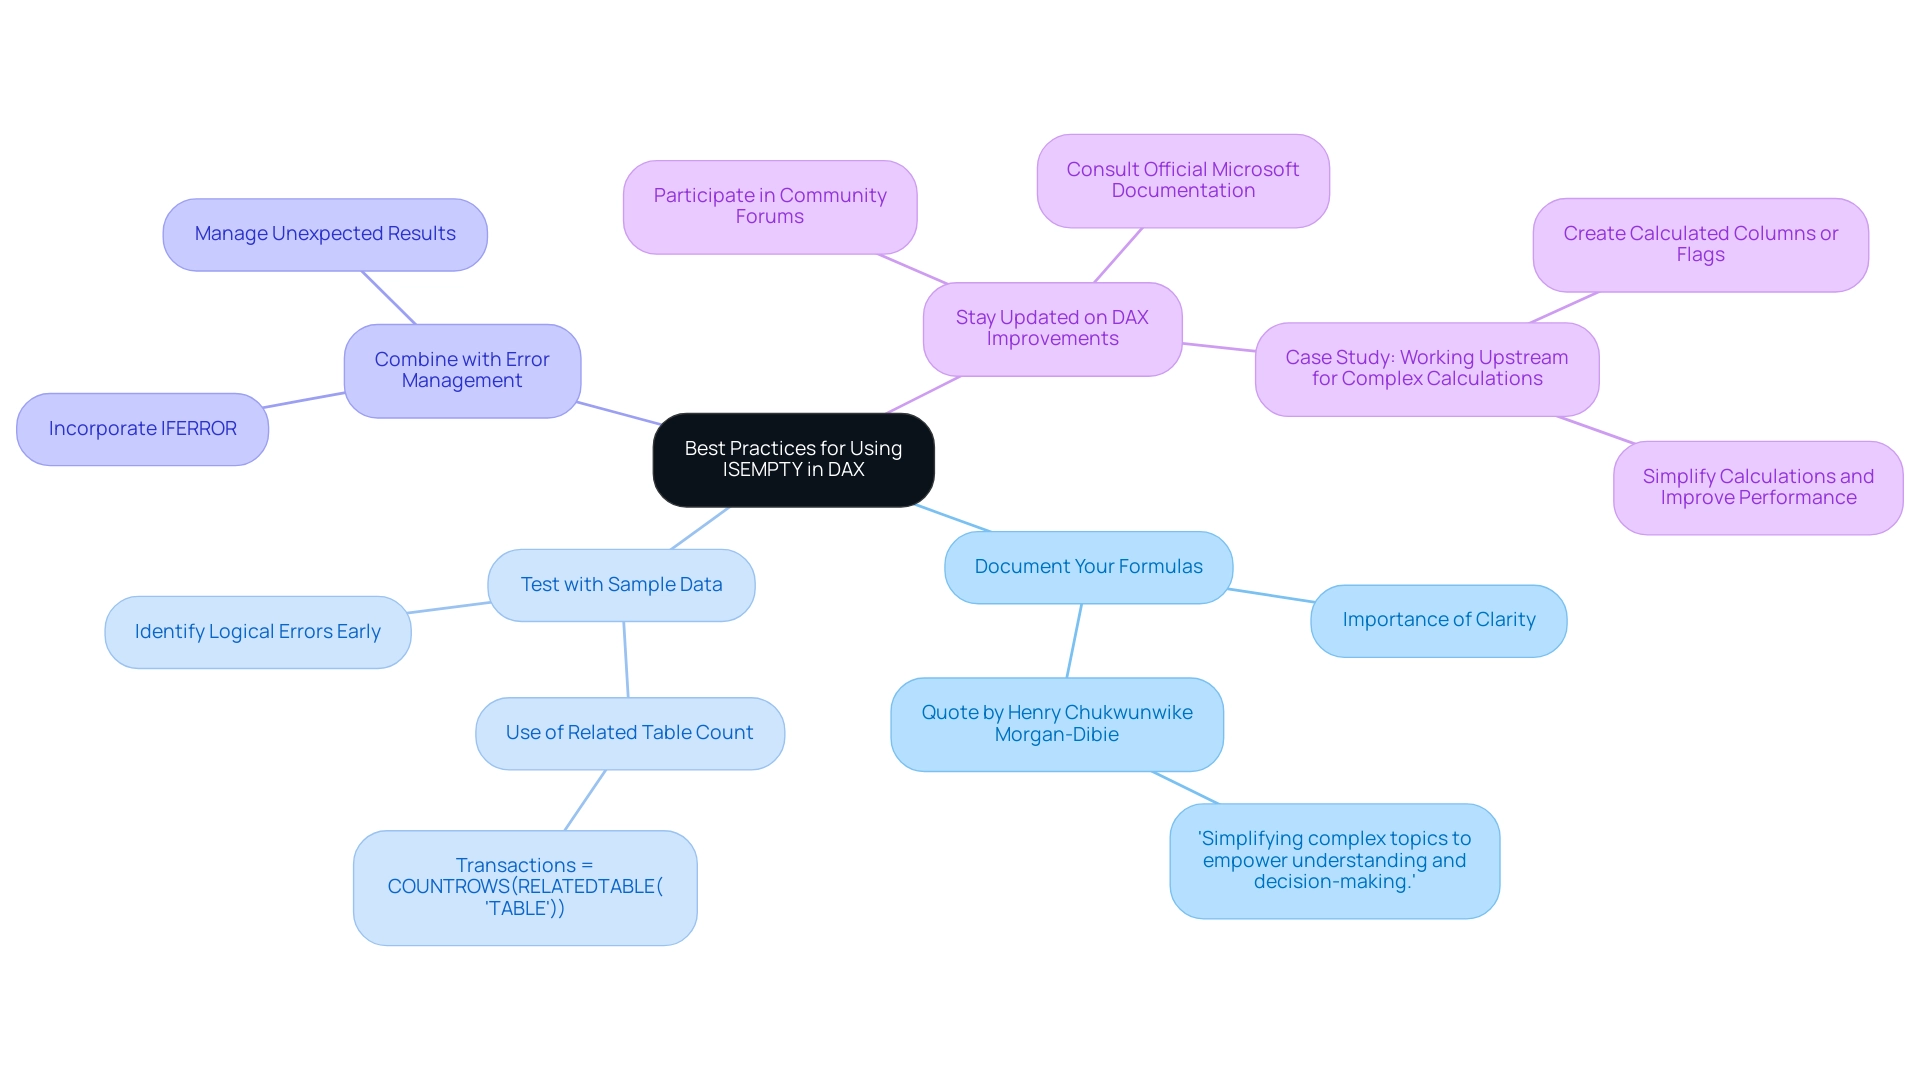
Conclusion
Mastering the ISEMPTY function in DAX is essential for data analysts seeking to enhance the integrity and reliability of their analyses. This function serves as a foundational tool that enables the identification of empty tables and columns, ensuring that insights are built on solid data. By applying ISEMPTY, analysts can avoid common pitfalls associated with empty data, streamline their reporting processes, and improve the overall clarity of their visualizations.
The practical applications of ISEMPTY demonstrate its versatility, from facilitating dynamic measures and effective error handling to enhancing data quality checks. Combining ISEMPTY with other DAX functions further amplifies its efficacy, allowing for more robust data management and improved decision-making capabilities. By integrating these strategies, analysts can not only address the challenges of data inconsistencies but also leverage automation tools to improve operational efficiency.
As organizations increasingly rely on data-driven insights to inform their strategies, the importance of validating data using ISEMPTY cannot be overstated. By adopting best practices, such as documenting formulas and testing with sample data, analysts can unlock the full potential of their analyses. Embracing this approach will lead to more accurate, actionable insights that drive business growth and innovation. Ultimately, mastering the ISEMPTY function is a crucial step in navigating the complexities of data management and enhancing operational efficiency.
Introduction
In the realm of data analysis, mastering the intricacies of DAX (Data Analysis Expressions) is essential for transforming raw numbers into meaningful insights. As organizations strive to enhance their operational efficiency and decision-making capabilities, understanding the foundational principles of DAX becomes crucial.
This article delves into the core concepts and practical techniques for performing accurate percentage calculations, addressing common challenges that arise in data reporting. From leveraging the powerful DIVIDE function to implementing conditional formatting for better data visualization, readers will discover actionable strategies that enhance clarity and reliability in their analyses.
Furthermore, the integration of Robotic Process Automation (RPA) with DAX functions is explored, highlighting how automation can streamline processes and elevate business intelligence efforts. With these insights, businesses can not only overcome obstacles but also harness the full potential of their data to drive growth and success.
Understanding DAX Basics for Percentage Calculations
DAX, or Data Analysis Expressions, is a powerful formula language integral to Power BI, Excel, and various Microsoft applications, facilitating custom calculations that drive insights. In the context of today’s information-driven landscape, a solid grasp of DAX basics is vital for addressing challenges such as time-consuming report creation and inconsistencies that often plague Power BI dashboards. Effective DAX usage can convert raw information into actionable insights, enabling informed decision-making that propels business growth.
For example, grasping the difference between measures and calculated columns is essential; measures are dynamic, performing computations at the time of query, while calculated columns are created during refresh, influencing structure and analysis. For effective calculations in DAX format percentage, it is crucial to recognize the distinction between total values and their individual components. A fundamental formula for calculating DAX format percentage in DAX is: Percentage = (Numerator / Denominator) * 100.
This formula underscores the necessity of accurately identifying both the numerator and denominator to ensure the integrity of results. For example, in analyzing sales information, statistics show that cars sold for over 180 thousand Reais indicate the existence of outliers, which can skew results if not properly accounted for. Additionally, understanding customer behavior is essential; for example, research indicates that 2% of customers will become super customers within a three-year period, demonstrating the potential impact of effective DAX usage on revenue growth.
Furthermore, the SUMX operation serves as a practical application of DAX, calculating the sum of an expression evaluated for each row in a table, which is instrumental in determining total revenue generated by each product. Integrating DAX with Robotic Process Automation (RPA) can further enhance operational efficiency by automating repetitive tasks involved in analysis, allowing for quicker insights and reduced manual effort. Mastering these concepts equips users to leverage DAX effectively, enhancing their analytical capabilities in business intelligence and overcoming operational challenges.
To learn more about how RPA can enhance your DAX capabilities and improve your business processes, book a free consultation today.
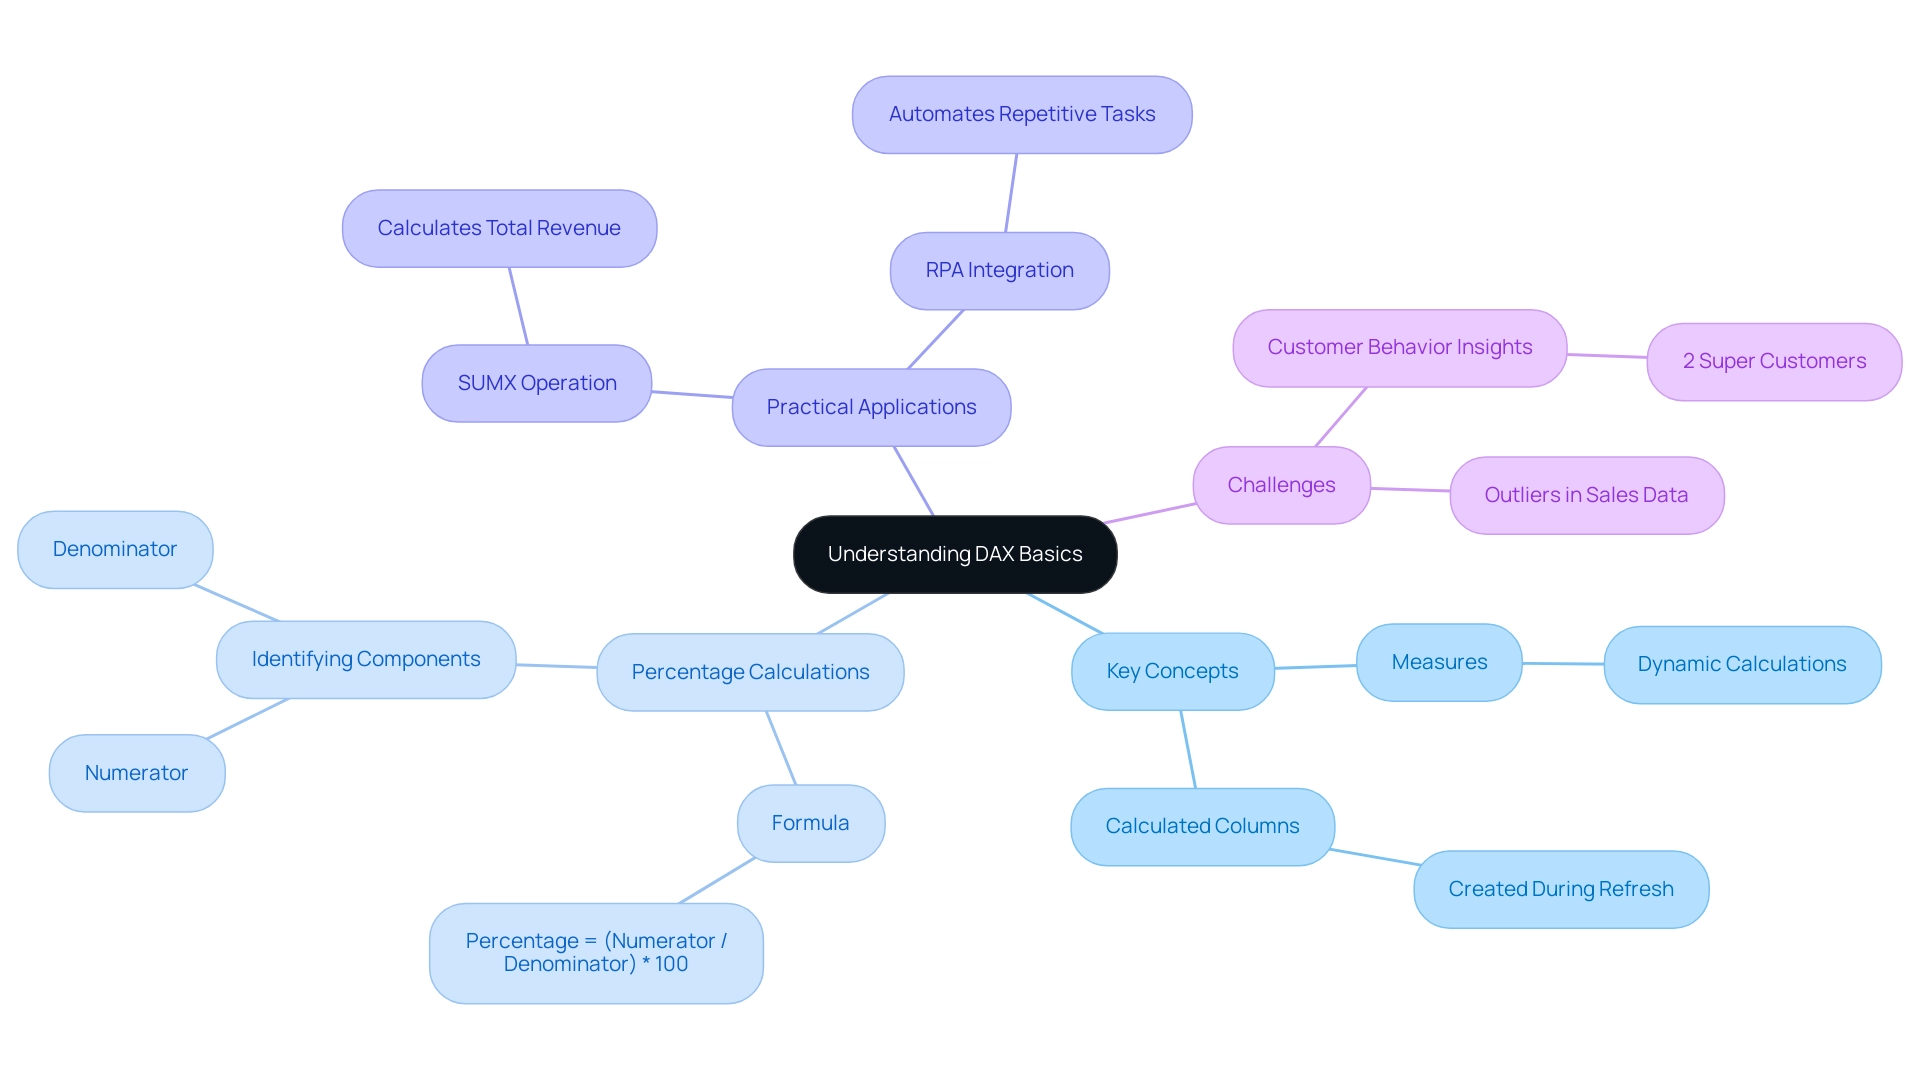
Practical Techniques for Accurate Percentage Calculations in DAX
Among the various features available in DAX, the DIVIDE tool stands out as a robust resource for calculating percentages, particularly due to its ability to gracefully manage division by zero errors—crucial in a landscape where precise information quality drives operational efficiency. In numerous organizations, the absence of data-driven insights can obstruct growth, making it crucial to employ effective DAX expressions like DIVIDE to convert raw data into actionable insights. The syntax for the DIVIDE operation is straightforward: DIVIDE(Numerator, Denominator, AlternateResult).
For instance, to compute a sales percentage in dax format percentage, you might use the expression: sales percentage = DIVIDE(SUM(Sales[Sales Amount]), SUM(Sales[Total Amount]), 0). This approach ensures that if the denominator is zero, it returns zero instead of generating an error, enhancing the reliability of your calculations, which is vital for informed decision-making. In contrast, other operations in DAX, such as volatile operations, may yield varying results each time they are invoked, highlighting the significance of utilizing DIVIDE for reliable outcomes amidst the challenges of inconsistencies frequently encountered in Power BI dashboards.
Moreover, utilizing RPA solutions such as EMMA RPA and Power Automate can enhance the application of DAX capabilities by automating information preparation processes, thereby improving operational efficiency and minimizing the laborious aspect of report creation. Additionally, utilizing the FORMAT function can significantly enhance the presentation of your results in dax format percentage. For example, you can format the sales percentage using dax format percentage by applying: Sales PercentageFormatted = FORMAT(Sales Percentage, 'Percent').
By utilizing these methods, not only do you attain accurate results, but you also improve the clarity of your reports, making the information more understandable for stakeholders. It’s noteworthy that 2% of customers become super customers within a three-year period; this statistic underscores the importance of accurate data in driving business success and operational efficiency. Moreover, the case study on the HASONEVALUE feature demonstrates how various DAX operations can be utilized for comparable tasks, emphasizing the necessity to adopt best practices such as using DIVIDE in your assessments.
Therefore, utilizing the DIVIDE function in your DAX calculations is not just a best practice but a critical step towards overcoming barriers to AI adoption and enhancing operational efficiency.
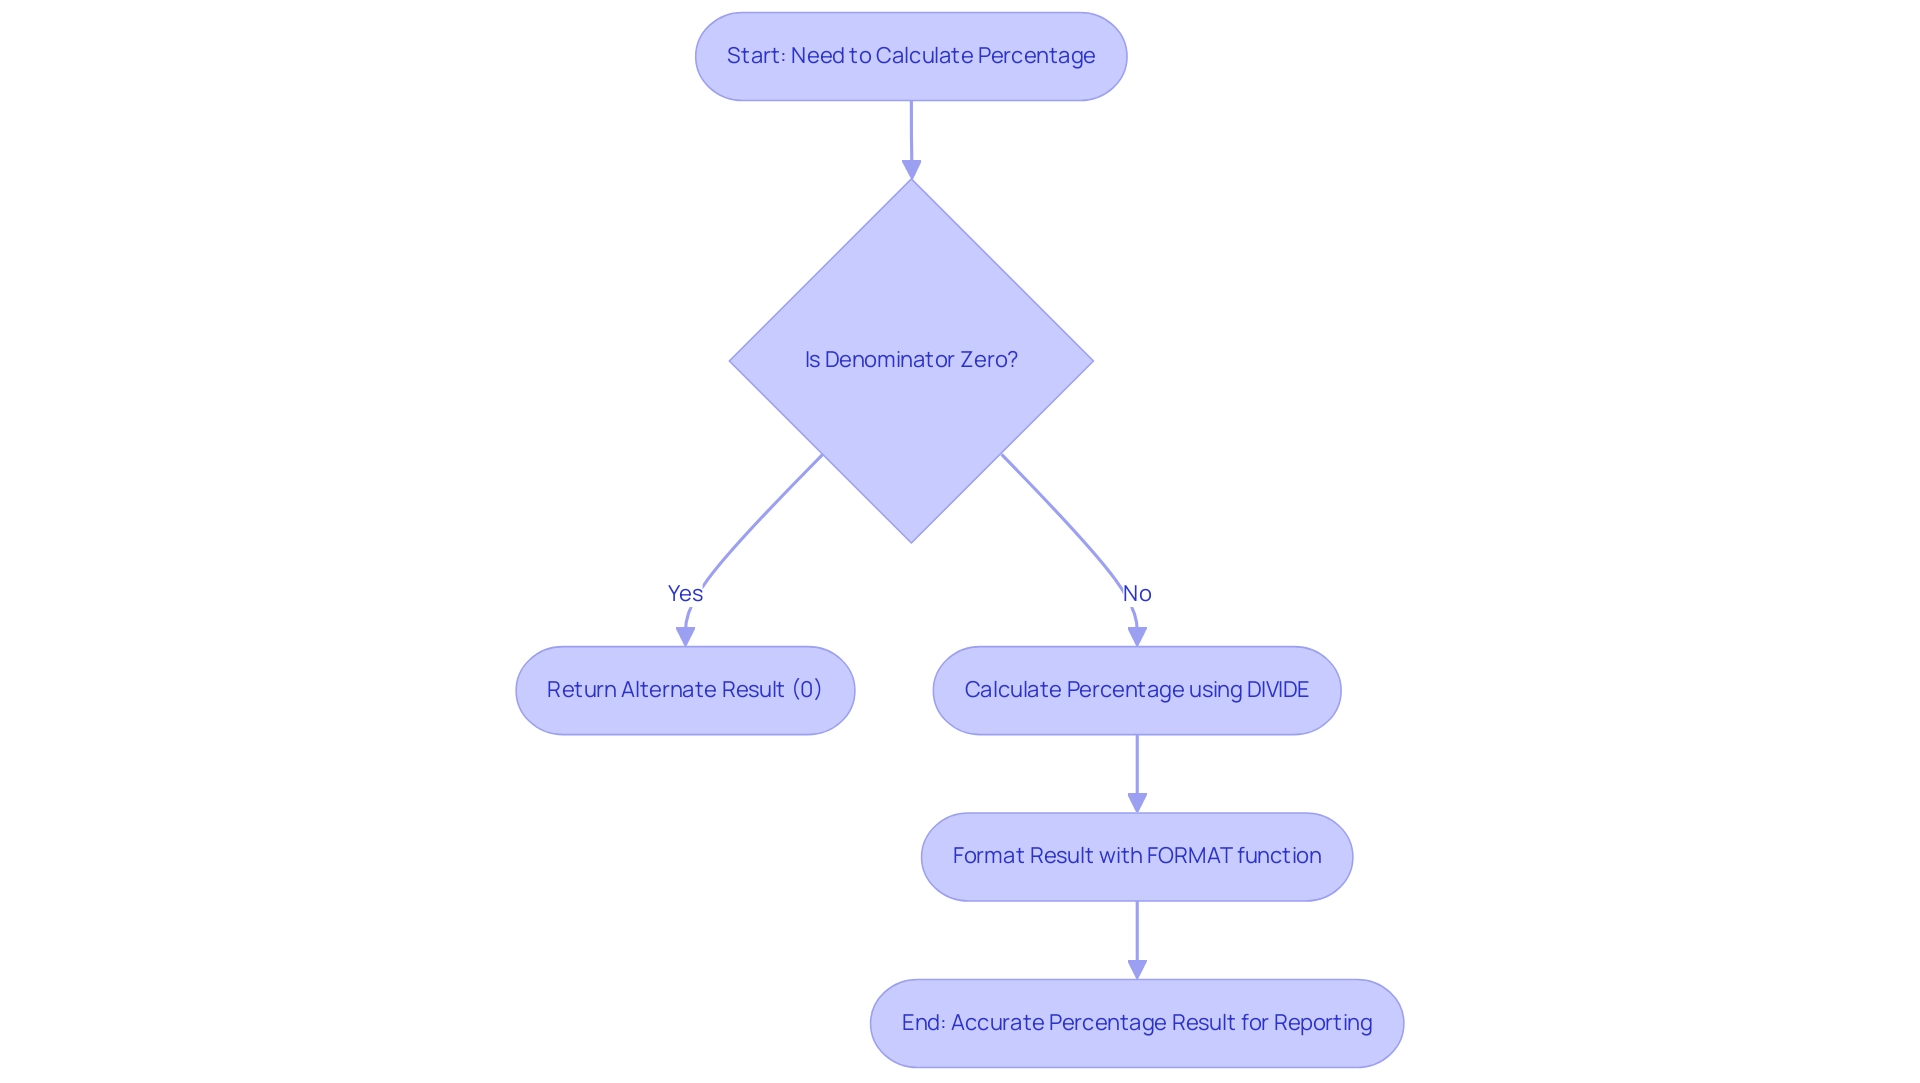
Enhancing Visuals: Conditional Formatting for Percentage Data
To enhance the interpretability of percentage information in Power BI, using dax format percentage with the implementation of conditional formatting is essential. This powerful tool enables users to highlight values according to specific criteria, facilitating the quick identification of trends and outliers—an integral aspect of harnessing Business Intelligence for informed decision-making. For effective application, begin by navigating to the Visualization pane, selecting the desired measure, and opting for ‘Conditional Formatting’.
Here, you can establish rules that alter the text or background color based on dax format percentage values. For instance, employing a gradient color scale that transitions from red (indicating low performance) to green (indicating high performance) can show a gradual increase or decrease in values at a glance, especially when represented in dax format percentage, providing immediate visual cues. As stated, ‘The next step is to apply the rules and conditions that define how the formatting will be applied to your information.’
Such techniques not only enhance information interpretation but also enable stakeholders to make informed decisions swiftly, addressing challenges like time-consuming report creation and inconsistencies. Furthermore, incorporating RPA solutions can simplify the preparation process, decreasing the time spent on report generation and ensuring consistency across dashboards. A case study titled ‘Applying Rules and Conditions in Conditional Formatting’ illustrates how the right rules and conditions can lead to complex scenarios and improved representation of significance.
The strategic application of conditional formatting acts as a catalyst for clearer communication of insights and more efficient decision-making processes, ultimately driving business growth.
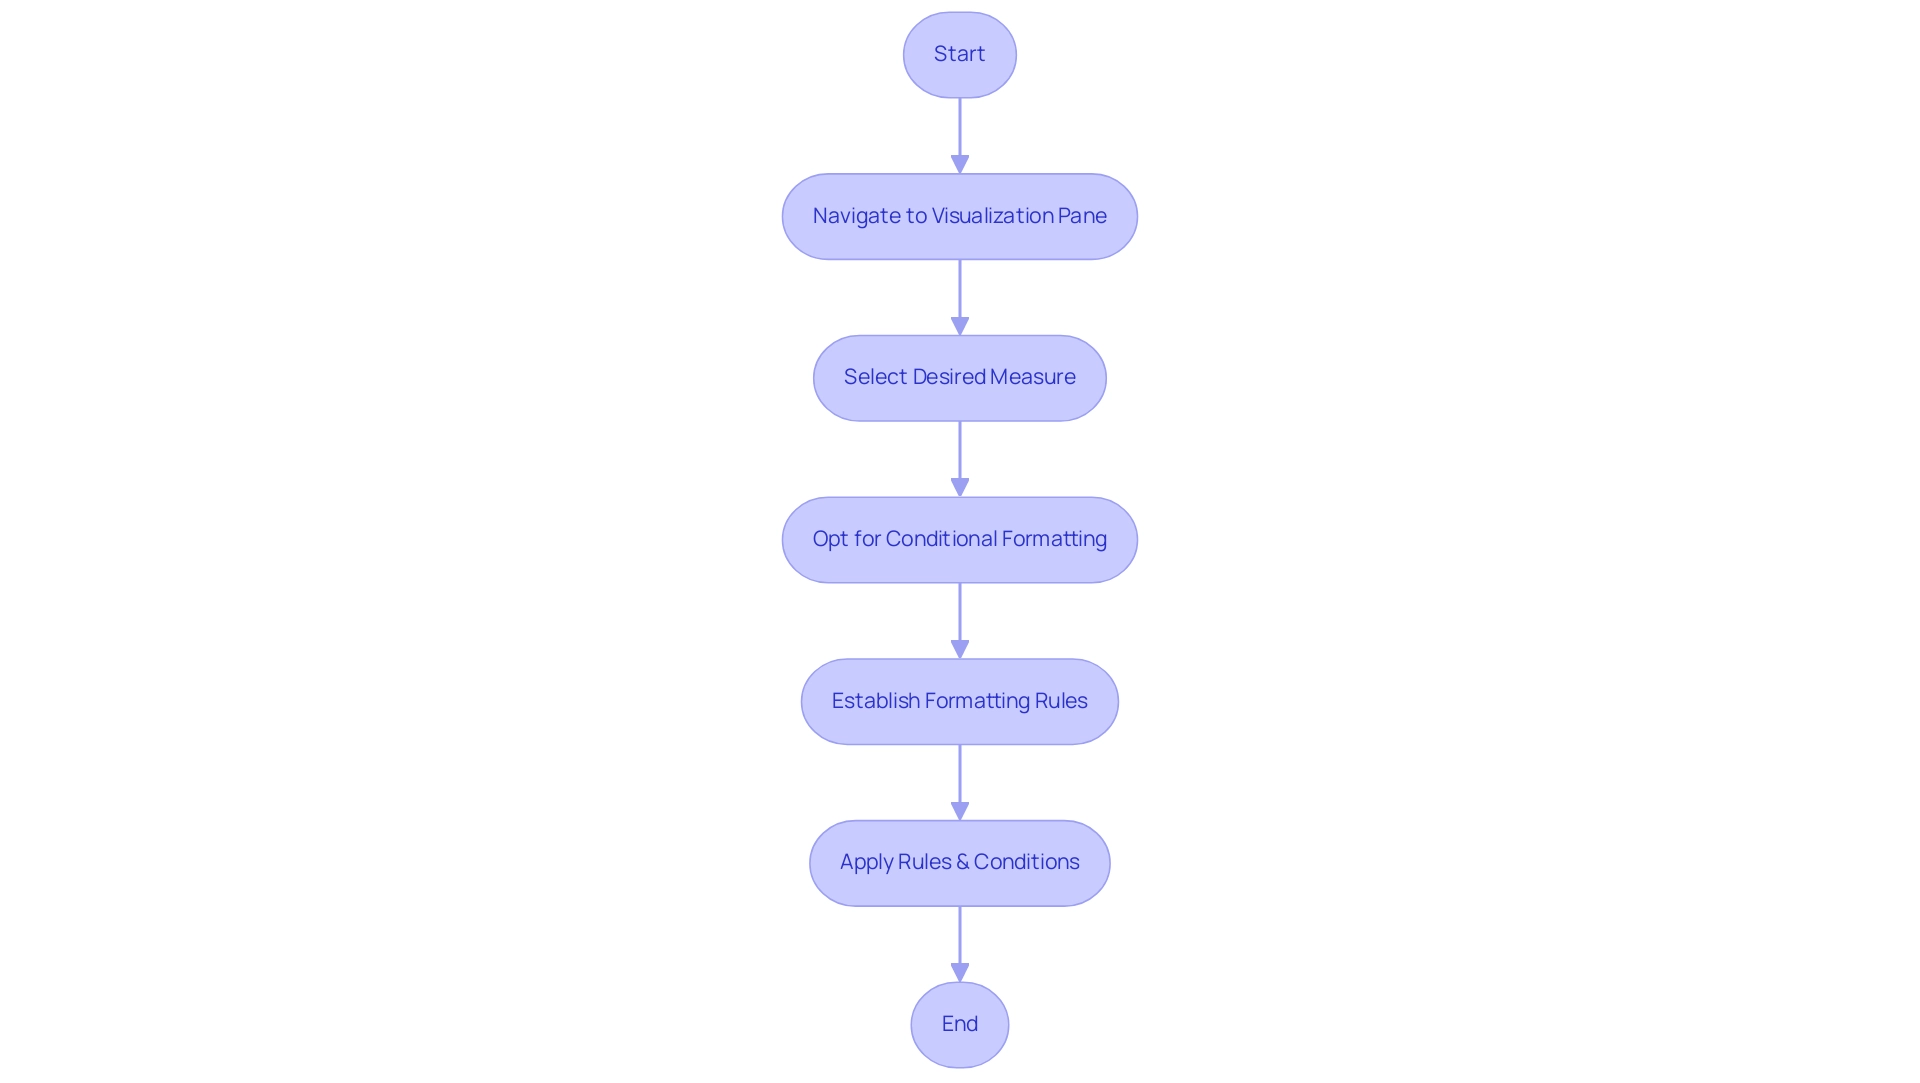
Troubleshooting Common Issues in DAX Percentage Calculations
Common issues in DAX format percentage calculations frequently arise from improper measure definitions or a lack of understanding regarding context. One prevalent error involves selecting an incorrect aggregation type, which can yield misleading results. To ensure accuracy, it is crucial to verify that measures are calculated within the appropriate context by examining the filters applied in your reports.
This challenge reflects the broader issue of leveraging insights from Power BI dashboards, where time-consuming report creation and inconsistencies can hinder effective decision-making. A relevant case study illustrates this point: when adding the estimated remaining mandays measure to a table visualization, projects with missing data disappeared, highlighting how adding a measure creates an automatic context filter that can filter out rows where the measure is blank. Another significant challenge is the risk of division by zero, a scenario that can be effectively managed by utilizing the DIVIDE operation.
This function not only prevents errors but also enhances clarity in computations, echoing the efficiency improvements offered by RPA solutions like EMMA RPA and Power Automate, which automate repetitive tasks and streamline operations. If you face unexpected outcomes, utilizing the ‘Evaluate’ feature in DAX Studio can be invaluable; it enables you to examine intermediate values step by step, assisting in identifying where computations may be faltering. To further enhance clarity, consider adding descriptions in the modeling view, providing additional context about your measures.
As Mohan Raju, DM at CorroHealth, noted, ‘Thank you for sharing, this is helpful!’ By addressing these common pitfalls with diligence and employing the right tools, you can significantly enhance the reliability of your assessments in DAX format percentage, ultimately driving data-driven insights and operational efficiency for business growth. Neglecting these issues could place your business at a competitive disadvantage, underscoring the importance of leveraging Business Intelligence effectively.
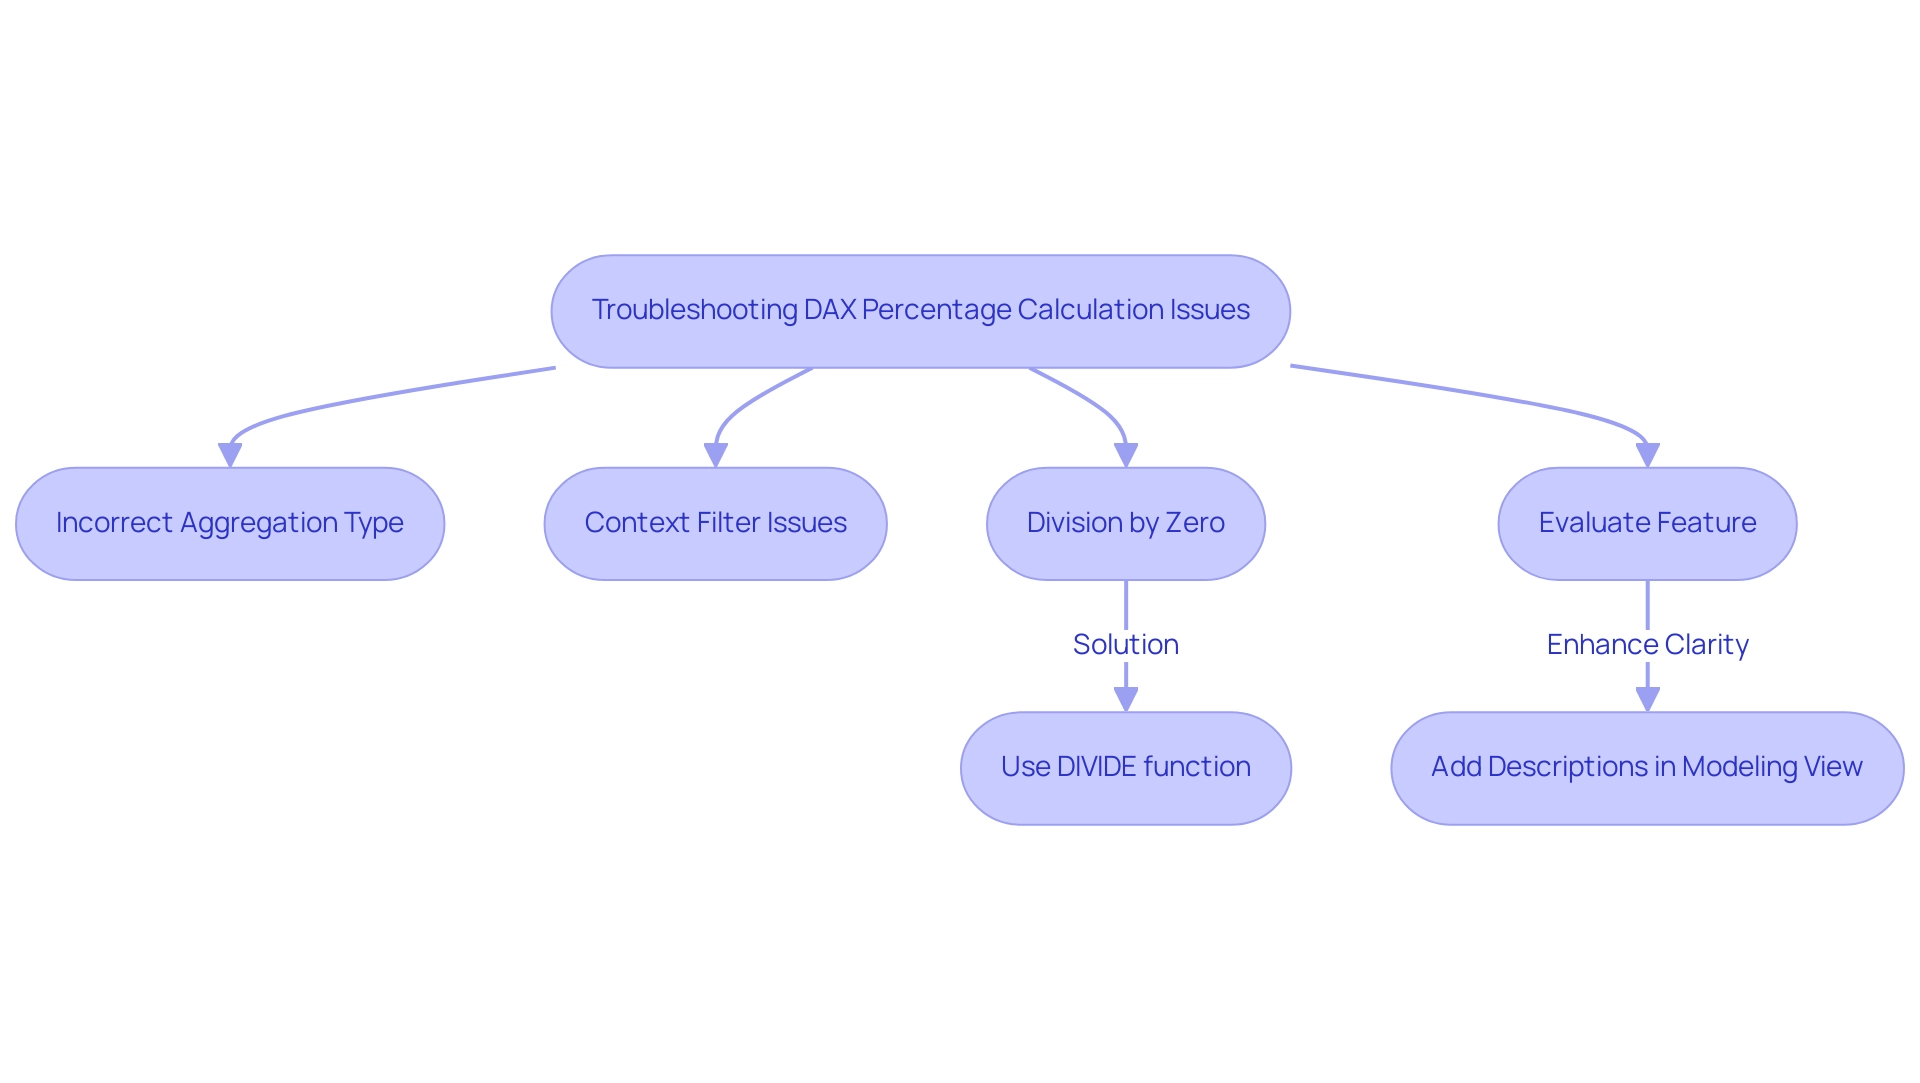
Advanced Techniques for Complex Percentage Calculations in DAX
For advanced computations in dax format percentage, utilizing the CALCULATE method along with context transition is vital. For example, when determining the dax format percentage of total sales by product category, the following formula can be used:
sales percentage by category = DIVIDE(SUM(Sales[SalesAmount]), CALCULATE(SUM(Sales[SalesAmount]), ALL(Sales[Category]))).
This formula effectively computes the sales in dax format percentage for each category against the overall total sales, irrespective of any filters applied, allowing for a clearer analysis that enhances operational efficiency.
It is important to note that you can nest up to 64 levels of functions in calculated columns, showcasing the complexity and capability of DAX formulas. Furthermore, to streamline complex computations, employing variables with the VAR keyword can significantly enhance both the readability and performance of your measures. For instance, by defining a variable for total sales within a measure, such as
VAR TotalSales = SUM(Sales[Sales Amount]),
you simplify the process of computing.
Integrating RPA solutions can further automate these data-driven processes, reducing manual workloads and enabling your team to focus on strategic initiatives. For example, automating the extraction and processing of sales information through RPA can ensure that your DAX calculations are performed on the most up-to-date details, thereby improving accuracy and efficiency. Additionally, referring to tables and columns in DAX formulas using fully qualified names, as illustrated in a relevant case study, ensures clarity and prevents errors in formula evaluation, reinforcing the importance of Business Intelligence in driving growth.
These advanced techniques not only facilitate nuanced analysis but also empower you to extract deeper insights from your data, optimizing your operational efficiency.
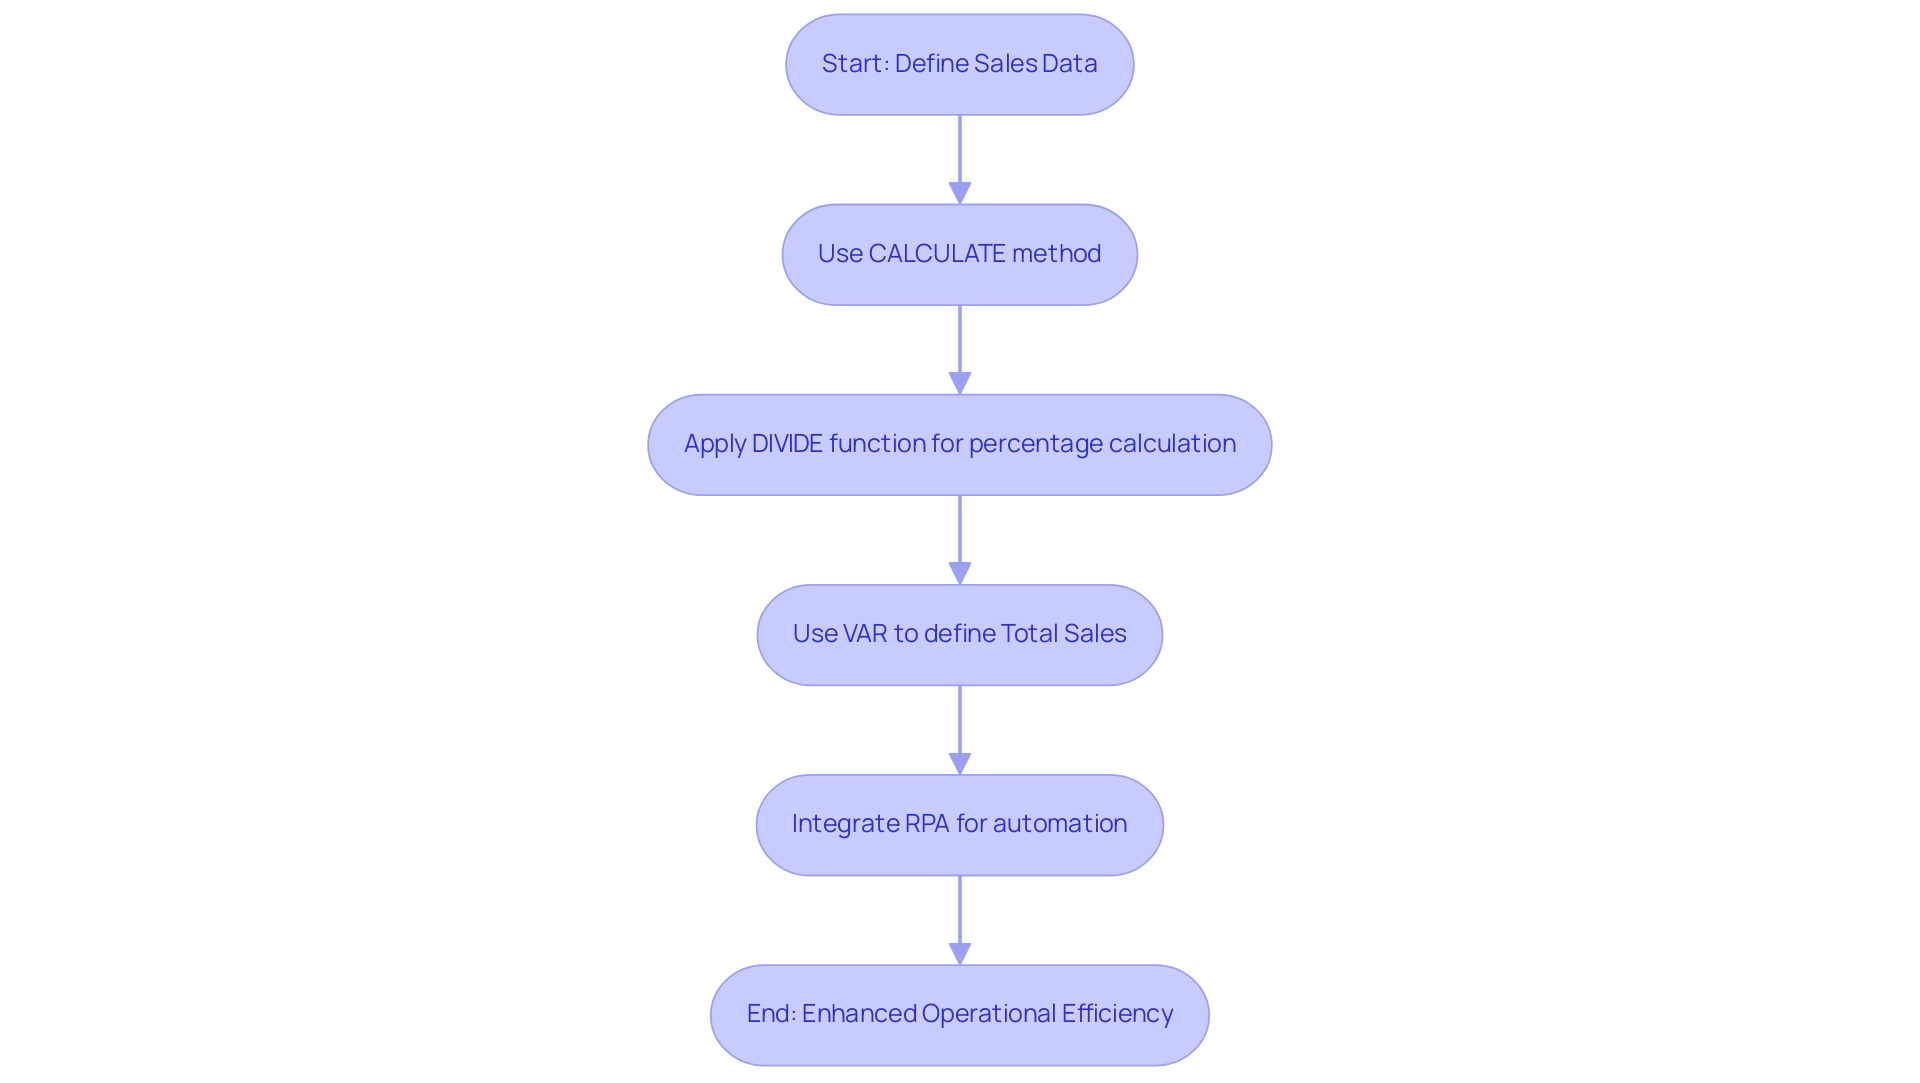
Conclusion
Mastering DAX for percentage calculations is not just a technical necessity; it is a strategic advantage that can significantly enhance data-driven decision-making. By understanding the foundational principles of DAX, including the effective use of functions like DIVIDE and SUMX, organizations can transform raw data into actionable insights. This knowledge empowers users to tackle common challenges such as data inconsistencies and time-consuming report creation, ultimately leading to improved operational efficiency.
Moreover, implementing practical techniques such as conditional formatting and RPA integration further enriches the analytical process. These tools not only provide clarity in data presentation but also streamline workflows, allowing teams to focus on strategic initiatives rather than repetitive tasks. The case studies highlighted throughout the article illustrate how adopting these practices can lead to more accurate calculations and better communication of insights.
In conclusion, leveraging DAX effectively is crucial for organizations seeking to harness the full potential of their data. By committing to continuous learning and application of advanced techniques, businesses can not only overcome obstacles but also drive growth and success in a competitive landscape. Embracing these strategies positions organizations to maximize their operational efficiency and achieve their goals with confidence.
Introduction
In the realm of data analysis, the ability to manage and interpret blank values can significantly influence the quality of insights derived from datasets. The ISBLANK function in DAX emerges as an essential tool for data professionals, enabling them to identify and address gaps that could compromise data integrity. By understanding how to effectively utilize ISBLANK, analysts can refine their data models, make informed decisions, and enhance operational efficiency. This article delves into the intricacies of the ISBLANK function, offering practical examples, troubleshooting tips, and advanced techniques that empower organizations to harness the full potential of their data. As businesses increasingly rely on accurate data for strategic decision-making, mastering these concepts becomes crucial for achieving success in today’s competitive landscape.
Understanding the ISBLANK Function in DAX
The DAX function if isblank serves a critical purpose by determining whether a value is blank or empty, returning TRUE for blank values and FALSE otherwise. This foundational tool is essential for analysts aiming to manage and manipulate sets effectively. For instance, in scenarios where a column may contain null values, using a function to check for blanks enables the identification of these gaps, facilitating informed decisions such as filtering out incomplete data or substituting missing values with defaults.
The syntax is straightforward: function(value), with ‘value’ representing the expression to evaluate. Mastering the dax if isblank function for identifying empty values is a crucial step toward creating strong DAX expressions that skillfully manage empty entries. In today’s information-driven landscape, addressing blank values is vital for maintaining integrity and ensuring analytical accuracy, ultimately enhancing the quality of insights derived from your datasets.
Significantly, top-performing firms are 30% more likely to possess a dedicated information catalog, highlighting the importance of effective information management practices associated with empty values. Moreover, organizations face challenges due to poor master information quality and barriers to AI adoption, as highlighted by Welch C., emphasizing the need for improved information quality management:
- ‘Evaluation of two-fold fully conditional specification multiple imputation for longitudinal electronic health record information.’
The possible outcomes of overlooking information quality are illustrated by NASA’s loss of the Mars Climate Orbiter because of format inconsistencies, emphasizing the essential function of the blank-check feature in maintaining information quality and integrity while promoting operational efficiency and business growth.
Additionally, utilizing RPA solutions like EMMA RPA and Power Automate can streamline data management processes, further mitigating the risks associated with poor data quality.
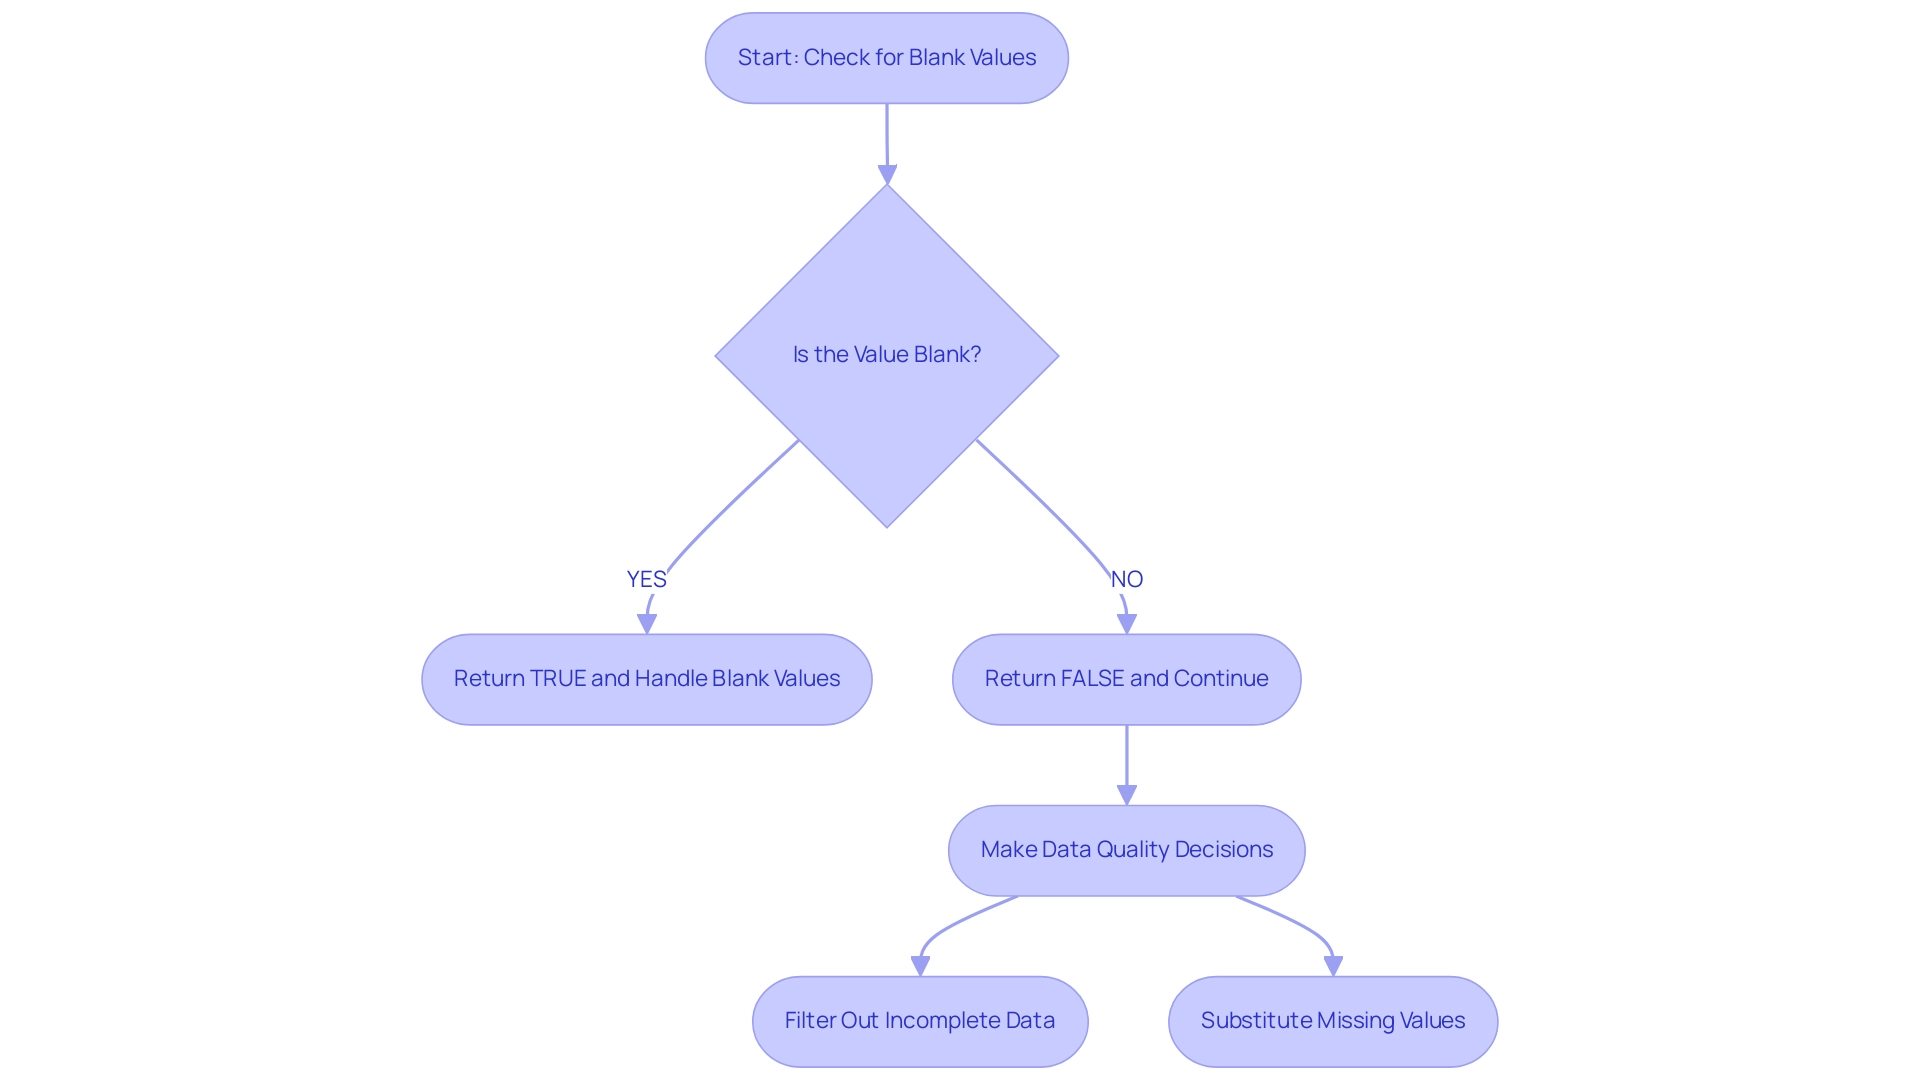
Using IF with ISBLANK: Practical Examples and Scenarios
Employing the IF function alongside the DAX ISBLANK check enables you to efficiently handle empty values within your datasets, improving clarity and insight, which is essential for making data-driven choices in today’s competitive environment. For example, when assessing sales performance, you might want to indicate ‘No Sales’ when the sales value is empty. The following DAX expression accomplishes this:
DAX

Sales Status = IF(ISBLANK(Sales[Total Sales]), "No Sales", "Sales Recorded")
In this instance, the formula checks the ‘Total Sales’ field. If it is discovered to be empty, it returns ‘No Sales’; otherwise, it confirms that sales have indeed been recorded. This method not only refines your data representation but also empowers you to make informed decisions based on complete datasets, addressing the challenges posed by poor master data quality.
Another practical example involves calculating a discount only when the price is available:
DAX

Discounted Price = IF(ISBLANK(Products[Price]), 0, Products[Price] * 0.9)
In this case, if the price is blank, the discounted price is set to 0, ensuring that your calculations remain both accurate and meaningful.
Additionally, consider the case study titled ‘Customer Measures for Blank Names’, where two measures are defined to count customers with empty names and blank names in a dataset, employing the function that checks for blankness. This real-world application demonstrates the effectiveness of DAX ISBLANK in ensuring completeness and highlights the importance of leveraging insights from Power BI dashboards. By incorporating such DAX expressions, specifically DAX ISBLANK, into your analysis, you can significantly enhance information interpretation and operational efficiency.
Moreover, integrating RPA tools like EMMA RPA and Power Automate can further streamline the process of information handling and reporting, helping to automate repetitive tasks and enhance overall operational efficiency. Research has indicated that using DAX functions such as IF can result in a significant enhancement in information representation, aiding improved decision-making and addressing obstacles to AI adoption. Addressing challenges such as time-consuming report creation and data inconsistencies is essential for maximizing the benefits of Business Intelligence solutions.
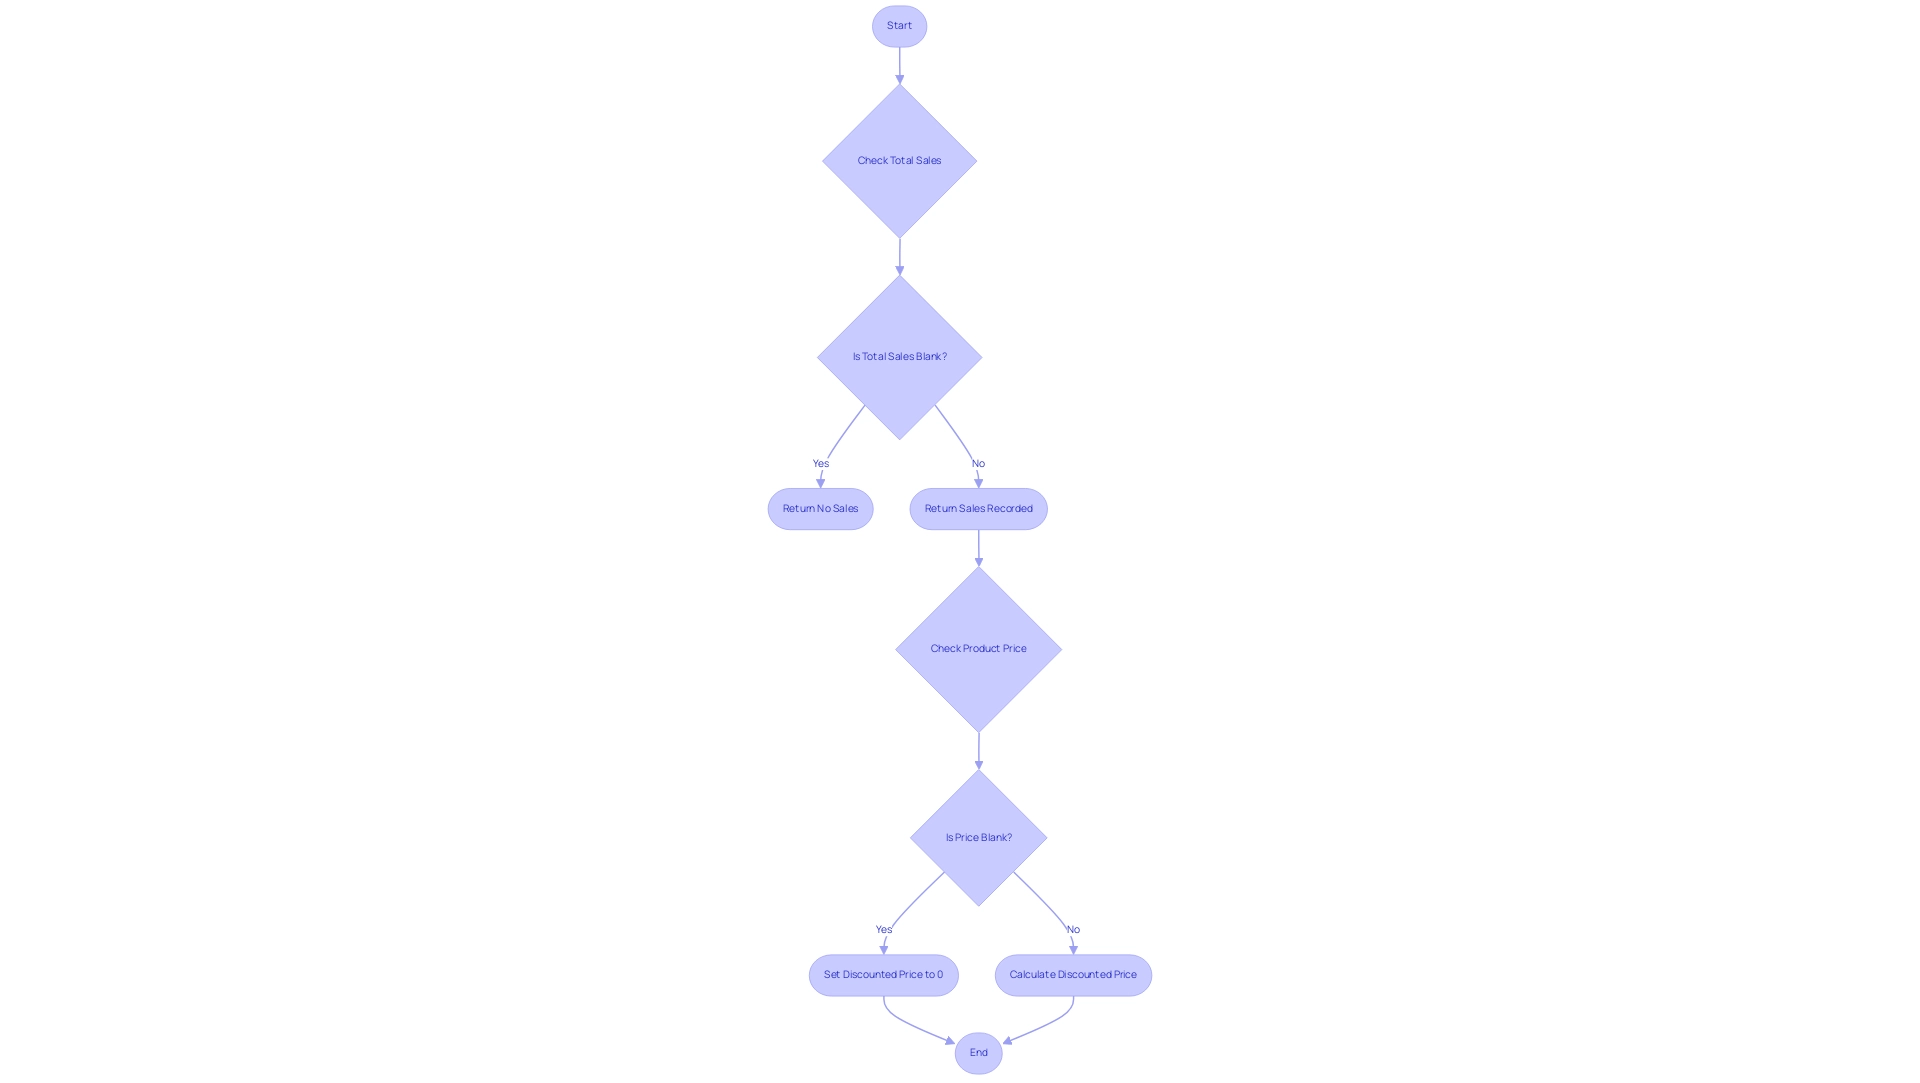
Troubleshooting Common Issues with ISBLANK in DAX
When using the DAX function dax if isblank, it’s essential to navigate several common issues that can impede your efficiency, especially in the context of Business Intelligence (BI) and Robotic Process Automation (RPA). A prevalent mistake involves overlooking proper syntax; always ensure you are using parentheses correctly to avoid unnecessary errors. Furthermore, many users misunderstand how DAX distinguishes between empty values and zeros—dax if isblank treats these as separate entities.
The function will return TRUE for an empty cell but FALSE for a zero, which can lead to unexpected results, particularly in time-consuming report creation. This misunderstanding is crucial since excessive use of empty cell functions in large datasets can slow down report performance, making careful usage imperative for maintaining operational efficiency. Moreover, it’s essential to understand that Excel considers empty values as zero, while PowerPivot regards them as empty.
If your checks for blank values using dax if isblank are not yielding anticipated outcomes, take a moment to verify the data type of the column in question. For example, if the column is designated as text, confirm that it is genuinely empty and free of spaces, as spaces are not recognized as blanks. Additionally, when utilizing dax if isblank within calculated columns, be mindful of the calculation’s context—this can significantly influence your results, especially when leveraging insights from Power BI dashboards.
A relevant case study highlights the importance of context in DAX calculations, particularly when calculating ratios in PivotTables. Adjustments made in this context ensure that calculations are performed at the cell level rather than the row level, leading to accurate measures that reflect the ratio of Internet Sales to Reseller Sales. By understanding these common pitfalls and the importance of context, you can troubleshoot more effectively and enhance your DAX expressions, ensuring your reports perform optimally.
Moreover, integrating RPA solutions such as EMMA RPA and Power Automate can further streamline your information processing tasks, allowing for more efficient report generation and enhanced operational efficiency. As Bill Pearson, a business intelligence architect, emphasizes, ‘The goal is to get you using DAX and PowerPivot quickly to provide actionable business intelligence in your own environment.’ With these insights, you can transform raw information into actionable insights that drive business growth and innovation.

Advanced Techniques for Optimizing ISBLANK Usage in DAX
To effectively optimize the usage of the function in DAX, leverage it alongside other functions to bolster your data models significantly, thereby enhancing your Business Intelligence capabilities. For example, integrating the absence check within the context of CALCULATE can simplify dataset filtering, removing the necessity to verify for empty values separately. An effective expression could look like this:
DAX

Filtered Sales = CALCULATE(SUM(Sales[Total Sales]), NOT(ISNULL(Sales[Total Sales])))
This expression efficiently sums only those total sales that are not empty, enhancing performance by filtering out unnecessary calculations. Furthermore, integrating DAX if isblank with logical functions such as SWITCH or nested IF statements can accommodate more complex scenarios, ultimately leading to more powerful DAX expressions. Consistently reviewing and refactoring your DAX code to integrate these advanced techniques promotes substantial enhancements in reporting and analytical workflows—essential for addressing obstacles such as time-consuming report creation and inconsistencies.
Additionally, utilizing Robotic Process Automation (RPA) can further streamline workflows by automating repetitive tasks related to preparation and report generation, allowing your team to concentrate on strategic analysis. Customized AI solutions can also contribute to recognizing patterns and insights within your information, enhancing decision-making capabilities. As highlighted in the context of optimizing DAX queries, there are 21 ways to enhance your DAX expressions, which can significantly impact your BI projects.
Acknowledging diverse perspectives and ideas is crucial for successful BI initiatives, as collaboration can lead to more effective solutions. Additionally, advanced DAX techniques, including Time Intelligence functions and iterator functions like SUMX and AVERAGEX, can illustrate the application of DAX if isblank in complex scenarios. This ongoing commitment to optimization not only sharpens your DAX skills but also aligns with the latest trends in DAX performance enhancement, ensuring your data models remain both precise and efficient.
Stay tuned for Part 2 where I will cover more optimizations and discuss the dangers of over-optimization!
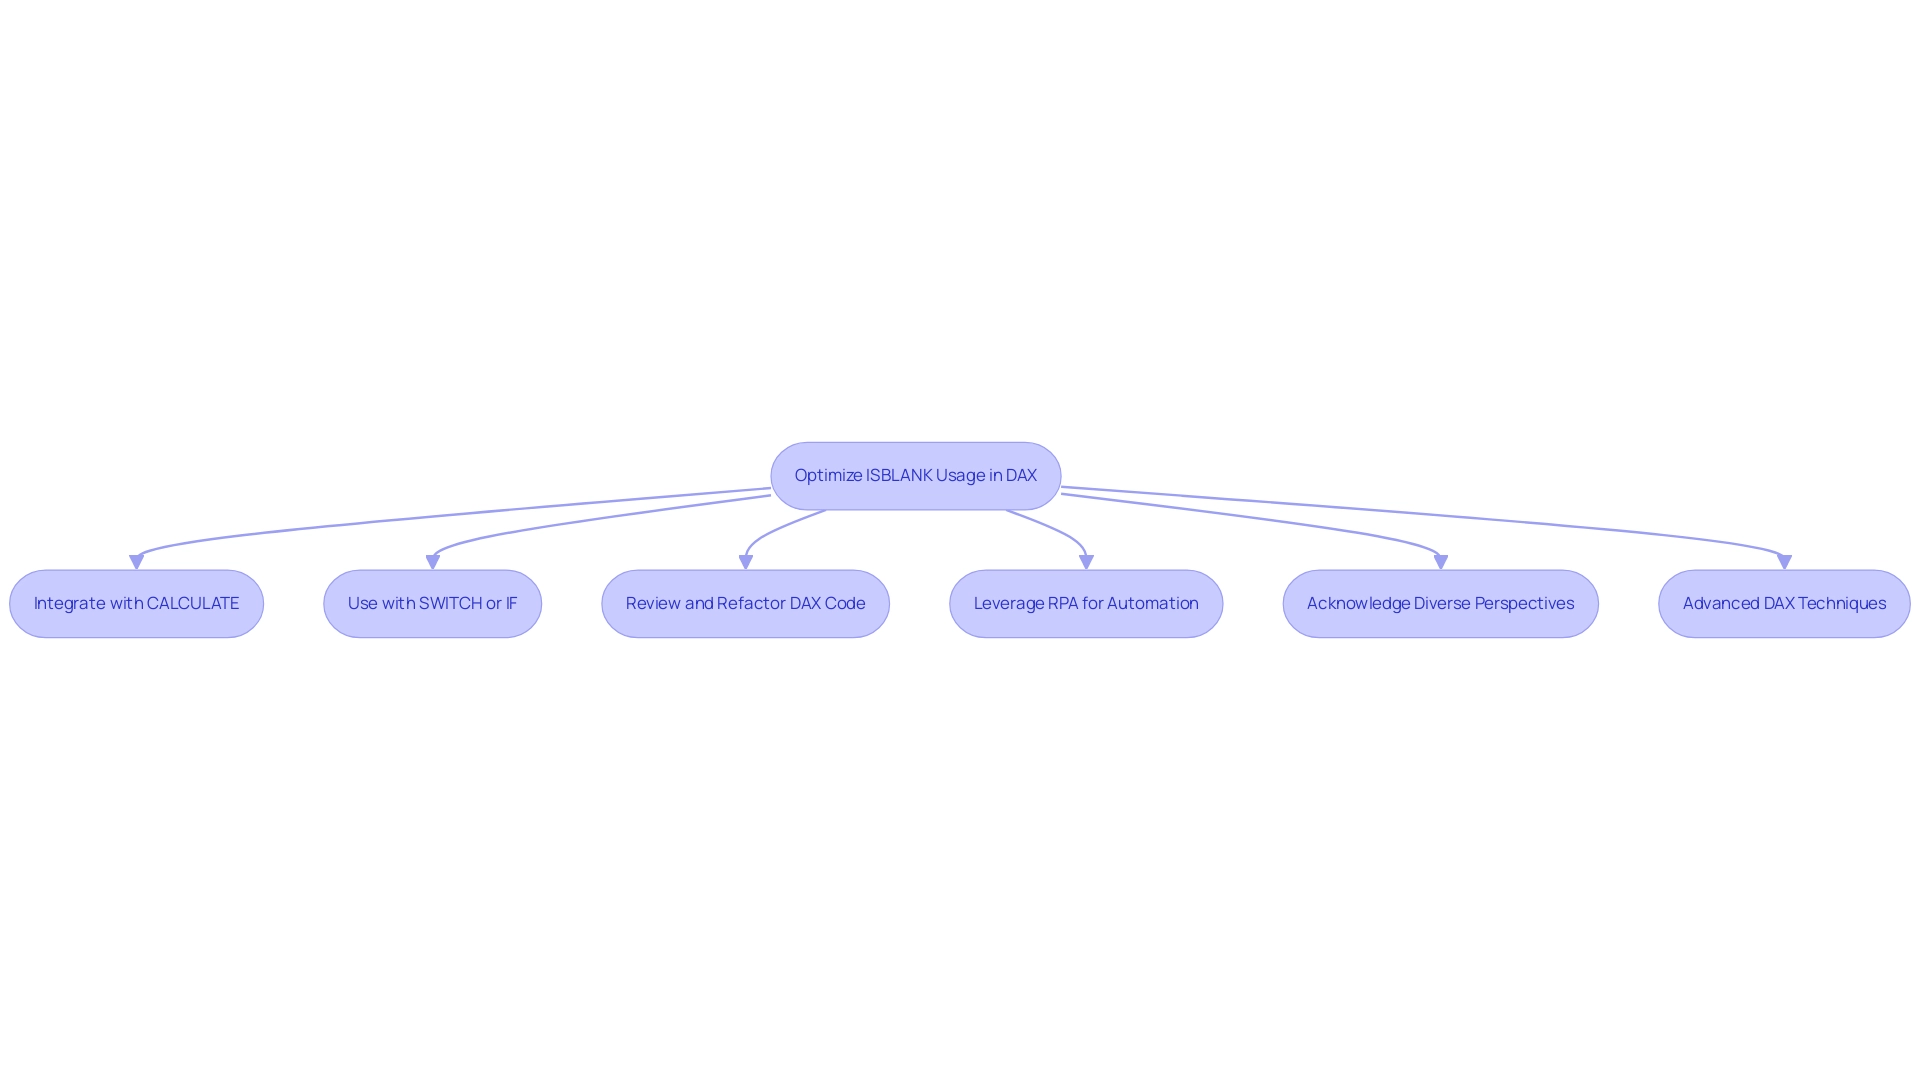
Conclusion
Effectively managing blank values within data sets is not merely a technical necessity; it is a strategic imperative for any organization aiming to thrive in today’s data-centric landscape. The ISBLANK function in DAX serves as a powerful tool, allowing analysts to identify and address these gaps, ultimately enhancing data integrity and the quality of insights generated. By mastering ISBLANK, alongside advanced techniques and practical applications, data professionals can significantly refine their analyses and improve operational efficiency.
Utilizing ISBLANK in conjunction with other DAX functions empowers organizations to build robust data models that facilitate informed decision-making. Whether through straightforward implementations like using IF statements or more complex applications within CALCULATE, the versatility of ISBLANK enables analysts to tailor solutions that meet specific business challenges. Furthermore, recognizing common pitfalls and implementing best practices ensures that the use of ISBLANK contributes positively to overall data management efforts.
As data quality remains a cornerstone of successful business intelligence initiatives, investing time in understanding and optimizing the use of the ISBLANK function will yield substantial benefits. By embracing these practices, organizations can not only enhance their analytical capabilities but also foster a culture of data-driven decision-making that propels them toward operational excellence. The journey to effective data management starts with mastering these essential tools, paving the way for greater insights and business growth.
