Introduction
In the realm of data analysis, linear regression stands as a cornerstone technique, providing invaluable insights into the relationships between variables. As organizations increasingly rely on data-driven decision-making, understanding how to effectively implement and interpret linear regression models is essential for operational success.
This article delves into the foundational aspects of linear regression, from creating accurate trendlines to exploring various models and the critical role of data preprocessing. By integrating these statistical methods with Robotic Process Automation (RPA), businesses can streamline their workflows, reduce manual errors, and empower their teams to focus on strategic initiatives.
With practical steps and real-world applications, this guide equips professionals with the tools needed to enhance their analytical capabilities and drive efficiency in a rapidly evolving landscape.
Understanding Linear Regression: The Foundation of Trendlines
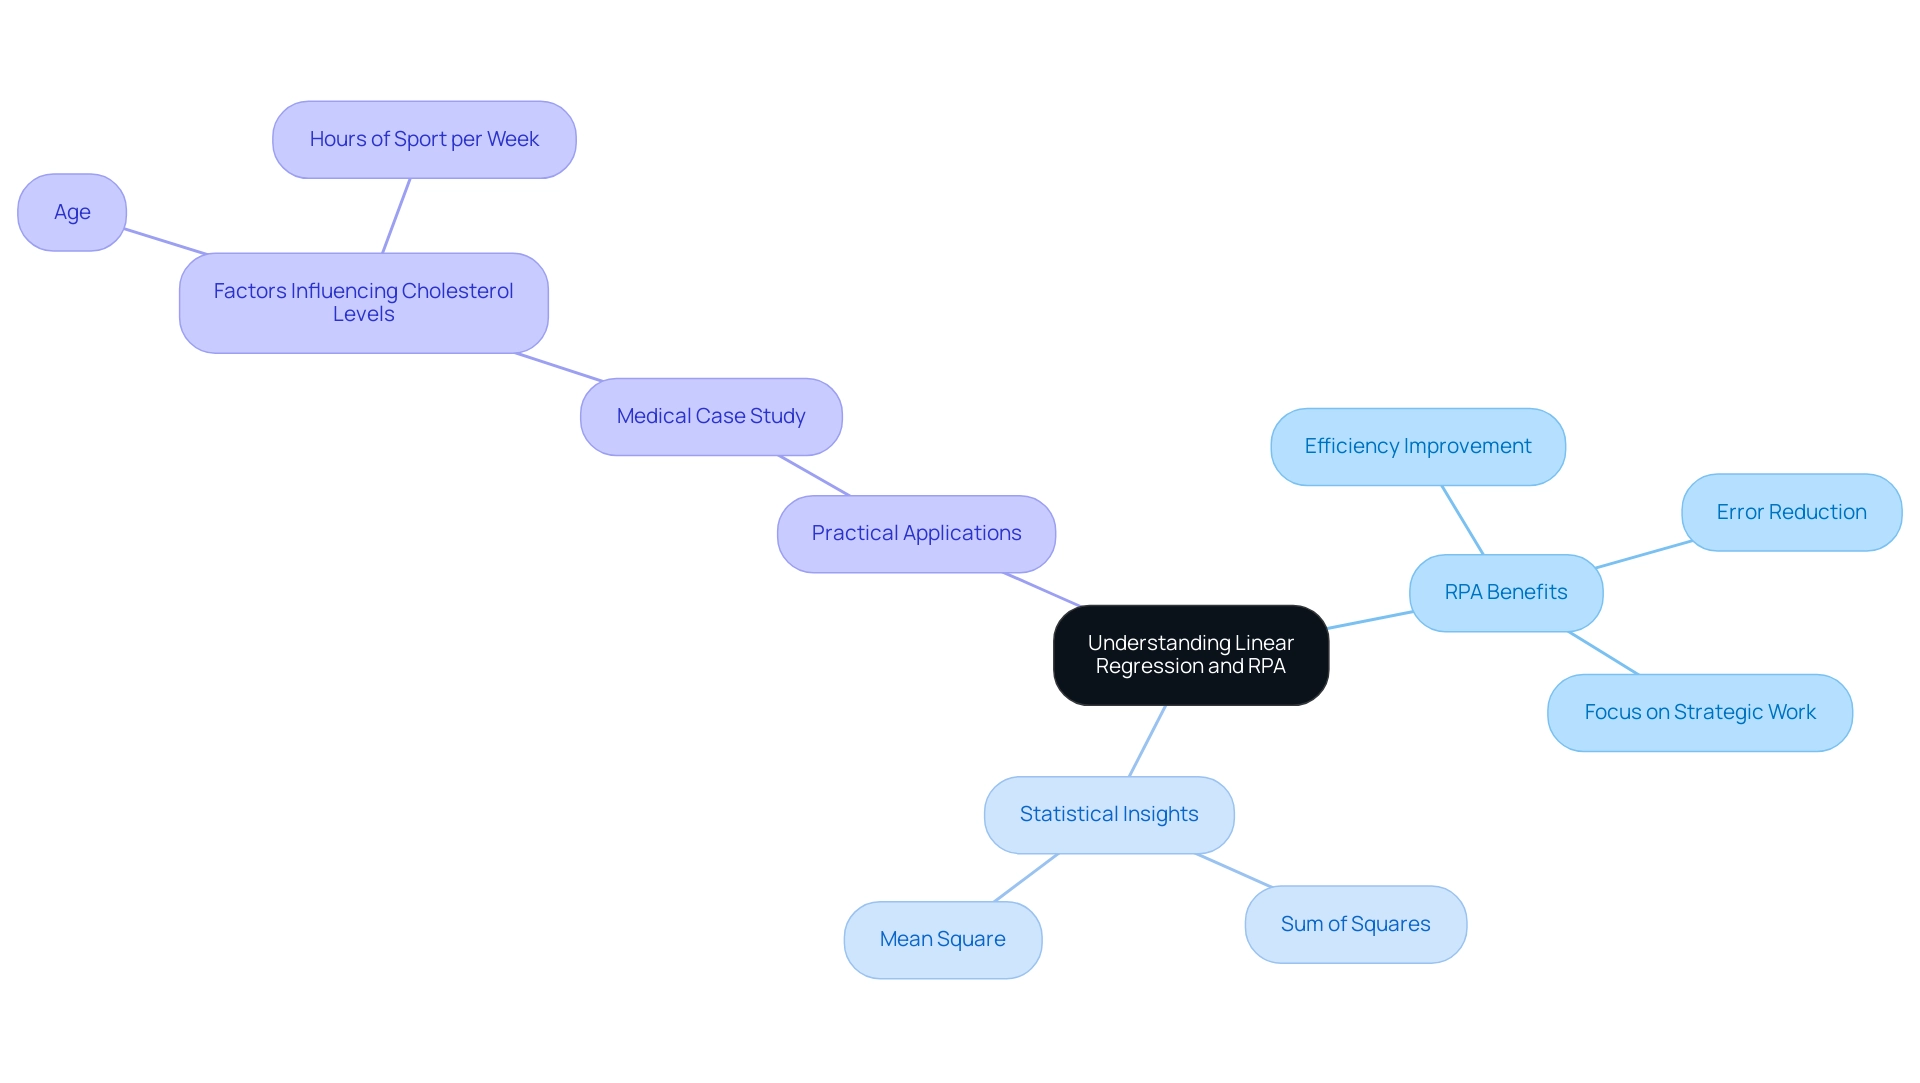
Linear regression is an essential statistical method that models the relationship between a dependent variable and one or more independent variables. This technique is invaluable for predicting outcomes and identifying trends within information, which can be further enhanced by leveraging Robotic Process Automation (RPA) to automate manual workflows. RPA can enhance efficiency by:
- Decreasing the time spent on repetitive information entry tasks
- Minimizing errors linked with manual calculations
- Freeing up your team for more strategic, value-adding work
Understanding linear analysis is pivotal, as it serves as the foundation for developing a linear regression trendline—visual representations that elucidate the relationships in datasets. A linear regression trendline is essentially the best-fit line, meticulously calculated to minimize the distances between observed values and the line itself. This process not only highlights the underlying trends but also improves interpretation.
Recent statistics indicate that the residuals from linear models show a Sum of Squares of 1.1810e+10 and a Mean Square of 454222144, underscoring the model’s effectiveness in capturing variability. Furthermore, results can be visually represented using a scatter plot, which is an effective way to illustrate the relationship between variables. By integrating these data-driven insights with RPA solutions, you can streamline operations and make informed decisions that drive operational efficiency and enhance predictive modeling capabilities.
RPA can specifically enhance the workflow associated with linear analysis tasks by automating information gathering and processing, allowing for quicker examination and reporting. A practical application of linear analysis can be seen in a medical case study examining cholesterol levels, where factors such as age and hours of sport per week were analyzed to identify key determinants influencing cholesterol levels, aiding in health assessments. As Jim noted, ‘By adding M (mediator), it might be capturing some of the variance that was initially attributed to X.’
This interconnected approach empowers you to harness the full potential of both statistical analysis and automation, fostering business growth in a rapidly evolving AI landscape.
Step-by-Step Guide to Creating Linear Regression Trendlines
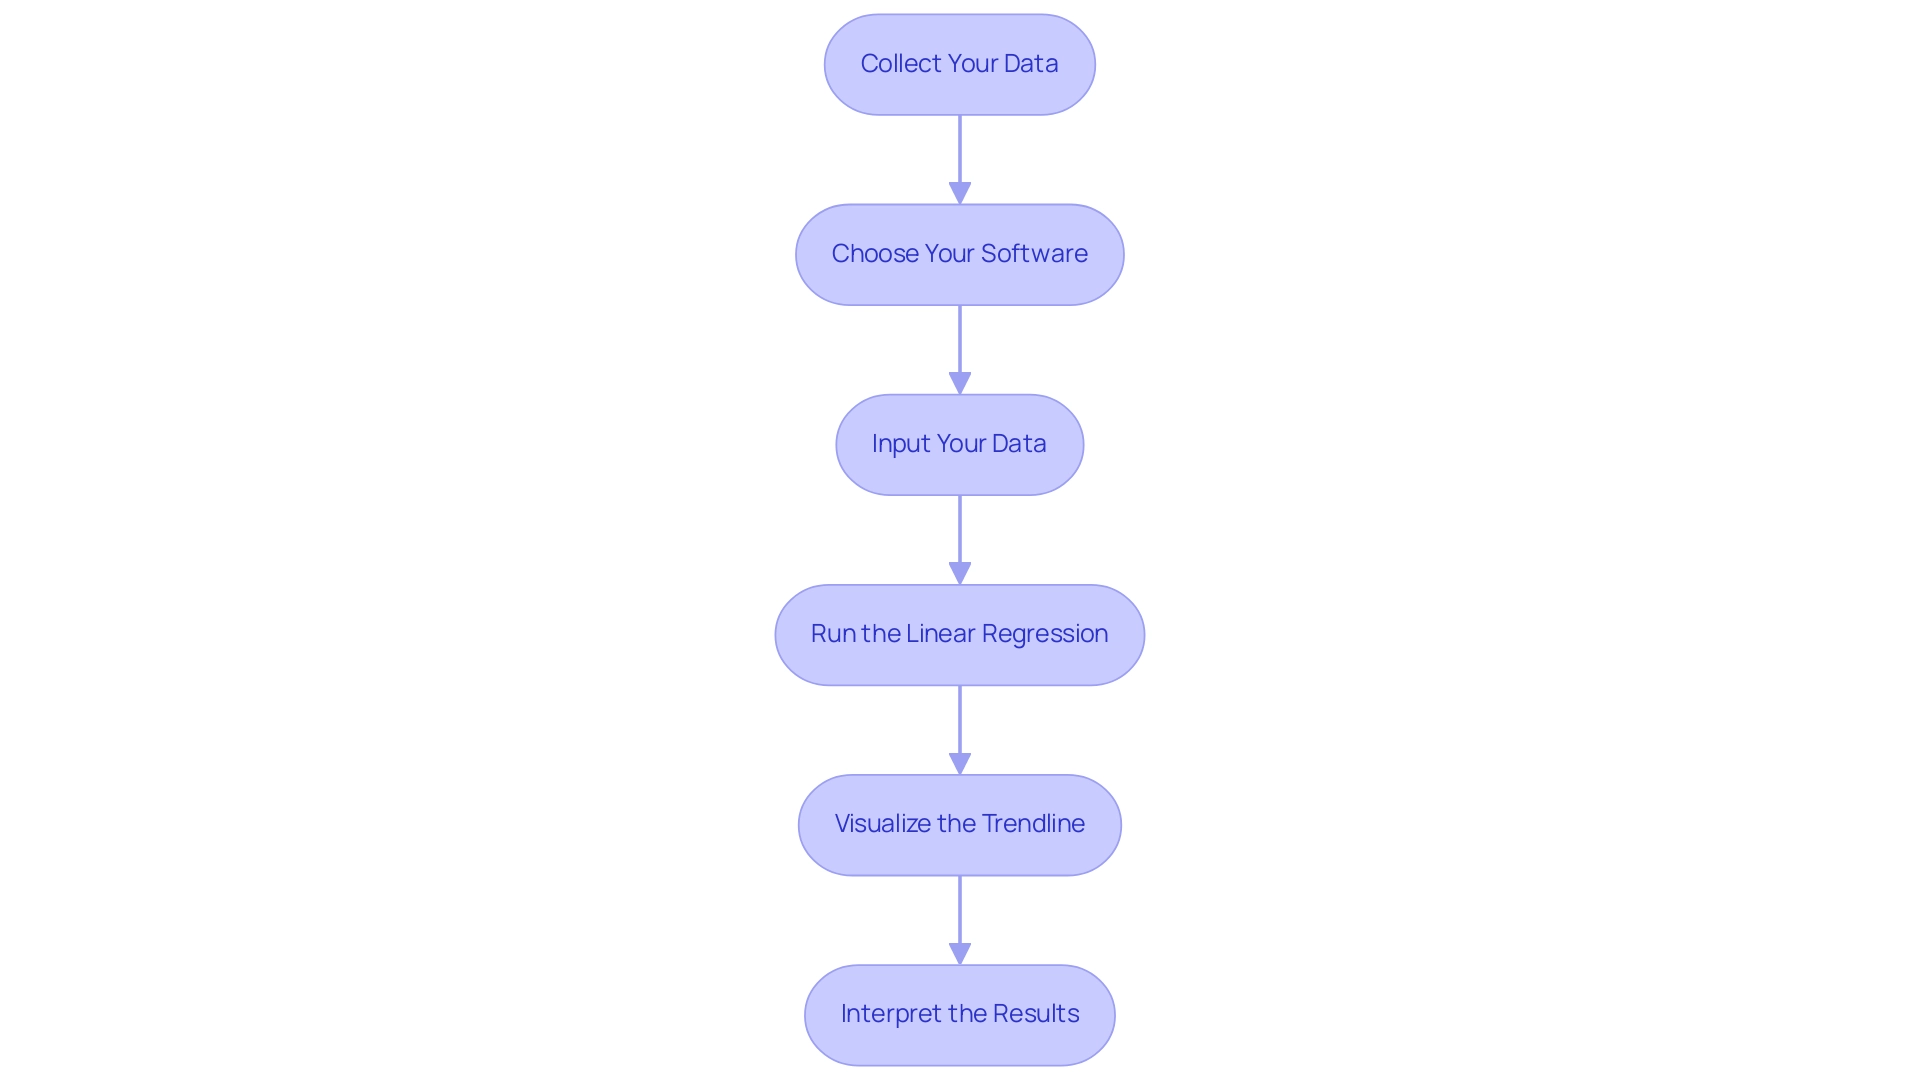
Creating a linear regression trendline involves a systematic approach that can significantly enhance your data analysis capabilities, particularly in the context of utilizing Business Intelligence and Robotic Process Automation for operational efficiency. Follow these detailed steps to ensure a successful implementation:
-
Collect Your Data: Begin with a dataset that features a well-defined dependent variable—the outcome you aim to predict—and one or more independent variables that influence this outcome. This foundational step is critical for accurate analysis and aligns with the need for data-driven insights.
-
Choose Your Software: Select suitable software tools for your analysis. Popular options include Excel, Python (utilizing libraries such as Pandas and Scikit-Learn), and R. Each of these platforms offers unique advantages for statistical analysis, enabling you to tailor your approach based on your operational needs.
-
Input Your Data: Import your dataset into your chosen software. For Excel, ensure your information is organized in columns, while in Python, you can load your dataset using Pandas for efficient handling—key for streamlining workflows through RPA.
-
Run the Linear Regression: In Excel, utilize the ‘Add Trendline’ feature after generating a scatter plot to create your linear regression representation. For Python users, utilize the
Linear Regressionclass from Scikit-Learn, which offers a strong framework for fitting your system to the information. Remember to consider how Lambda values, which can range from 0 to 1.0, may influence your system’s performance. -
Visualize the Trendline: Once your model is established, visualize the trendline alongside your information points. This step is crucial as it allows you to evaluate how well the trendline fits the information, making any patterns or discrepancies more apparent. As Joleen Bothma states, “Explore conditional formatting in Excel with simple to advanced examples and their best practices,” which can be particularly helpful when highlighting your trendline against the dataset.
-
Interpret the Results: Examine the analysis output to assess the connection between your elements. Pay particular attention to metrics such as the R-squared value, which quantifies how well your model explains the variability in the data. For instance, a correlation coefficient of approximately 0.65 indicates a moderate positive correlation, providing valuable insights into your dataset’s dynamics. Consulting the case study named ‘Interpreting Results of Analysis’ can further improve your comprehension, demonstrating different output elements such as statistics, ANOVA, and coefficients, assisting you in gaining insights into the strength of connections between factors.
By following these steps and utilizing the latest software tools, you can effectively create and interpret linear regression trendlines, harnessing the power of Business Intelligence and RPA to enhance your operational efficiency and decision-making processes. Additionally, consider exploring tailored AI solutions that can help identify the right technologies for your specific business needs, further reducing manual, repetitive tasks and optimizing your overall productivity.
Exploring Different Types of Linear Regression Models
Linear analysis includes different frameworks, each customized for particular data situations, allowing you to choose the most efficient method for your examination.
-
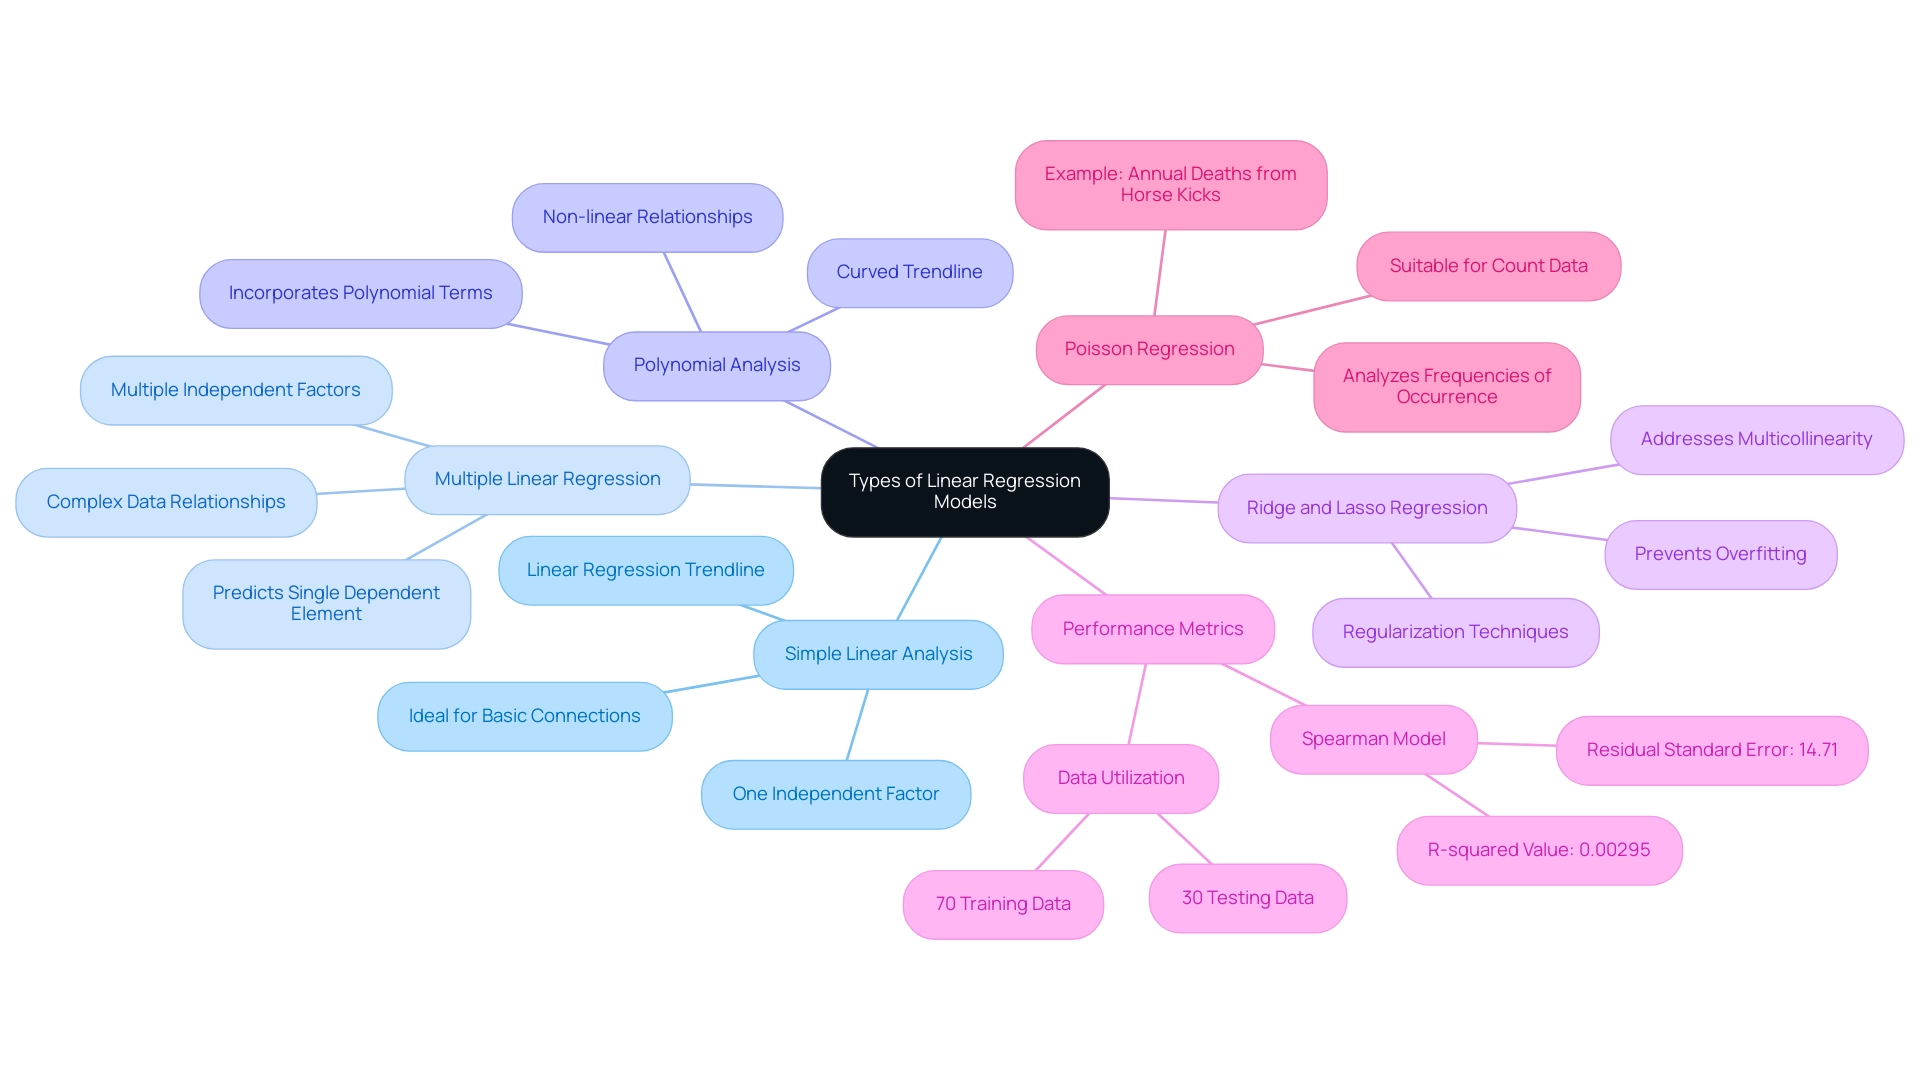
Simple Linear Analysis: This basic framework employs one independent factor to forecast a dependent factor. Its straightforward nature makes it ideal for examining fundamental connections between two factors using a linear regression trendline.
-
Multiple Linear Regression: In contrast, this approach incorporates several independent factors to predict a single dependent element. It is especially valuable when various elements together affect the result, enabling a more subtle comprehension of the data.
-
Polynomial Analysis: This approach improves linear analysis by incorporating polynomial terms, leading to a curved trendline. It becomes essential when the relationship between variables is non-linear, providing a more accurate representation of complex datasets.
-
Ridge and Lasso Regression: As regularization techniques, these approaches impose penalties on large coefficients, which is instrumental in preventing overfitting, especially in datasets with numerous predictors. They are especially efficient when addressing multicollinearity, enabling more trustworthy performance of the framework.
Grasping these frameworks is essential for choosing the suitable analysis method, such as utilizing a linear regression trendline, based on the traits of your information and your analytical goals. As mentioned by KAVITA, it is crucial to acknowledge the assumptions and possible drawbacks in linear analysis, such as overfitting and multicollinearity, which can greatly influence your analytical results.
In practice, it is important to recognize that 70% of the information is generally utilized for training, while 30% is set aside for testing, ensuring the effectiveness of the framework. The Spearman linear framework, for example, has a residual standard error of 14.71 and an R-squared value of 0.00295, indicating its performance metrics.
Moreover, Poisson analysis serves as a valuable example in the realm of statistical analysis. It is particularly suitable for count values that often follow the Poisson distribution, such as the analysis of annual deaths caused by horse kicks in the Prussian Army from 1875-1894. This case study illustrates how statistical models can be utilized in practical situations, offering insights into the frequencies of occurrence for count information.
The Role of Data Preprocessing in Linear Regression
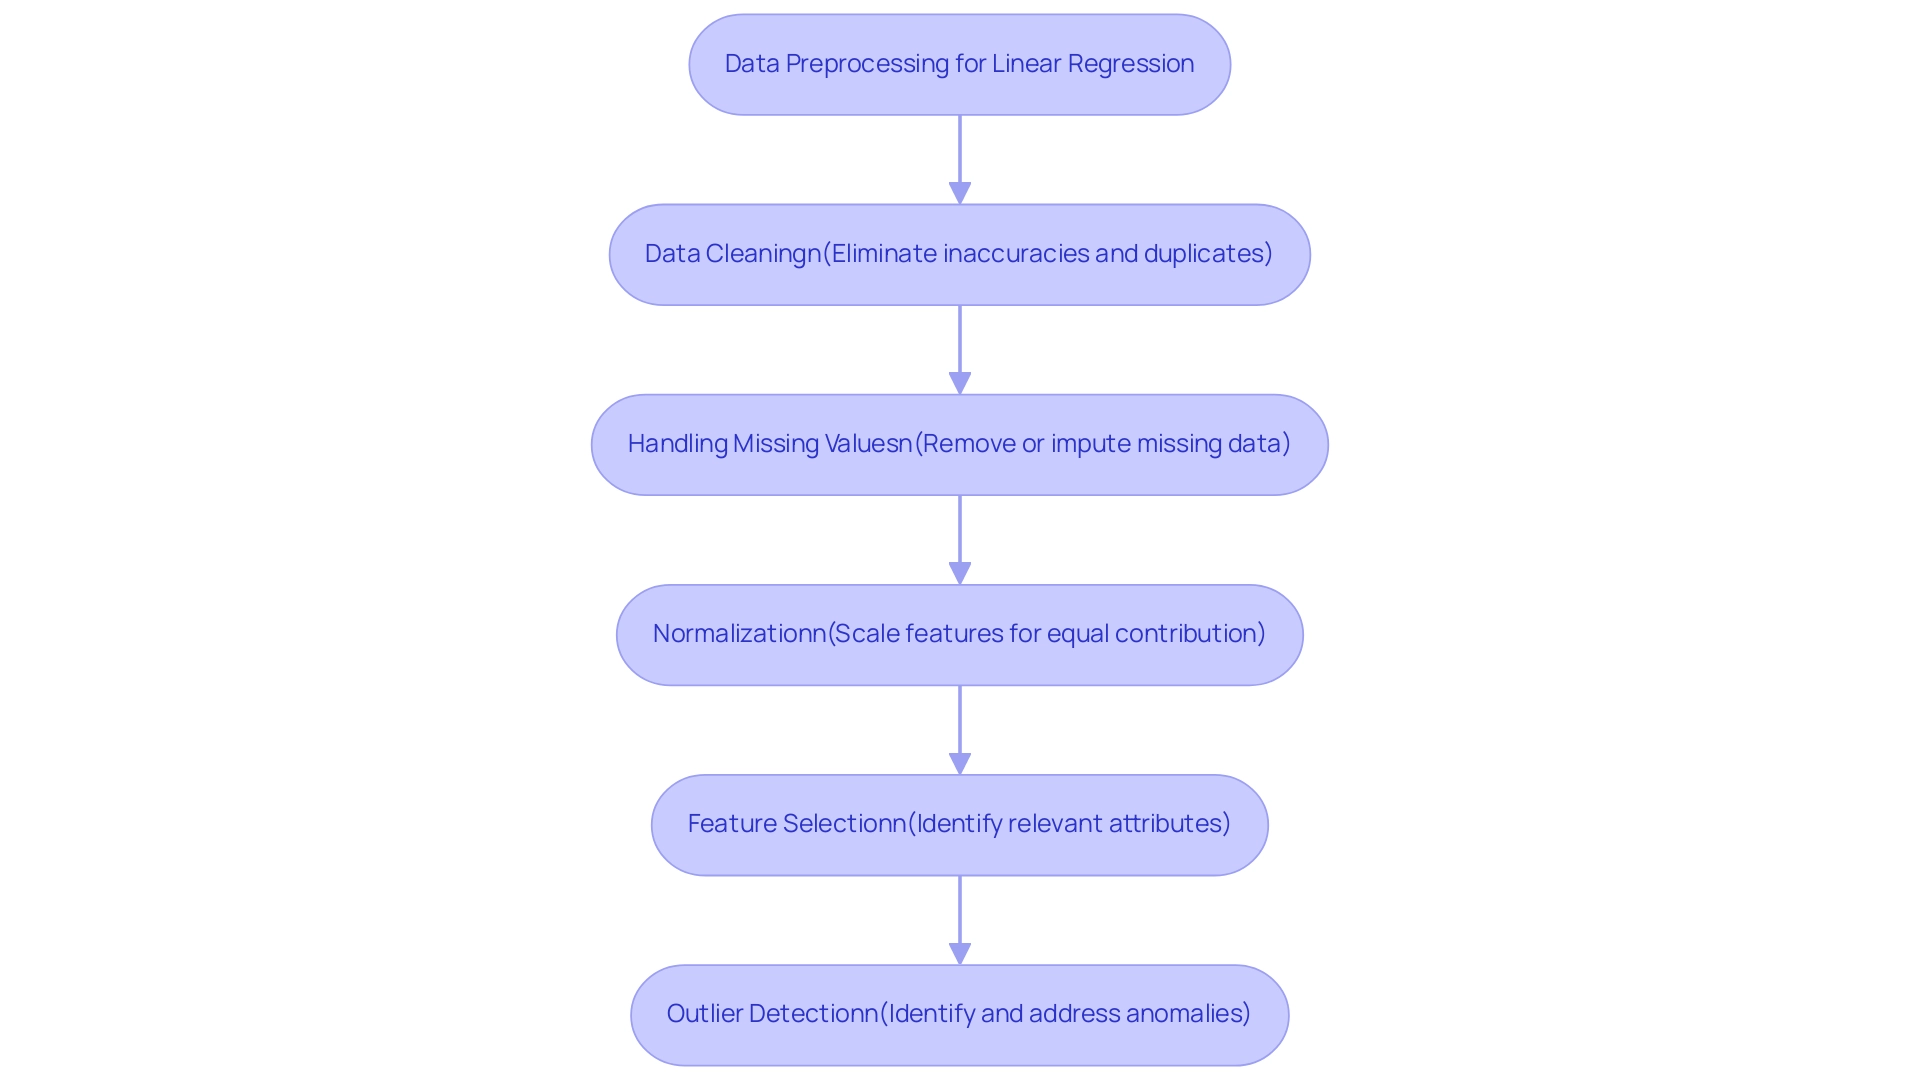
Data preprocessing is essential for preparing your dataset for the linear regression trendline analysis, enhancing both accuracy and reliability. Here are the key steps involved:
- Data Cleaning: Begin by eliminating inaccuracies or inconsistencies in your dataset. This involves eliminating duplicates and rectifying erroneous entries to ensure integrity.
- Handling Missing Values: It is crucial to address absent information effectively. Options include removing records with missing values or employing imputation techniques to fill in gaps based on existing data patterns. Recent statistics indicate that over 20% of datasets may contain missing values, underscoring the need for robust handling methods.
- Normalization: If your independent variables vary significantly in scale, applying normalization techniques is vital. This guarantees that all features contribute equally to the system’s performance. As highlighted in recent discussions, data normalization is required after splitting the dataset into test and train sets, and StandardScaler is a recommended tool for this purpose.
- Feature Selection: Concentrate on pinpointing the most pertinent attributes for your analysis. This step reduces complexity and enhances interpretability, leading to more effective modeling outcomes.
- Outlier Detection: Outliers can significantly skew your results. It’s important to identify and address these anomalies; depending on the context, you may choose to remove or adjust them to enhance robustness.
Furthermore, efficient information preprocessing can assist in resolving challenges associated with imbalanced datasets in predictive analysis, guaranteeing that the model operates effectively across all categories. By diligently following these preprocessing steps, you lay the groundwork for more accurate and reliable results of the linear regression trendline in your linear modeling analysis. As analytics science enthusiast Nagesh Singh Chauhan states, “Information preprocessing is the backbone of reliable analysis; engaging with experts can provide additional insights into best practices and emerging techniques in this area.”
Interacting with specialists can offer further perspectives on best practices and new methods in data preprocessing for linear analysis.
Evaluating the Effectiveness of Linear Regression Models
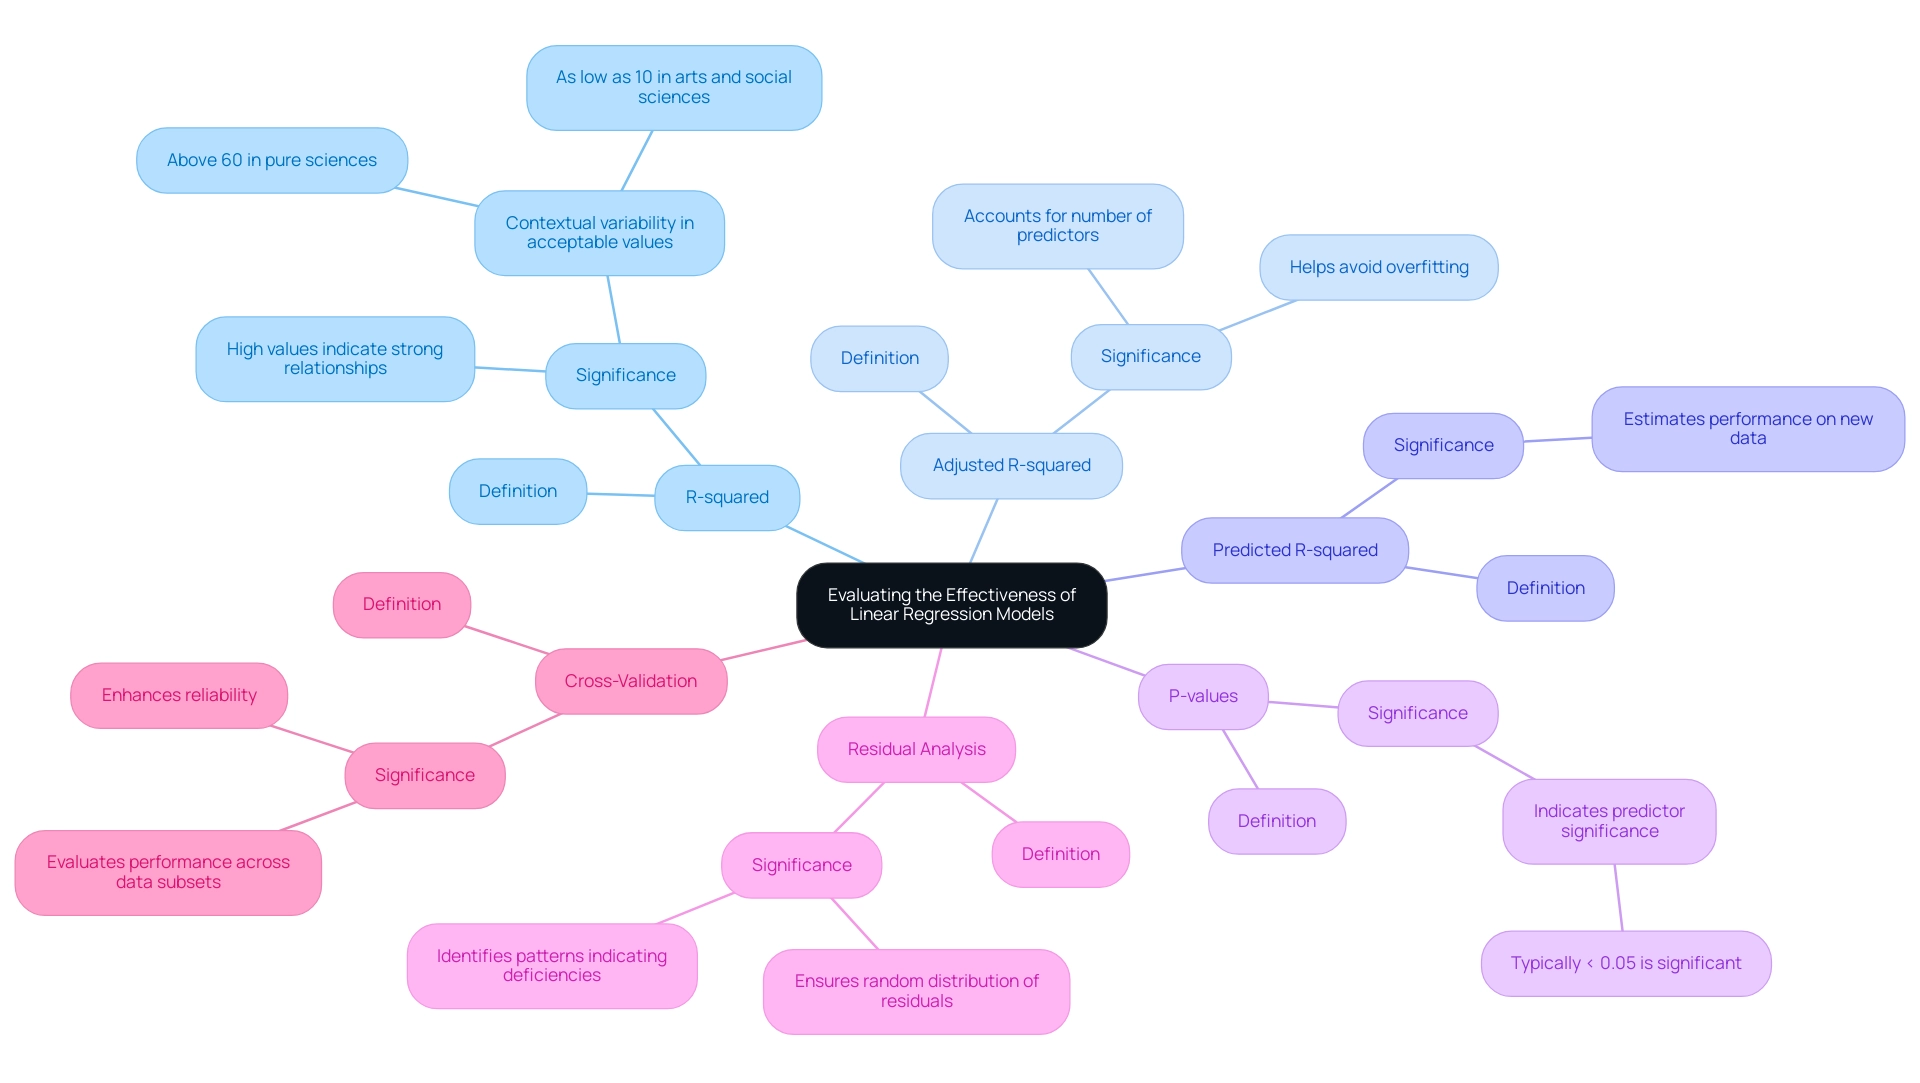
To effectively assess the performance of your linear regression models, it is essential to utilize the following evaluation metrics:
-
R-squared (Coefficient of Determination): This statistic quantifies how much of the variability in your dependent variable can be explained by the independent variables. Values nearing 1 suggest a strong relationship, while lower values indicate the necessity for further exploration into influencing factors.
-
Adjusted R-squared: Unlike R-squared, this metric considers the number of predictors in the analysis, providing a more precise depiction of performance, particularly in multiple regression situations. This adjustment helps avoid overfitting by penalizing the addition of irrelevant predictors.
-
Predicted R-squared: This statistic addresses specific issues with R-squared by providing an estimate of how well the system will perform on new data. It is especially helpful in confirming the system’s predictive capability.
-
P-values: These values assist in assessing the significance of each predictor. Typically, a p-value of less than 0.05 suggests that the variable plays a significant role in the analysis, guiding decisions on variable retention or removal.
-
Residual Analysis: Analyzing residuals—the differences between observed and predicted values—ensures they are randomly distributed. This indicates a well-fitted system and helps identify any patterns that may suggest deficiencies.
-
Cross-Validation: Employing techniques such as k-fold cross-validation allows you to evaluate performance across various subsets of data, enhancing reliability and ensuring applicability in different scenarios.
Understanding that acceptable R-squared values can vary by field is crucial. For instance, pure sciences often necessitate values above 60% due to their predictability, while in the arts and social sciences, a value as low as 0.10 may suffice. This variation highlights the significance of context in evaluation.
As Jim aptly states, “Theoretical issues can override the other statistical issues when you have solid theoretical reasons for including a variable or not.” This reinforces the need for a thoughtful approach in evaluating frameworks, considering both statistical metrics and theoretical foundations. By employing these evaluation techniques, you will not only discern the effectiveness of your linear regression trendline but also identify areas for enhancement to optimize your models.
Conclusion
Linear regression is a fundamental technique in data analysis that provides valuable insights into variable relationships and enables accurate predictions. Mastering this method is crucial for professionals aiming to enhance data-driven decision-making. The integration of Robotic Process Automation (RPA) further streamlines processes, reduces manual errors, and allows teams to focus on strategic goals.
This article provided a clear pathway for creating effective linear regression trendlines, covering essential steps such as:
- Data collection
- Software selection
- Result interpretation
It also explored various regression models, from simple to complex forms, emphasizing the importance of selecting the appropriate model based on data characteristics.
Data preprocessing is vital for ensuring the accuracy and reliability of regression analyses. Addressing data quality, normalizing variables, and selecting relevant features lay the groundwork for successful modeling. Additionally, evaluating model effectiveness through metrics like R-squared and cross-validation ensures that models perform well in real-world scenarios.
In summary, leveraging linear regression in conjunction with RPA equips organizations with the tools necessary to enhance analytical capabilities and operational efficiency. By adhering to best practices and understanding different regression methodologies, businesses can make informed decisions that drive growth and maintain a competitive edge in a rapidly changing environment. Embracing these statistical techniques empowers teams to utilize data strategically, ultimately leading to sustained operational excellence.

