Introduction
In the world of data visualization, the aesthetic appeal of reports can significantly impact their effectiveness. Power BI themes offer a powerful solution to enhance visual consistency and readability, enabling organizations to communicate insights with clarity and professionalism. By understanding how to leverage these themes, users can not only streamline the report creation process but also address common challenges such as data inconsistencies and user engagement.
This article delves into the intricacies of Power BI themes—from downloading and customizing them to best practices for implementation—equipping readers with the knowledge to elevate their reporting capabilities and align them with organizational branding.
Through thoughtful theme selection and customization, stakeholders can transform raw data into actionable insights, driving informed decision-making and operational efficiency.
Understanding Power BI Themes: An Overview
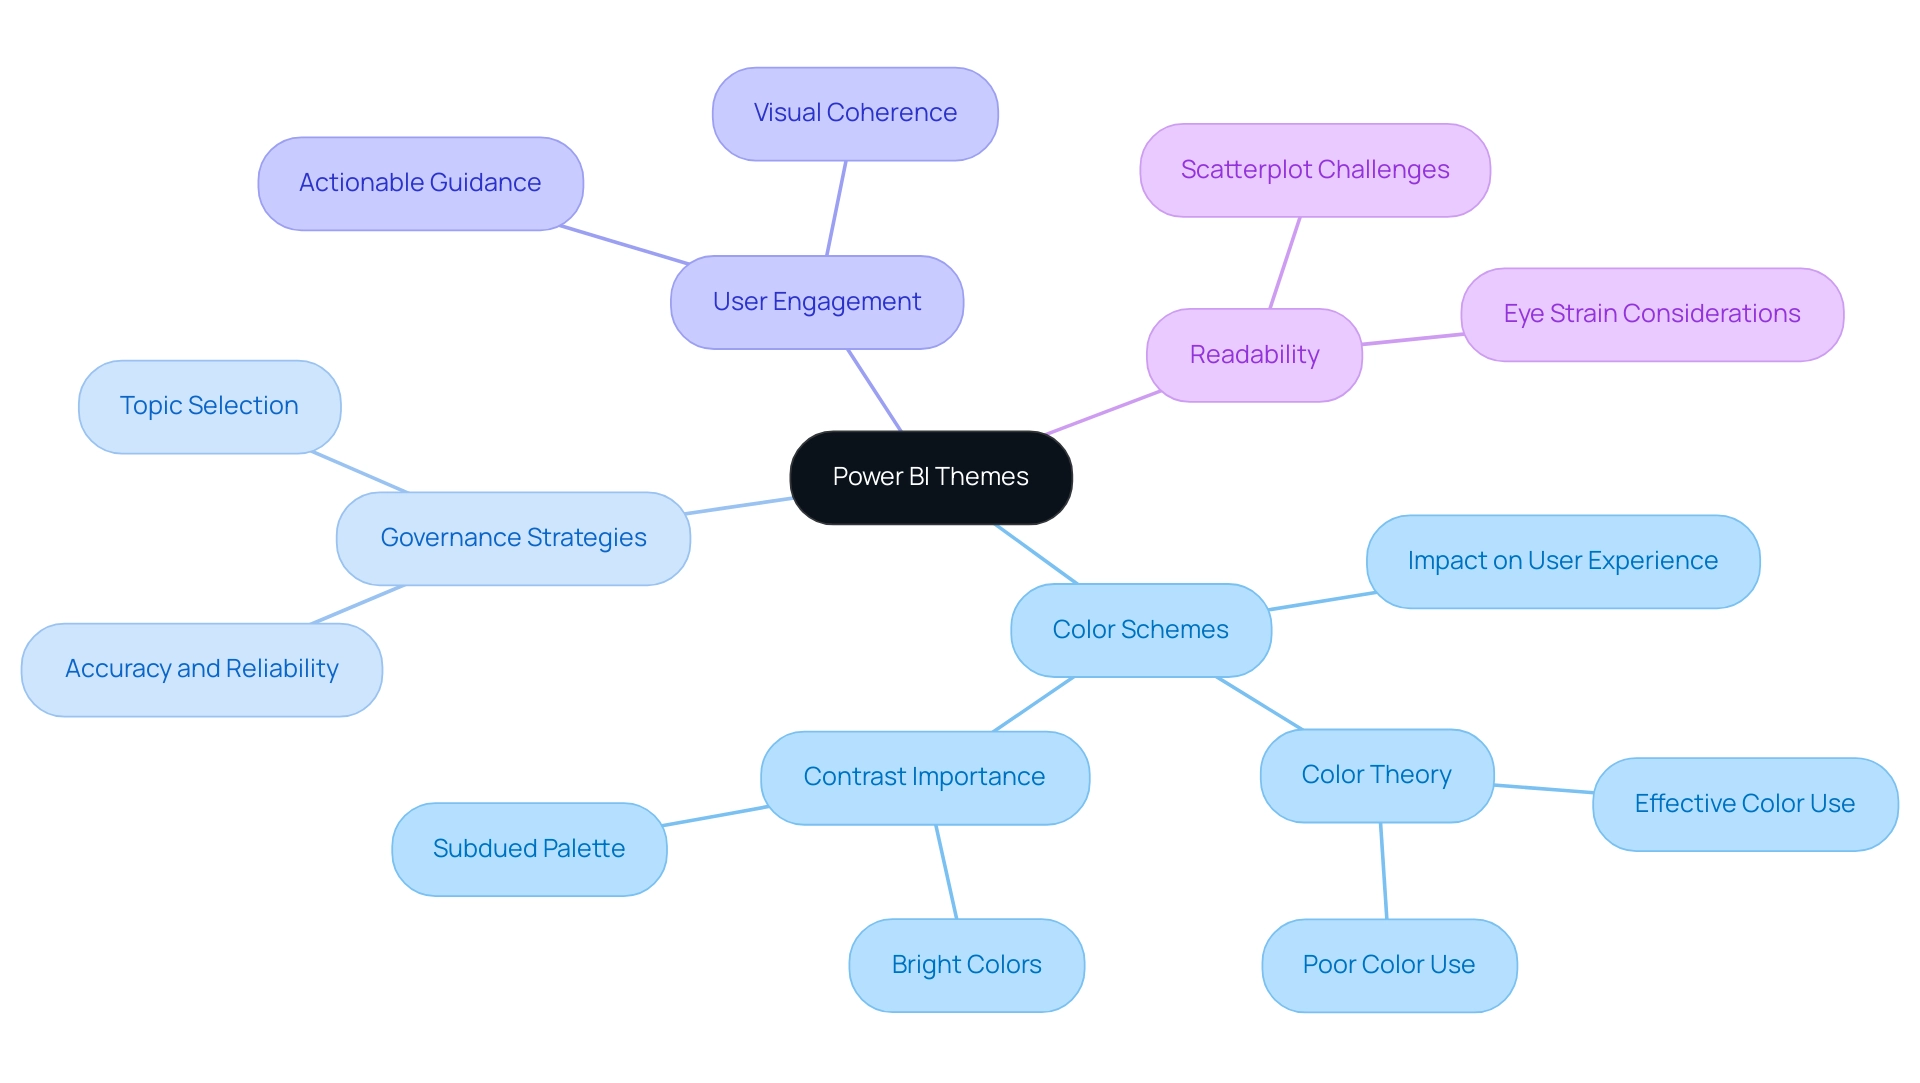
Power BI styles include thoughtfully selected color schemes and formatting choices aimed at enhancing the visual coherence and attractiveness of your documents. By leveraging these themes, users can establish a cohesive aesthetic across different visualizations, mitigating the challenges of time-consuming document creation and enhancing readability. This not only promotes greater user involvement but also tackles common problems like inconsistencies and the absence of actionable guidance.
To effectively combat inconsistencies and build trust in the reports, it is crucial to implement a robust governance strategy that ensures accuracy and reliability. Recognizing that the selection of topics profoundly influences how your data is interpreted, it is vital to choose them wisely. As color theorist Maureen Stone aptly states,
Color used well can enhance and clarify a presentation.
Color used poorly will obscure, muddle and confuse.
This emphasizes the importance of suitable topic selection for effective communication. A notable example is Klaus Schulte’s visualization of Luge competition categories, which utilizes the colors of the German flag to create immediate recognition and connection, illustrating how effective color choices can enhance user experience.
Furthermore, research indicates that scatterplots become increasingly challenging to interpret with six or more categories, reinforcing the need for thoughtful color selection to maintain clarity and impact. Additionally, a case study on the importance of contrast reveals that while bright and vivid colors can grab attention, they may lead to eye strain if overused. Adopting a more subdued color palette can significantly improve readability.
By understanding the available options, you enable yourself to make knowledgeable decisions about how to download Power BI themes or personalize them, ultimately ensuring your documents align with your organization’s branding and communication goals. Moreover, integrating clear, actionable guidance within your reports can provide stakeholders with a clear direction on the next steps, addressing a key concern in report effectiveness.
Step-by-Step Guide to Downloading Power BI Themes
To seamlessly download and apply custom themes in Power BI Desktop, follow these straightforward steps:
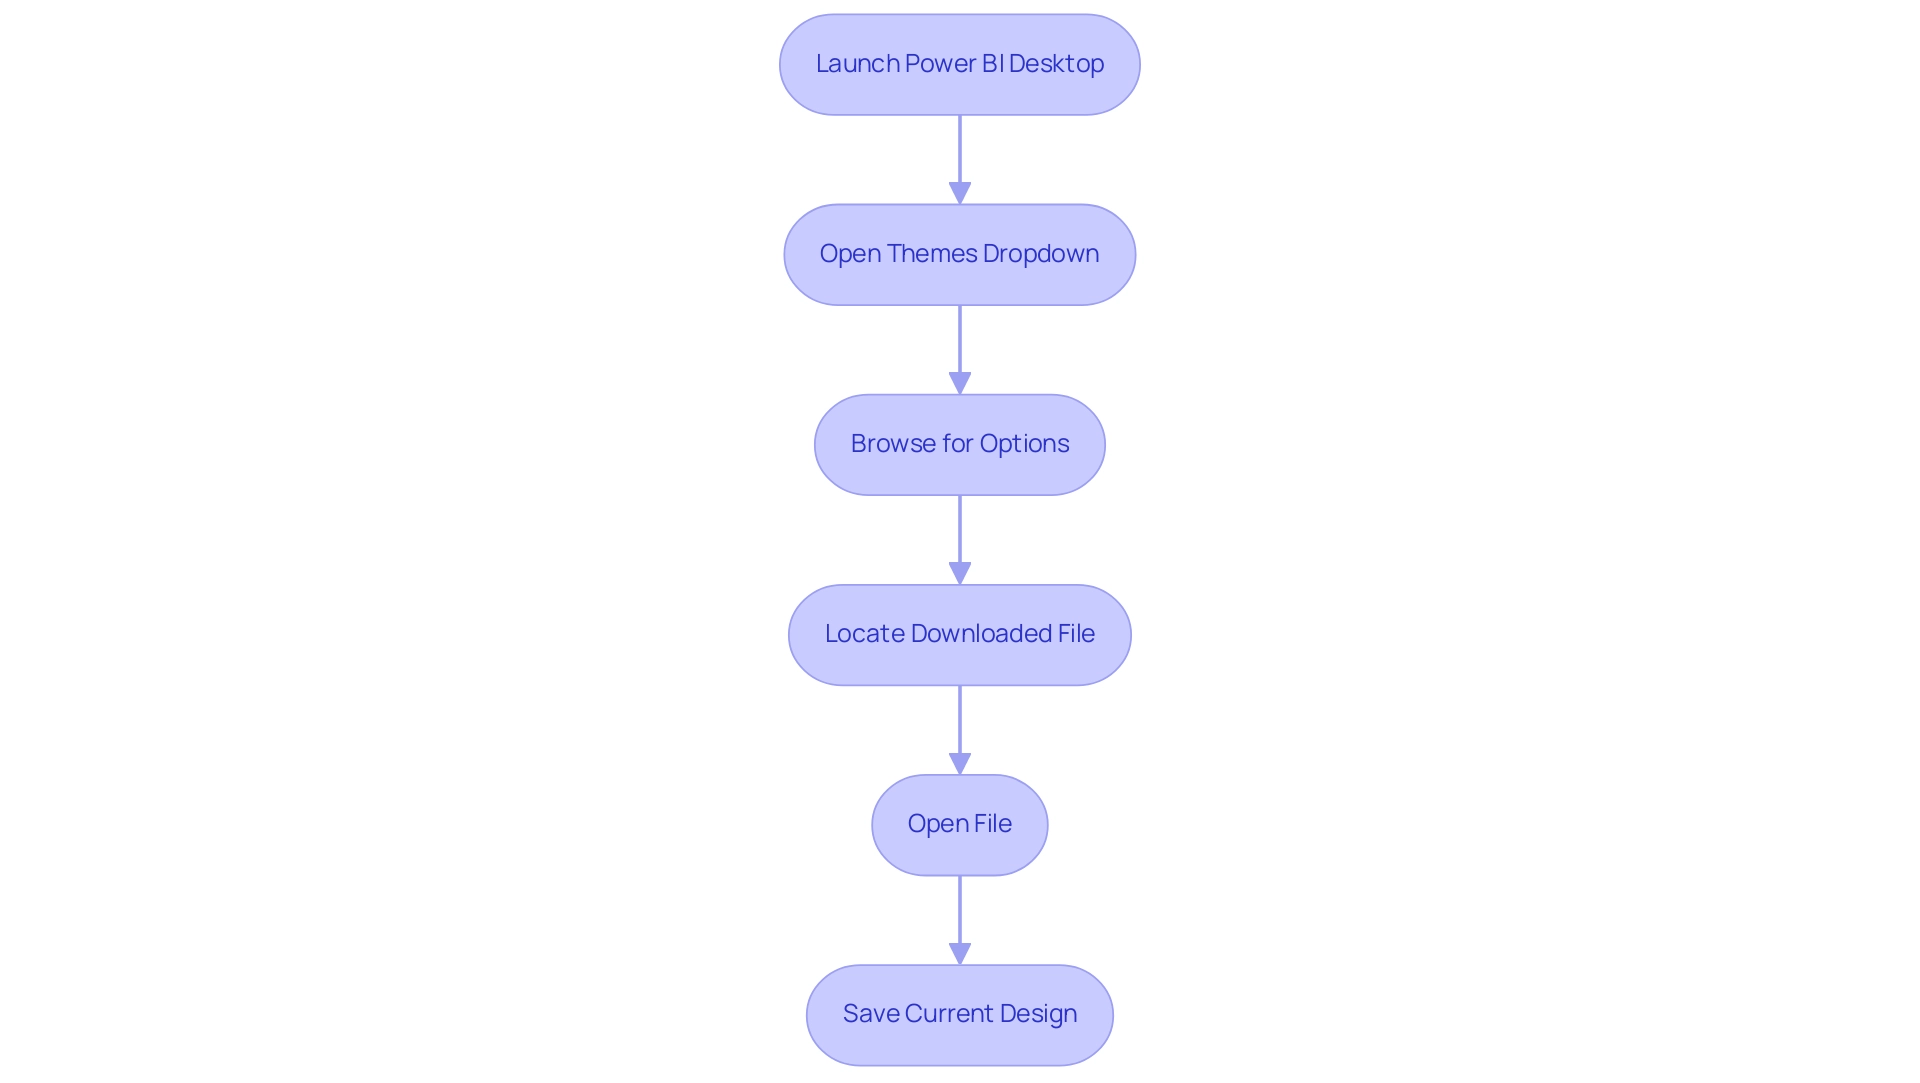
- Launch Power BI Desktop and navigate to the ‘View’ tab at the top of the interface.
- Click on the ‘Themes’ dropdown menu to download Power BI themes and access various style options.
- Select ‘Browse for options,’ which will launch your file explorer to download Power BI themes.
- To find the file after you download Power BI themes, check your computer; it is usually in .json format.
- Select the desired file and click ‘Open.’ This action will instantly apply the design to your report, transforming its appearance.
- If you wish to keep this design for future use, you should download Power BI themes by returning to the ‘Themes’ dropdown and selecting ‘Save current design.’ This enables you to quickly access your personalized design whenever needed.
Personalized designs not only improve visual attractiveness but also align your documents with corporate branding, making them more influential and actionable. By employing these concepts, you can reduce typical obstacles like time-consuming report generation and information inconsistencies. Importantly, custom designs can also provide actionable guidance by visually emphasizing key insights and trends in your data, helping stakeholders make informed decisions.
Significantly, a related post on this topic received 13,746 views, underscoring the growing interest in customizing themes within BI. According to lbendlin, a Super User in the Power BI community, “It is automatic, but only to a certain extent. If you don’t utilize the information, it will cease to be generated after some time. Don’t rely on it.” This highlights the significance of actively interacting with your reports and applying the concepts effectively. For further insights, consider exploring related content on administering BI in the admin portal, as this can also enhance your understanding of ensuring data governance and consistency, and engaging with the BI Community for additional resources.
Where to Find Power BI Themes for Download
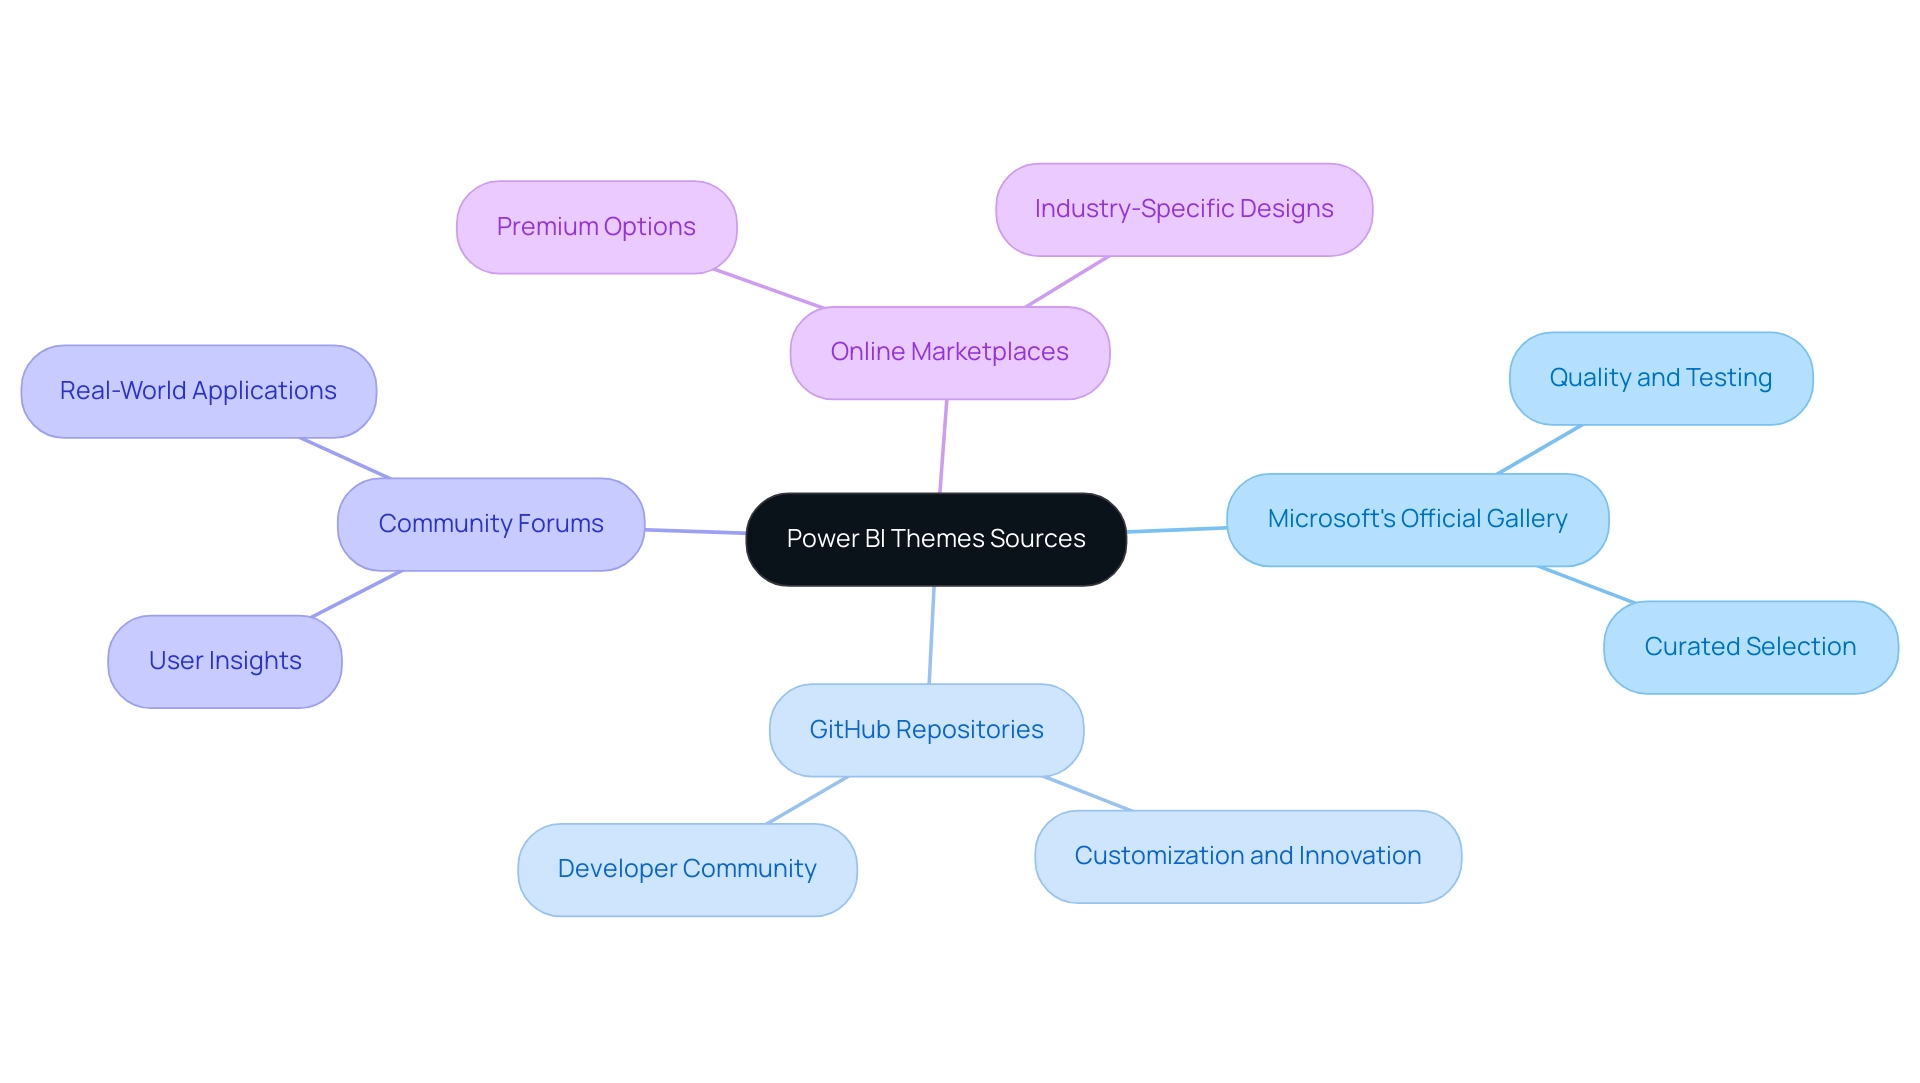
Power BI themes can be sourced from a variety of platforms, each offering unique advantages that cater to different user needs:
-
Microsoft’s Official Gallery: This is a prime resource, showcasing a curated selection of themes developed by Microsoft as well as contributions from the Power BI community. It guarantees that users have access to high-quality, tested designs that fit various reporting needs, ultimately supporting the goal of leveraging Business Intelligence for informed decision-making.
-
GitHub Repositories: A treasure trove for developers, GitHub hosts numerous repositories where creators share their custom BI styles. Merely searching for ‘Power BI styles’ can reveal innovative designs and functionalities that may not be found elsewhere, encouraging creativity and customization while tackling the challenge of time-consuming report creation.
-
Community Forums: Engaging with platforms like Power BI Community and Reddit can lead you to user-shared topics that reflect real-world applications and preferences. These forums not only enable direct downloads but also offer insights from users who have tried these designs in various contexts. As noted by KarlinOz, “I am looking for something to pull the Usage Metrics from all workspaces into one report,” illustrating the common struggle with data inconsistencies and the need for consolidated reporting solutions.
-
Online Marketplaces: For those seeking premium options, platforms like ThemeForest and Creative Market offer a variety of professionally designed layouts for purchase. These marketplaces often feature exclusive designs tailored for specific industries or reporting styles, adding a polished edge to your presentations and enhancing operational efficiency.
Along with using BI styles, integrating RPA solutions such as EMMA RPA and Automate can greatly simplify the reporting process. These tools help automate repetitive tasks, reducing the time spent on report creation and addressing staffing shortages, ultimately boosting employee morale and efficiency.
As we look toward 2024, you can significantly enhance your reporting capabilities by exploring diverse sources to download Power BI themes, allowing for greater customization and alignment with organizational branding. Addressing the need for a consolidated solution for usage metrics is crucial for operational efficiency. A relevant case study is the ‘Azure Function for Graph API Access,’ which proposes a method to surface Graph API information while ensuring that only site owners can access it.
This approach not only enhances data security but also provides a practical solution for users needing consolidated metrics. Monitoring emerging trends in customization and RPA will enable you to maintain an advantage in providing meaningful analyses.
Customizing Downloaded Power BI Themes
Modifying a design after you download Power BI themes is an uncomplicated task that allows you to align your documents with your brand identity while also addressing key operational challenges. Follow these steps to create an effective and visually appealing theme:
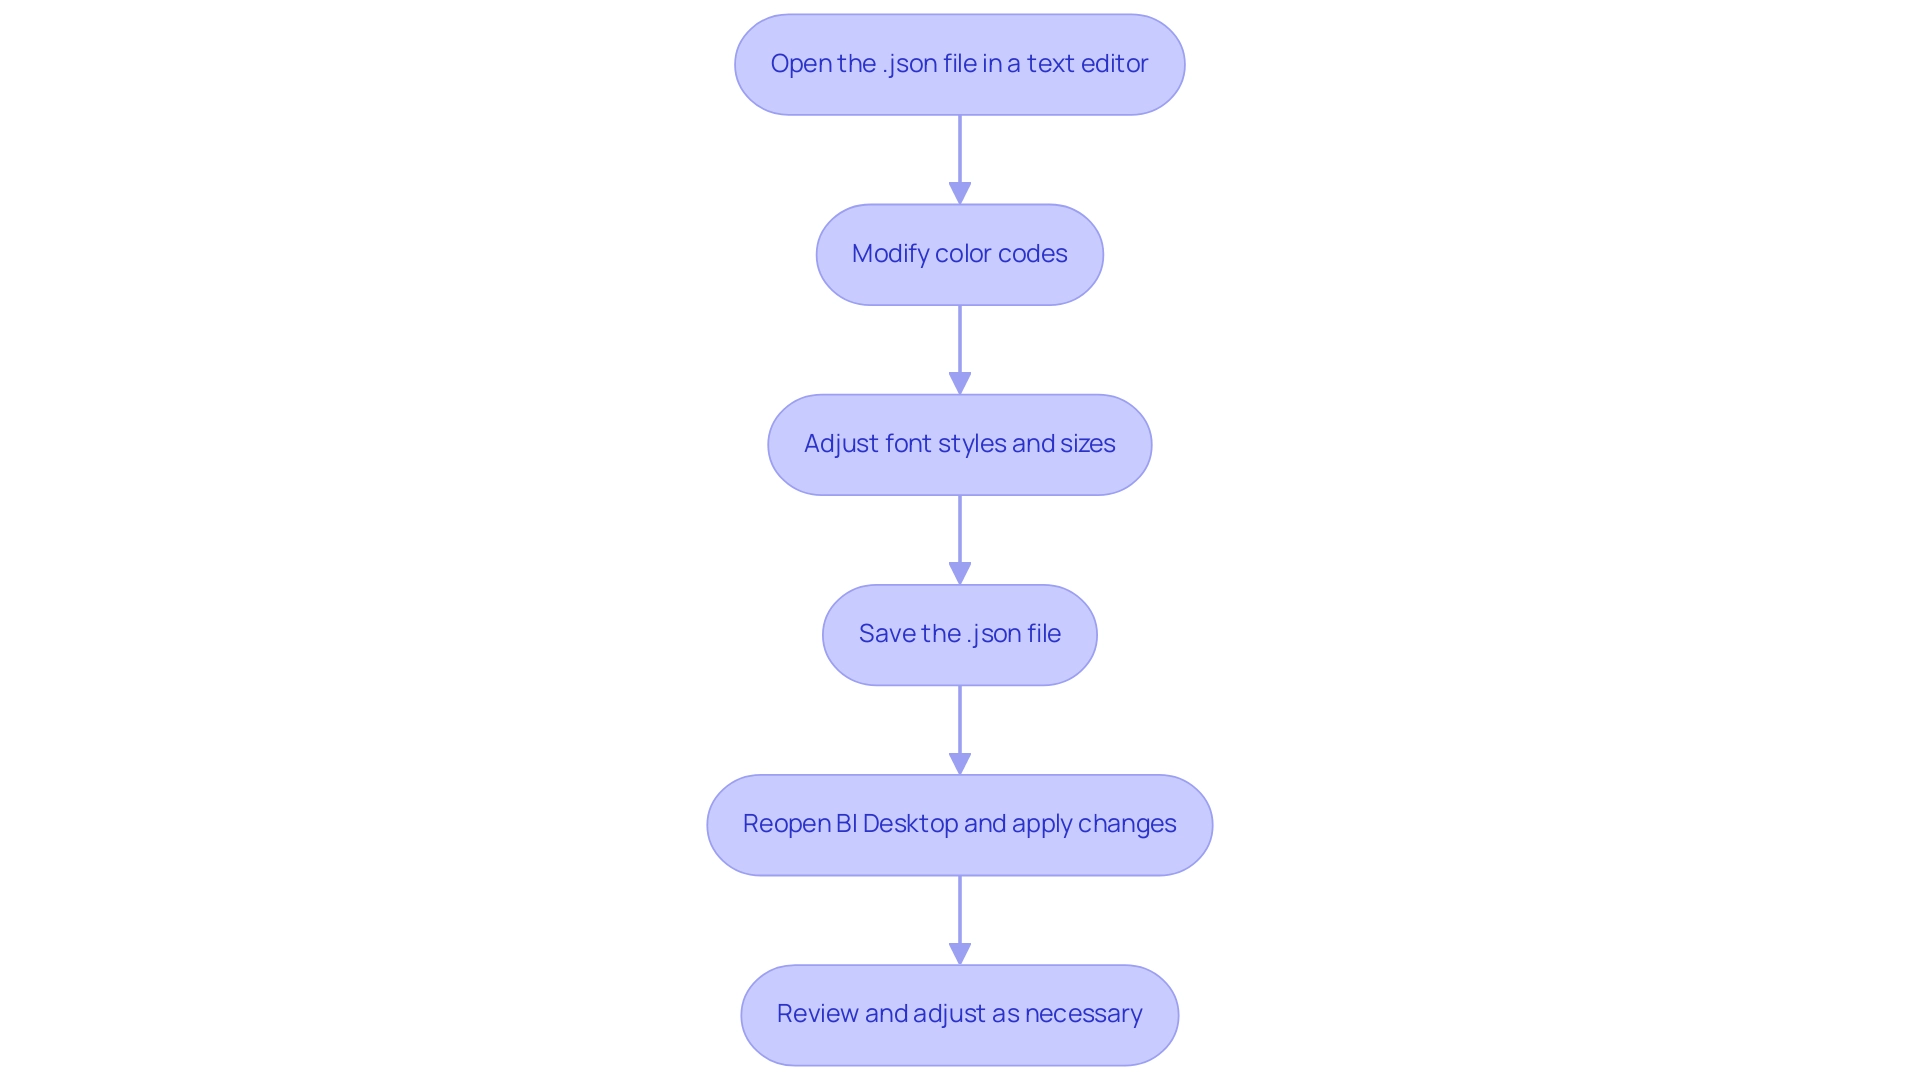
- Start by opening the file (.json) in a text editor, such as Notepad.
- Modify the color codes to reflect your brand’s color scheme, ensuring that your visual elements resonate with your organizational identity.
- Adjust font styles and sizes to fit your preferences; keep in mind that the default settings for the small label class are 9 pt font size, which is crucial for maintaining readability and aesthetics in your documents.
- Save the changes to the .json file to ensure your modifications are retained.
- Reopen BI Desktop and apply the altered design by choosing the ‘Browse for themes’ option.
- Review the changes in your document to ensure consistency and make further adjustments as necessary.
By following these steps, you can effectively download Power BI themes, allowing you to customize them to ensure they align with your brand and enhance the impact of your presentations. As noted by Paul Waller, a designer at endjin, “Whether it’s UX or dashboards for financial and retail services, making concepts look and feel great is essential for clarity.” This approach not only enhances your documents but also strengthens brand recognition and user engagement.
Furthermore, adopting Robotic Process Automation (RPA) can greatly enhance your workflow by automating repetitive tasks, which lessens the time invested in document creation and minimizes errors. By merging tailored AI solutions with your reporting processes, you can unlock valuable Business Intelligence insights that transform raw data into actionable insights, enabling informed decision-making that drives growth and innovation. Moreover, handling various concepts in documents and dashboards enables users to determine if visuals maintain the document style or embrace the dashboard style, ensuring visual uniformity across all platforms.
Best Practices for Implementing Power BI Themes
You can download Power BI themes to enhance your reports.
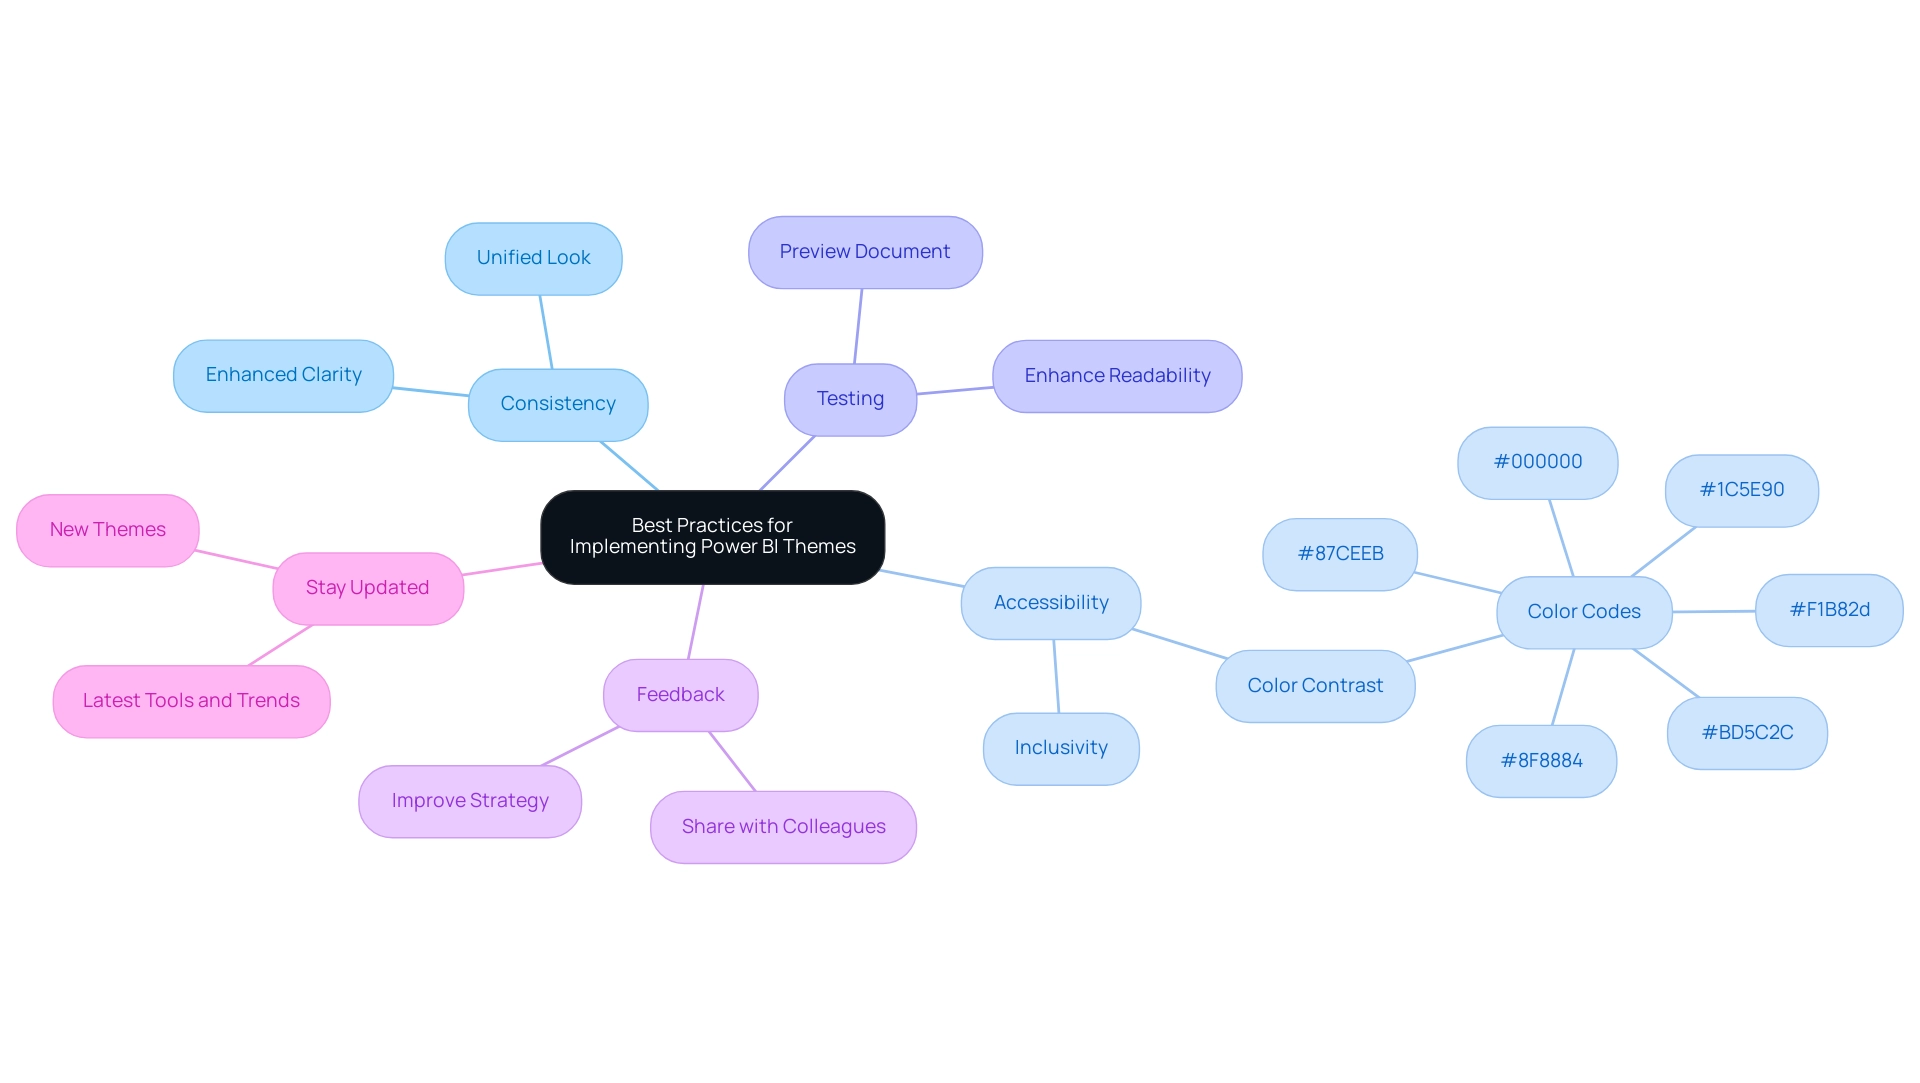
Consistency is Key: To enhance clarity and professionalism, it’s crucial to establish a unified look across all reports, which can be achieved when you download Power BI themes. By utilizing the same concept consistently, you create a unified experience that assists in information interpretation and allows users to download Power BI themes. This aligns with your objective of enhancing operational efficiency by ensuring that your team can easily navigate and utilize the insights derived from information, as well as download Power BI themes.
-
Consider Accessibility: It’s essential to choose color contrasts that are inclusive for all users, particularly those with visual impairments. Utilizing the first six colors—
#F82d,#000000,#C90,#87CEEB,#8F8884, and#BD2C—ensures compatibility with the three main types of color blindness, thereby broadening your audience’s accessibility to your insights. This commitment to inclusivity not only adheres to best practices but also enhances the effectiveness of your data-driven strategies. -
Test Before Finalizing: Always preview your document with the new theme before completing it. This crucial step ensures that your design enhances readability and engagement, allowing you to make adjustments that improve user experience. In the context of utilizing your Business Intelligence tools, this practice can significantly reduce the time spent on document creation and enhance data consistency.
-
Gather Feedback: Sharing your themed reports with colleagues can provide invaluable insights into their effectiveness. By gathering feedback, you can improve your strategy and ensure that your concepts resonate well with your audience. As Olga Cheban, a Technical Content Writer at Coupler.io, states, “I’ve been writing about information, tech solutions, and business for years, and this passion never fades. I find technology fascinating and hope that the content I create helps people discover new solutions and ideas.” Engaging your team in this process can enhance morale and foster a collaborative environment.
You can download Power BI themes to enhance your reports.
Stay Updated: Keep an eye out for new themes so you can download Power BI themes and updates to existing ones. Frequently updating your documents not only sustains interest but also shows a dedication to using the latest tools and trends in visualization. Additionally, referencing the case study titled “Choosing the Right Charts and Graphs” underscores the importance of selecting appropriate chart types for effective data visualization, especially in overcoming challenges related to time-consuming report creation and data inconsistencies. By leveraging these strategies, including the benefits of RPA such as reducing errors and freeing up your team for more strategic tasks, you can effectively overcome the challenges of technology implementation and drive business growth.
Conclusion
Power BI themes are essential tools that enhance both the visual appeal and effectiveness of data reports. By understanding how to download, customize, and implement these themes, users can create a consistent and engaging reporting experience that aligns with organizational branding. The careful selection of color palettes not only mitigates data inconsistencies but also fosters user engagement, making insights more accessible and actionable.
Moreover, adhering to best practices—such as ensuring consistency across reports, prioritizing accessibility, and gathering feedback—can significantly elevate the quality of data presentations. By integrating thoughtful design with robust governance strategies, organizations can transform their reporting capabilities into powerful decision-making tools. This approach not only enhances operational efficiency but also empowers stakeholders with the clarity needed to act on insights.
In conclusion, leveraging Power BI themes is not just about aesthetics; it’s about driving informed decisions and enhancing the overall effectiveness of data visualization. Embracing these strategies will lead to more impactful reports that resonate with audiences and ultimately contribute to organizational success. Now is the time to harness the power of themes to unlock the full potential of data-driven insights.

