Overview:
The article provides a comprehensive step-by-step guide on how to split a column in Power BI using the “Text Contains” feature, highlighting its importance for data analysis and reporting. By detailing the process and emphasizing the benefits of clearer data segmentation for improved insights and decision-making, the article underscores how effective column splitting can enhance operational efficiency in BI tools.
Introduction
In the realm of data analysis, the ability to effectively manipulate and interpret information is paramount. Column splitting in Power BI emerges as a crucial technique, empowering analysts to dissect complex datasets into manageable segments. This practice not only enhances clarity but also transforms convoluted reports into actionable insights, enabling organizations to navigate the intricacies of data with confidence.
As businesses increasingly rely on data-driven decision-making, mastering the art of column splitting becomes essential for optimizing operational efficiency and fostering innovation. With practical steps and advanced techniques at their disposal, professionals can unlock the full potential of their data, driving impactful outcomes in a competitive landscape.
Understanding Column Splitting in Power BI
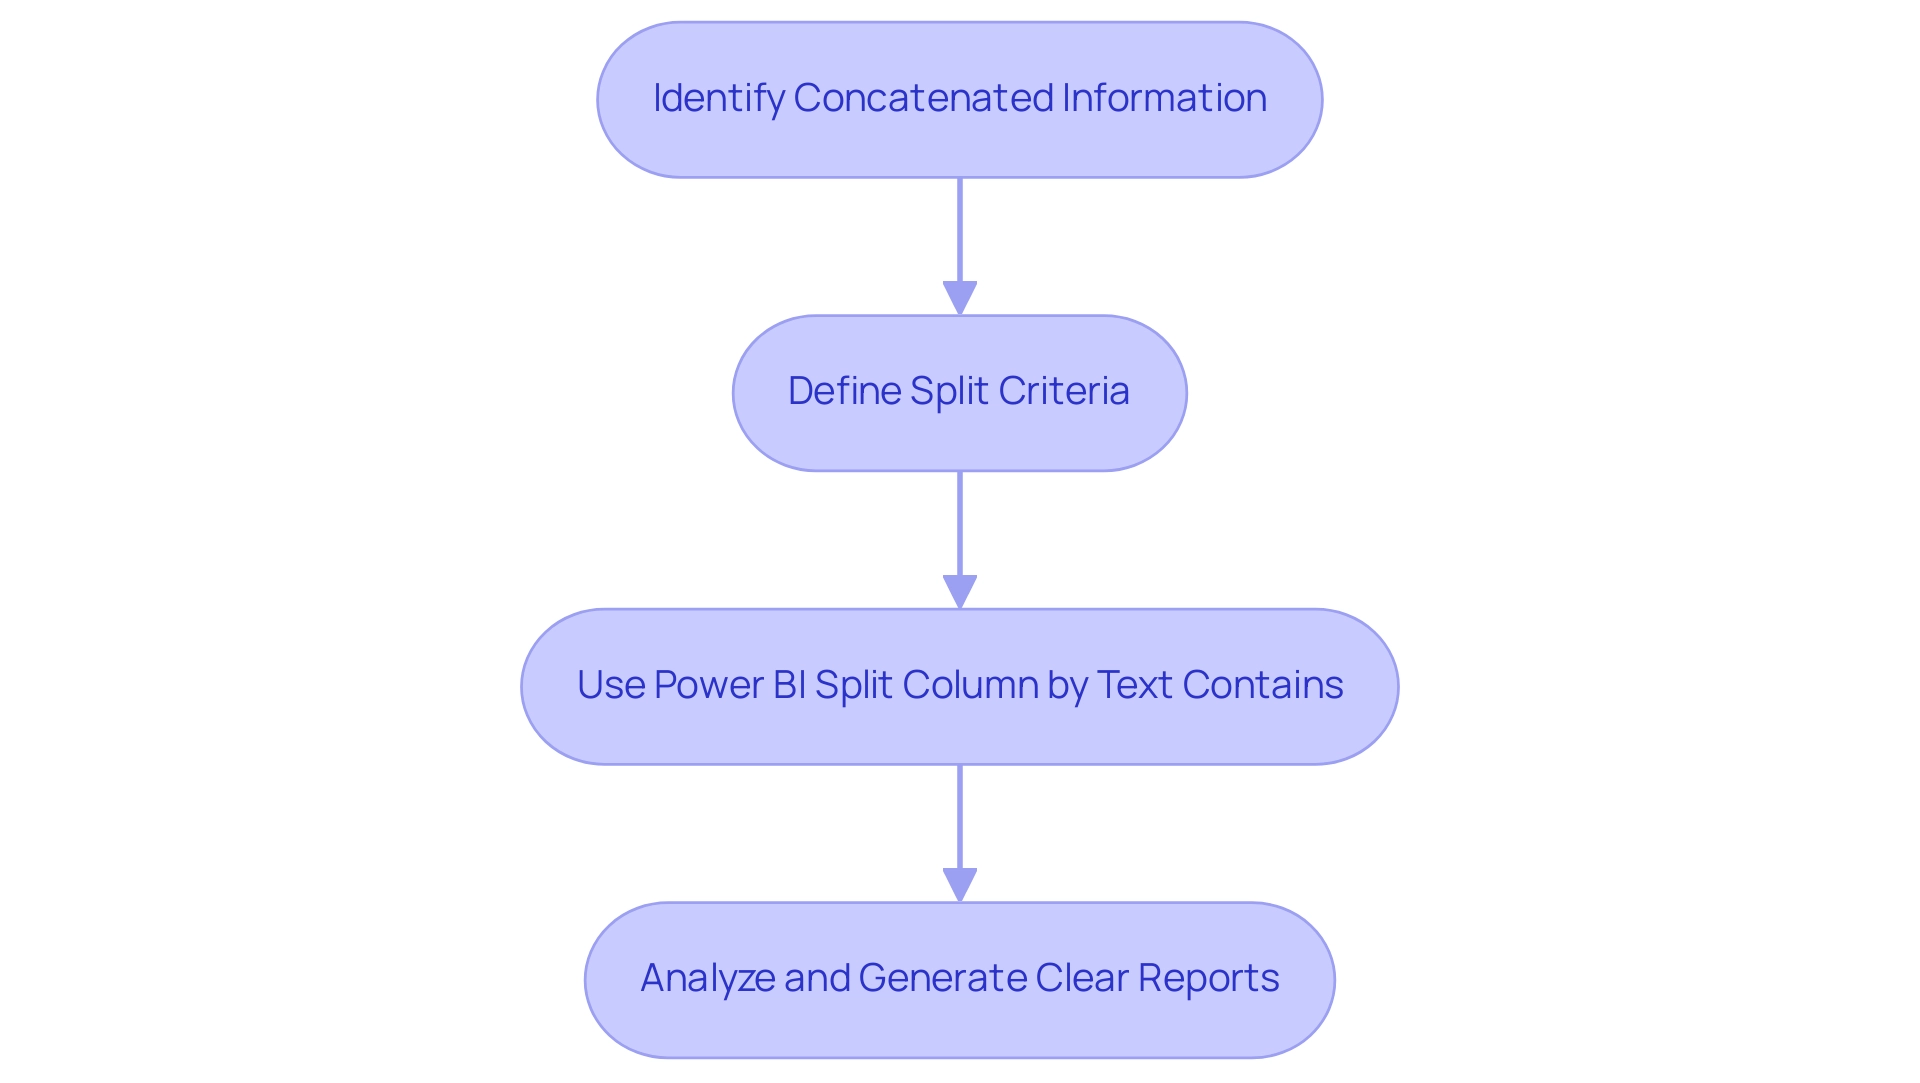
An essential method for dividing data in a reporting tool is to use Power BI split column by text contains, which allows users to separate a single field into several based on defined criteria. This method is particularly advantageous when dealing with datasets containing concatenated information within a single field, which can complicate analysis and reporting processes. By efficiently separating essential information segments through partitioning, analysts can improve the clarity and usability of their reports, thus tackling the frequent issue of reports filled with figures but lacking clear, actionable guidance.
As HadilBENAmor, a Copper Contributor, highlights, ‘The BI clustering feature allows you to analyze your semantic model to identify similarities and dissimilarities in the attribute values.’ This emphasizes the importance of dividing sections for enhanced analysis, particularly considering frequent issues such as time-consuming report generation and inconsistencies in information. In the context of the latest updates in Business Intelligence for 2024, the Power BI split column by text contains feature not only simplifies information interpretation but also facilitates more insightful visualizations.
Embracing these techniques is crucial for optimizing information usability and driving effective decision-making in your operations, ultimately leveraging the full potential of Business Intelligence for growth and innovation.
Step-by-Step Process to Split Columns by Text Contains
-
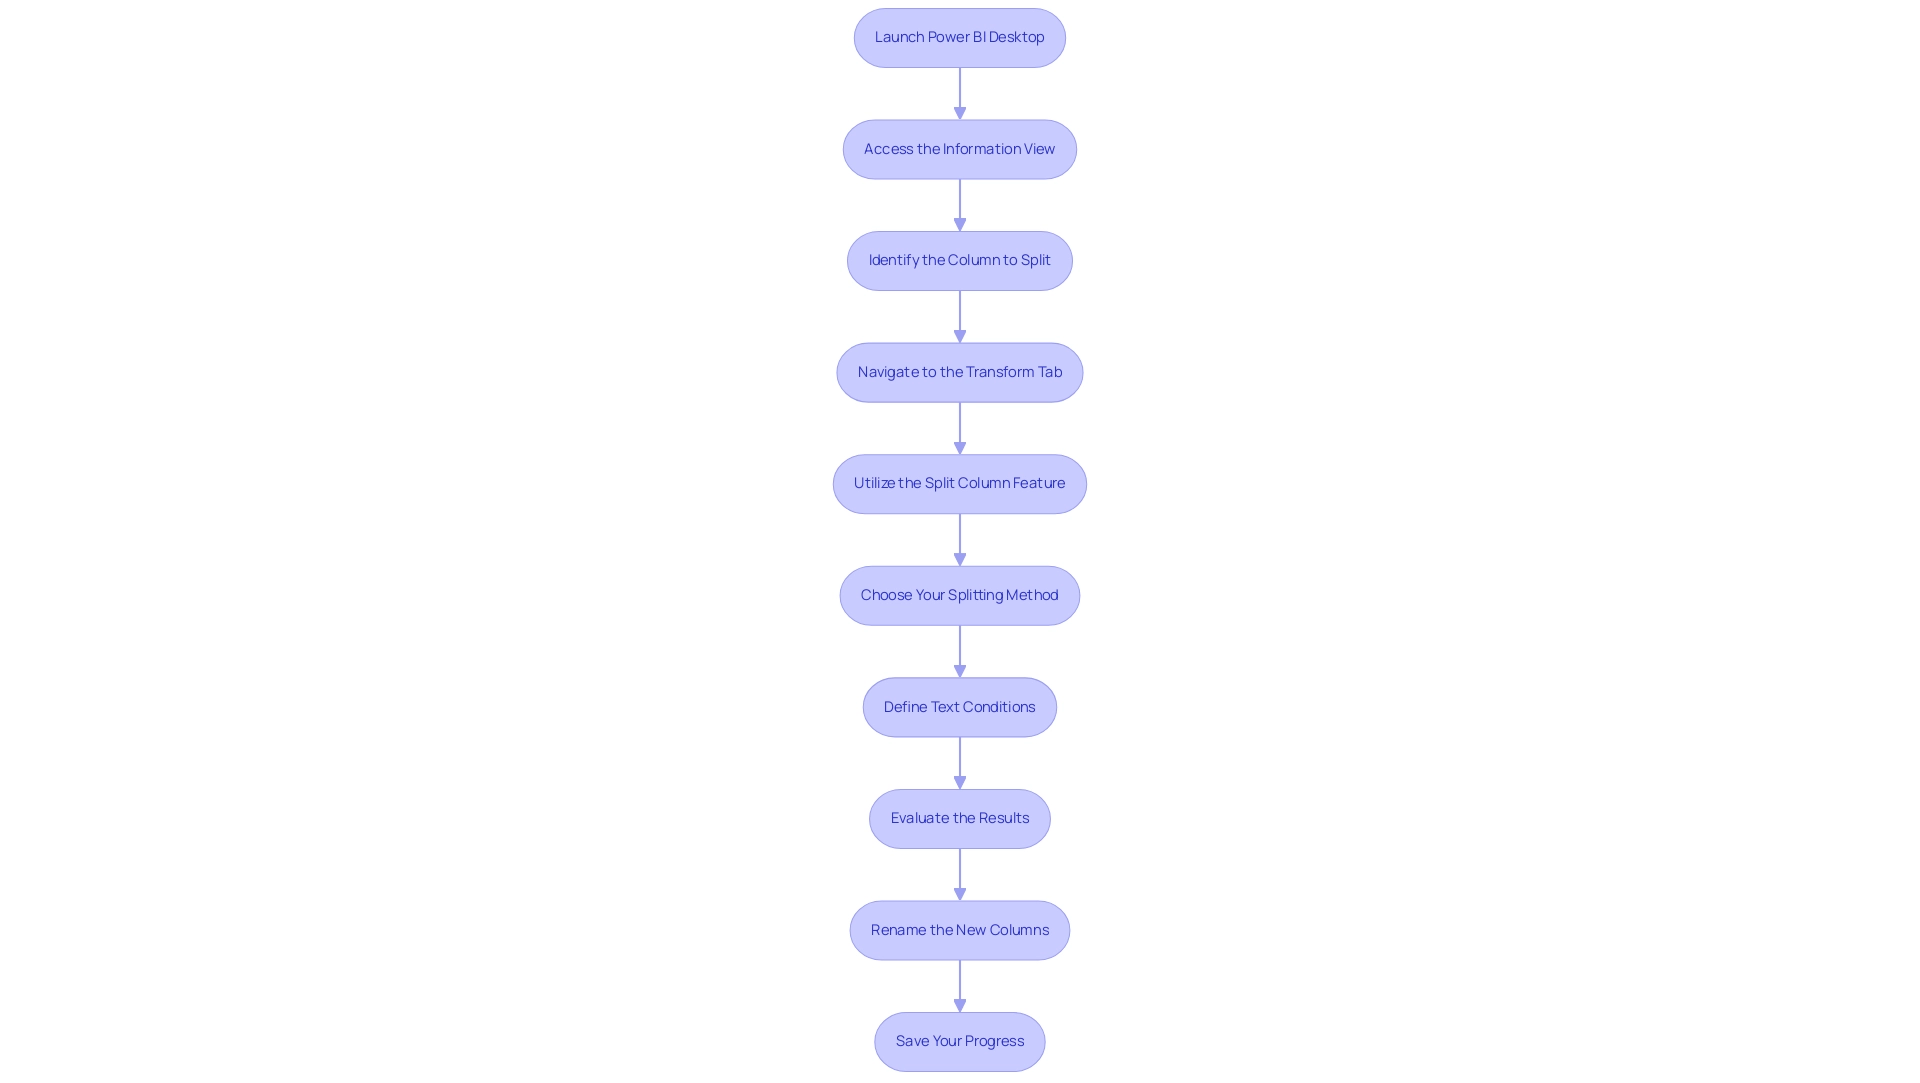
Launch Power BI Desktop: Start by opening the Power BI application and loading your dataset into the model. This initial step is essential for preparing the groundwork for your information manipulation tasks, which are crucial for generating insights based on information. In today’s data-rich environment, failing to extract meaningful insights can leave your business at a competitive disadvantage.
-
Access the Information View: Click on the ‘Info’ icon located on the left panel to view your tables. This perspective is where you will carry out your partitioning, essential for addressing inconsistencies in information.
-
Identify the Column to Split: Find the column you wish to split and select it. This selection is crucial as it determines which information will be manipulated, addressing the challenges of time-consuming report creation.
-
Navigate to the Transform Tab: Move to the ‘Transform’ tab in the ribbon at the top of the screen. This tab provides the necessary tools for information transformation, enhancing operational efficiency through RPA solutions.
-
Utilize the ‘Split Column’ Feature: In the ribbon, locate the ‘Split Column’ dropdown menu. This feature is the key to segmenting your information effectively, ensuring actionable guidance for your analysis.
-
Choose Your Splitting Method: Select ‘By Delimiter’ if your split is based on a specific character, such as a comma or space. Alternatively, choose ‘By Number of Characters’ for fixed-length splits, depending on the structure of your information.
-
Define Text Conditions: If you are splitting by text, specify the conditions by selecting the option to split based on particular text occurrences, and enter the text you wish to use as the delimiter. This precision ensures your information is split accurately according to your needs.
-
Evaluate the Results: Once you’ve executed the split, review the new sections generated to confirm they align with your expectations and intended format, enhancing user engagement.
-
Rename the New Columns: For clarity and relevance, rename the newly created columns to reflect their contents accurately. This practice improves your information organization and makes analysis simpler.
-
Save Your Progress: Lastly, save your BI report to secure the changes you’ve made. This step ensures that your modifications are retained for future reference and analysis.
It’s important to note that only 9% of organizations felt that clarifying roles and responsibilities was effective, underscoring the need for clear information manipulation processes to enhance operational efficiency. Furthermore, the admin overseeing the workspace for adoption tracking demonstrates how efficient information handling in BI can result in enhanced user engagement and informed decision-making. As Douglas Rocha, a statistics enthusiast, points out, “there isn’t a native DAX function to calculate it,” highlighting the significance of utilizing the column splitting feature as a workaround for certain limitations in BI.
By following these steps, you can effectively manipulate your information in BI, enhancing user engagement and insights derived from your datasets, while also leveraging RPA to streamline these processes.
Troubleshooting Common Issues in Column Splitting
-
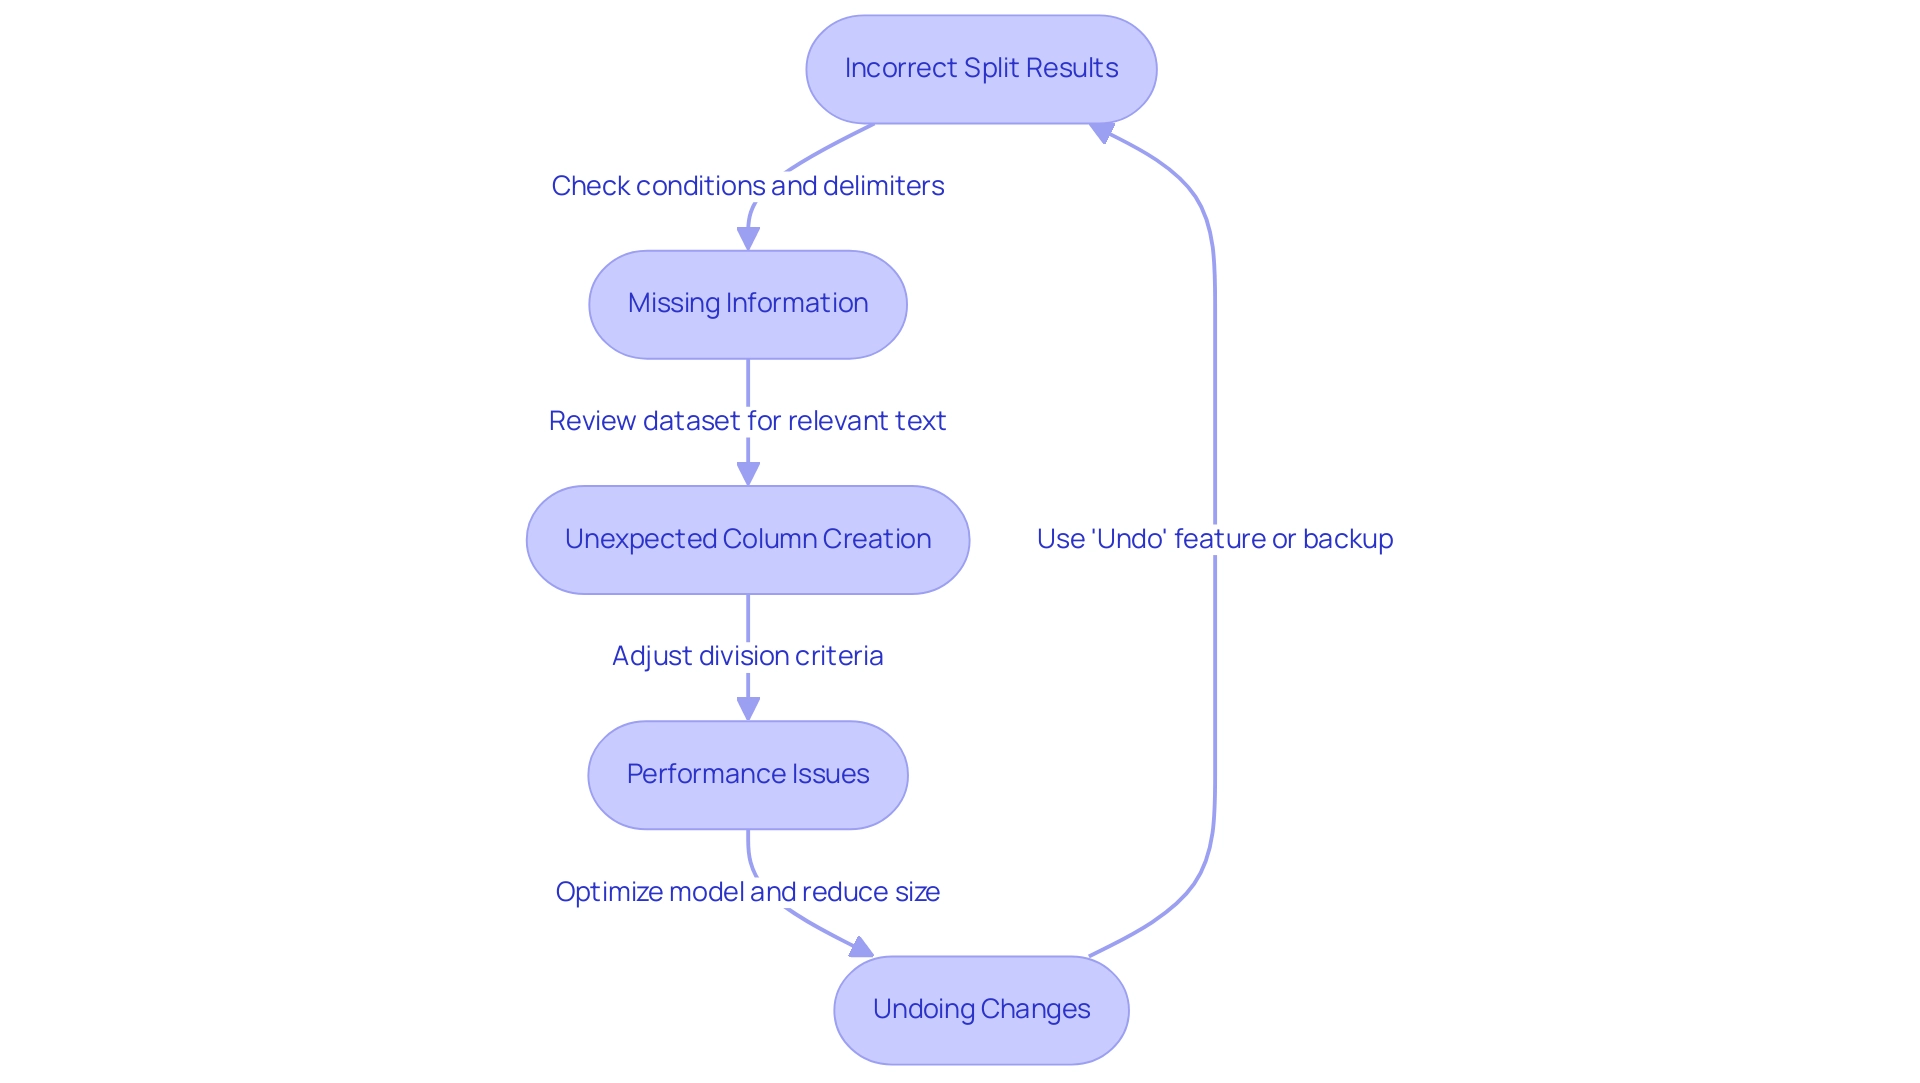
Incorrect Split Results: When the split operation fails to yield the expected outcomes, it’s essential to verify the conditions you’ve set. Look for typographical errors or inaccurate delimiters that may impede the process. Additionally, remember that Power BI has a 1GB cap per dataset, a limitation that can affect your ability to manage large datasets effectively. By leveraging Robotic Process Automation (RPA), you can streamline this verification process, ensuring your team can focus on strategic tasks that enhance operational efficiency. For instance, automating the verification can reduce the time spent on checks by up to 50%, allowing for quicker adjustments.
-
Missing Information: If information does not split as anticipated, ensure that the specified text exists in the targeted column. A thorough review of your dataset can confirm the presence of the relevant text necessary for a successful Power BI split column by text contains. Furthermore, keep in mind that Pro users have a maximum storage limit of 10GB, which may affect accessibility. Integrating RPA can automate the data-checking process, thereby reducing time spent on manual validation. This automation can lead to a 30% increase in information accuracy and availability.
-
Unexpected Column Creation: Should you find that an excessive number of columns have been generated, revisit your division criteria. Adjusting the text conditions to be more precise can alleviate this issue. As underscored in case studies on ambiguous relationships in information models, unclear handling can lead to incorrect results in Power BI reports, emphasizing the importance of clarity in your Power BI split column by text contains approach. RPA can assist in maintaining this clarity through automated checks, ensuring that your models remain precise and actionable.
-
Performance Issues: If sluggish performance occurs during the split process, consider optimizing your model. Reducing the dataset size or simplifying calculations can significantly enhance overall efficiency. Experts recommend that installing a gateway may be essential for proper refresh configuration, which could also enhance performance. RPA can facilitate optimization tasks, enabling your team to maintain high performance without the manual overhead. Implementing RPA in this context can lead to performance improvements of up to 40%.
-
Undoing Changes: Mistakes happen, but recovery in Power BI is straightforward. Utilize the ‘Undo’ feature or revert to a prior version of your report to restore your information to its previous state. Additionally, utilizing RPA can assist in automating the backup and version control process, offering peace of mind and ensuring information integrity. This integration not only protects your information but also enhances your team’s ability to recover from errors swiftly, thus improving overall operational resilience. Moreover, combining RPA with Business Intelligence can ensure that insights derived from data are both timely and accurate, further supporting informed decision-making.
Advanced Techniques for Efficient Column Splitting
-
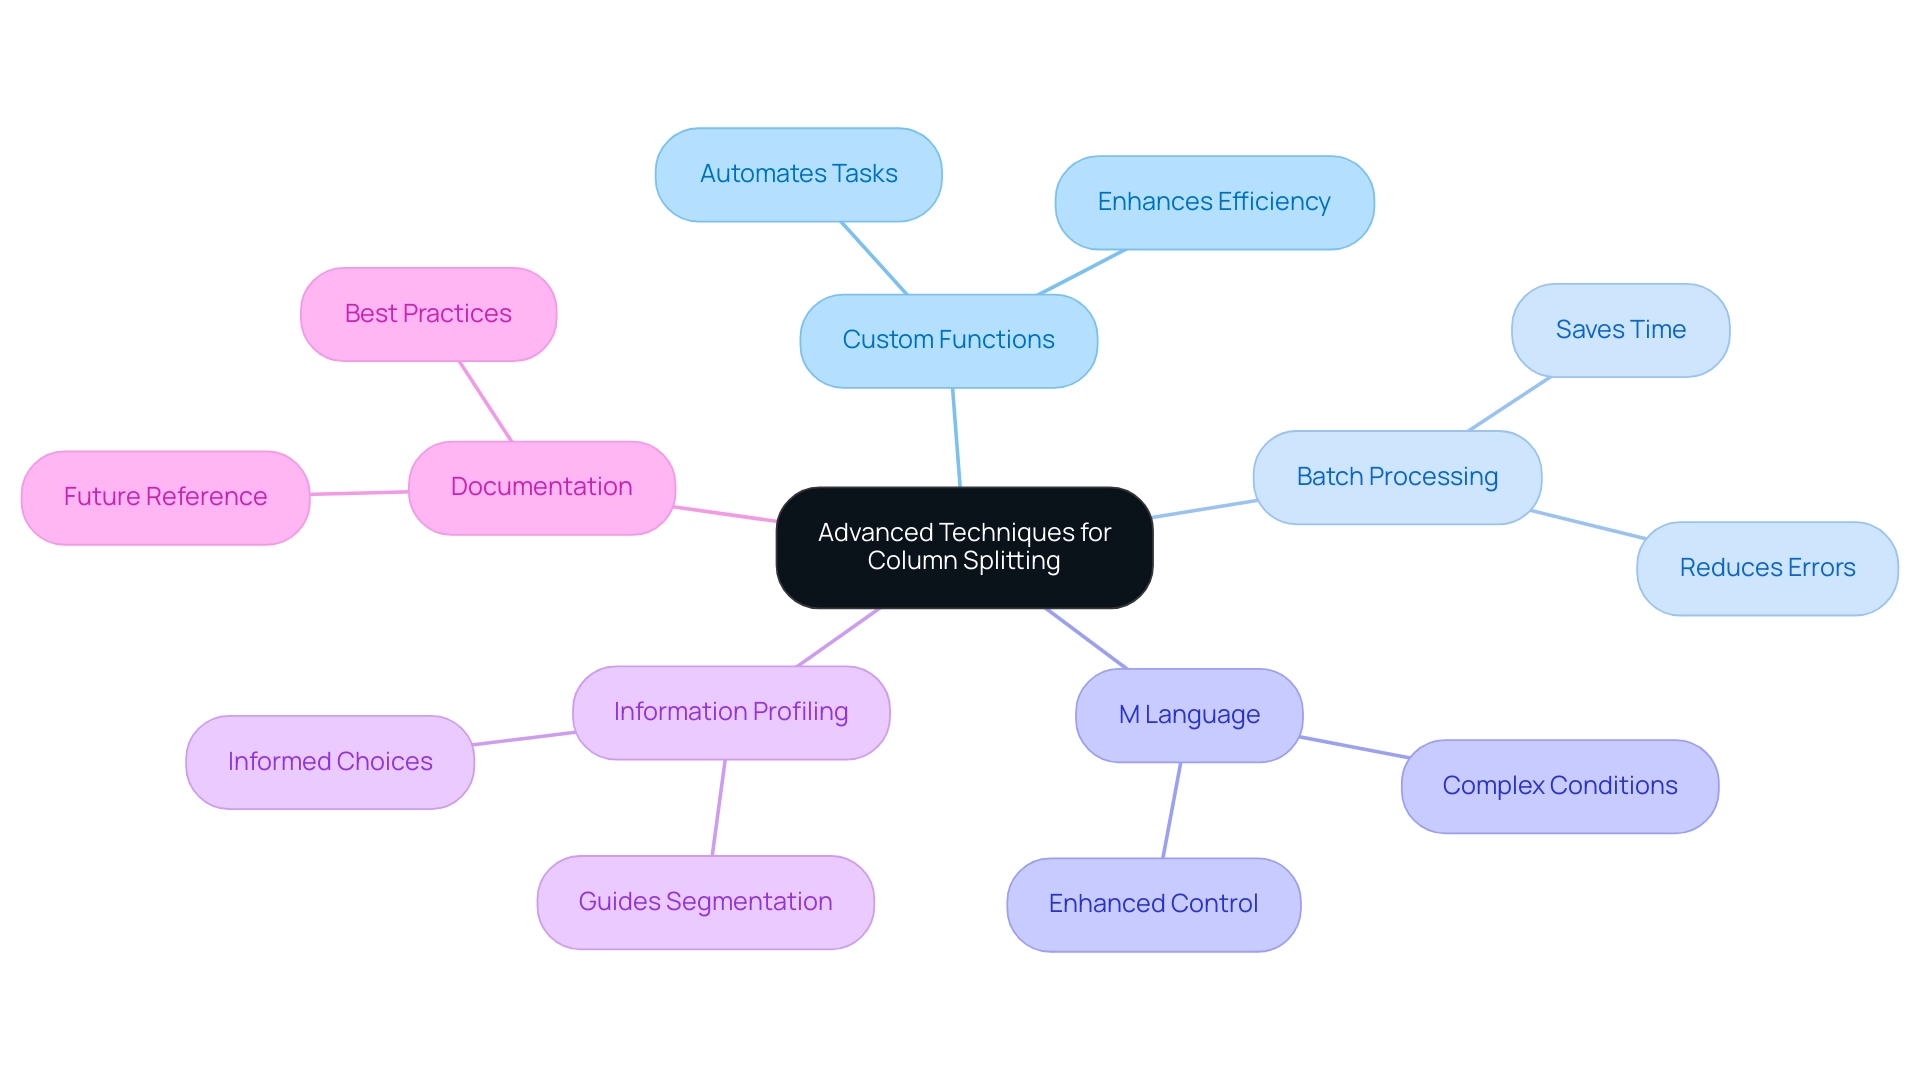
Using Custom Functions: Utilize the capabilities of custom functions in Query to automate repetitive column-splitting tasks. This approach not only streamlines your workflow but significantly enhances overall efficiency, allowing your team to focus on more strategic initiatives, much like how Power Automate transforms business operations through seamless digitalization and AI-powered accessible automation.
-
Batch Processing: When confronted with the necessity to divide several fields simultaneously, consider utilizing batch processing methods. This allows you to apply consistent split settings across various columns at once, saving time and reducing the potential for errors, paralleling the efficiencies gained through Robotic Process Automation (RPA).
-
Utilizing M Language: For those acquainted with advanced techniques, using M language scripts can greatly enhance your control over the division process. This language offers the flexibility to define complex conditions and transformations, ensuring that your manipulation aligns precisely with your analytical requirements, facilitating a driven approach to decision-making.
-
Information Profiling: Before engaging in the division process, utilize the Power BI split column by text contains feature. Examining your data’s structure and nuances in advance will guide your method of segmenting, particularly when you utilize Power BI to split column by text contains, assisting you in making informed choices that enhance your data analysis results and support operational efficiency.
-
Documentation: Maintain thorough documentation of your splitting processes and their results. This practice not only aids in future projects by providing a reference point but also establishes best practices that can be shared across your organization, fostering a culture of continuous improvement and aligning with the overarching goal of enhanced productivity.
Additionally, consider enrolling in our upcoming training sessions on BI, scheduled for July 30, 31, Aug 1, 4, 5, 6, 7, 8, 11, 12, 2025, with Amitabh Saxena. As he says, “Enroll Now” to enhance your skills further. Furthermore, the case study titled “Optimizing Information Models for Performance” illustrates the application of these techniques, showcasing strategies such as reducing model size and optimizing refresh operations, ensuring fast query responses and improved user experience.
To learn more about how Automate can further enhance your operations, book a free consultation today.
The Importance of Mastering Column Splitting for Data Analysis
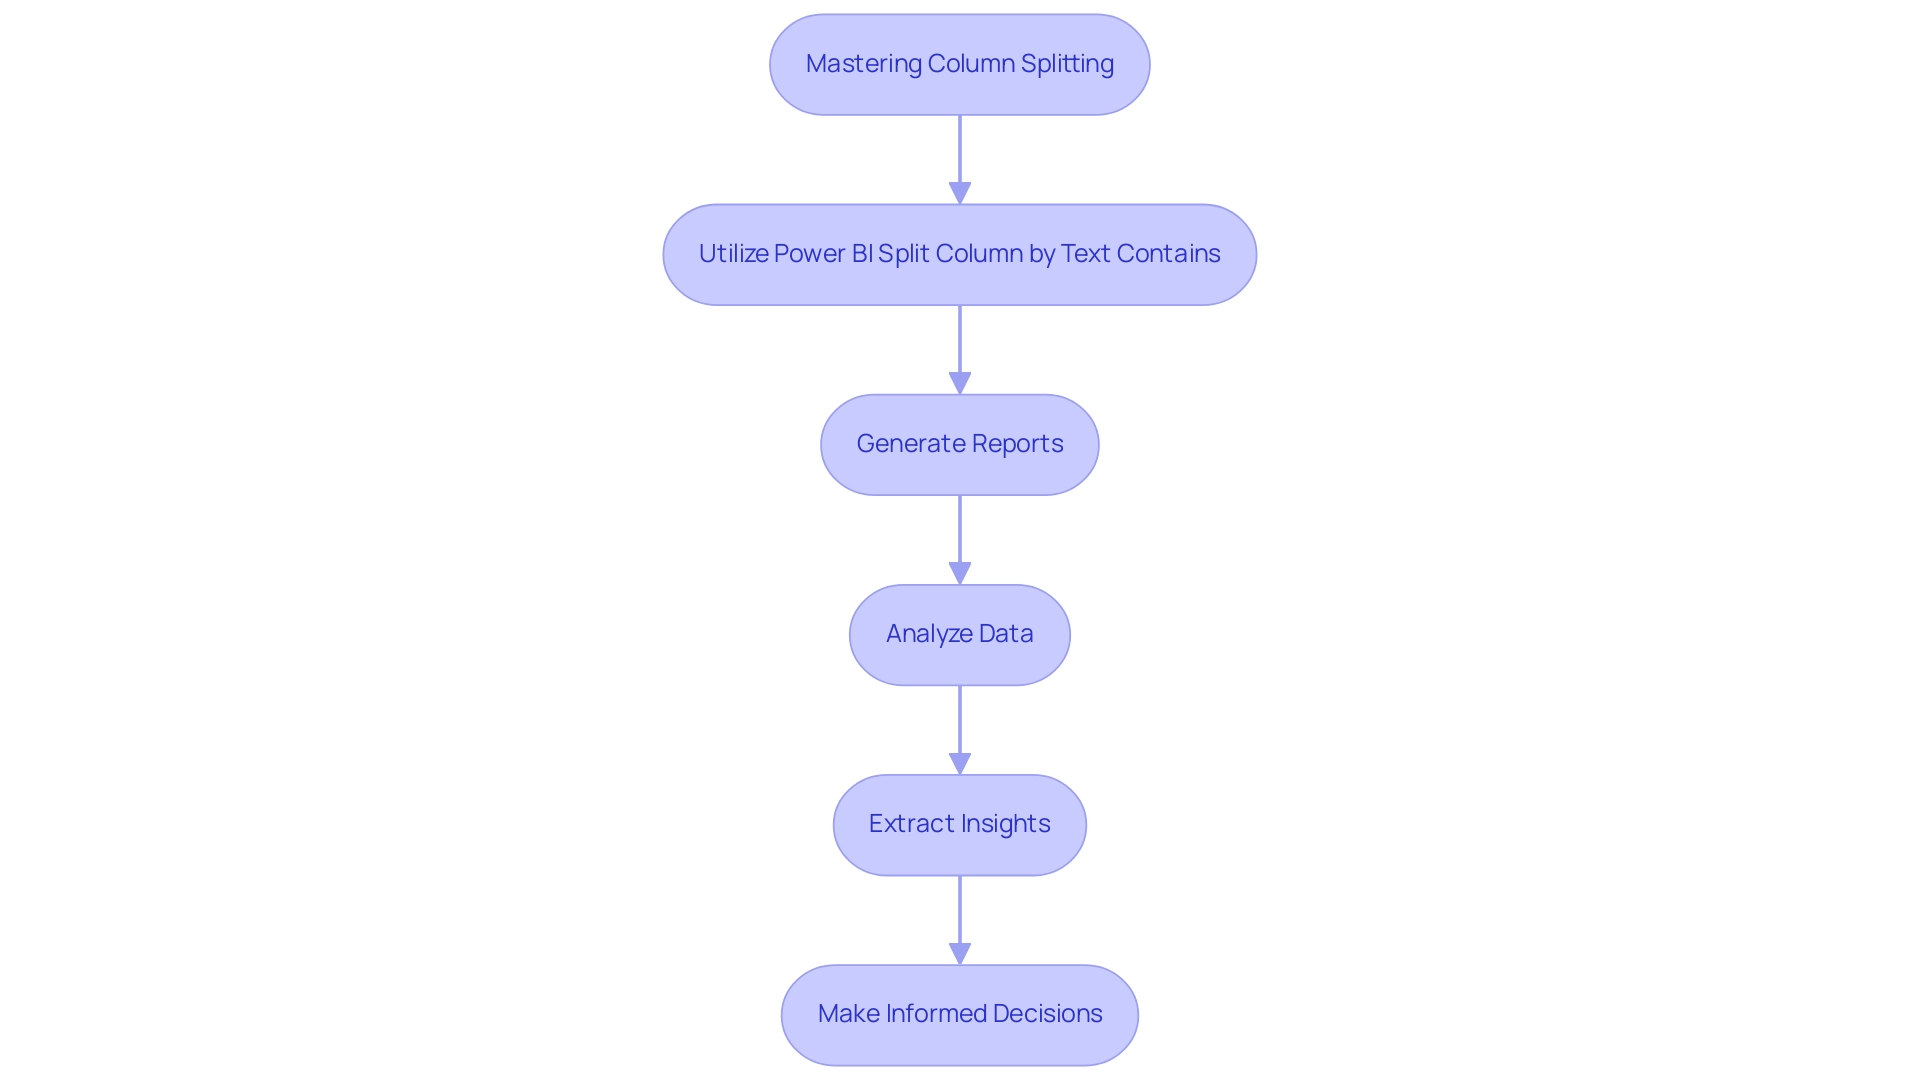
Achieving expertise in segmenting vertical sections in BI goes beyond simple technical skill; it serves as an essential aspect of successful analysis and reporting. This skill enables you to utilize the Power BI split column by text contains feature, improving your capability to manage and examine information. As a result, you can derive clearer insights that lead to more informed decision-making.
In today’s data-rich environment, failing to extract actionable insights can leave your business at a competitive disadvantage. Efficient methods, such as section division, can simplify the process of report generation and reduce inconsistencies, ensuring that your BI dashboards offer trustworthy insights. Furthermore, incorporating RPA solutions such as EMMA RPA and Automate can additionally improve operational efficiency by automating repetitive tasks, enabling you to concentrate on analysis rather than tedious processes.
For example, the case study on visual representation demonstrates how efficient partitioning can showcase information in visual forms such as charts and dashboards, making intricate information understandable and aiding in conveying results to stakeholders, which is vital for operational efficiency. Moreover, according to statistics, analytics enables businesses to comprehend their current target audience and identify gaps in products or services, reinforcing the significance of mastering information manipulation skills in Power BI. By honing your information manipulation skills, particularly through techniques like power bi split column by text contains and leveraging RPA tools, you position yourself to make impactful business decisions that resonate throughout your organization.
As Susan Hassett, an Enrollment Systems Analyst, noted, mastering data manipulation can drastically reduce the time spent on analysis, equipping professionals to continue learning and adapting in an ever-evolving field.
Conclusion
The effectiveness of column splitting in Power BI cannot be overstated. This essential technique not only allows users to dissect complex datasets into more manageable parts but also enhances clarity and usability in reporting. By implementing a systematic approach to splitting columns based on specific text conditions, analysts can streamline their processes, reduce inconsistencies, and ultimately drive more informed decision-making.
Following the step-by-step process outlined, users can effectively navigate Power BI, address common issues, and leverage advanced techniques to optimize their data manipulation tasks. The integration of Robotic Process Automation further elevates the potential of column splitting, allowing teams to focus on strategic analysis rather than getting bogged down by repetitive tasks. This synergy not only improves operational efficiency but also fosters an environment of continuous improvement and innovation.
In a landscape where data-driven insights are paramount, mastering column splitting equips professionals with the tools necessary to unlock the full potential of their datasets. By embracing these practices, organizations can transform their data analysis capabilities, ensuring that insights derived from Power BI dashboards are both actionable and impactful. Ultimately, the ability to manipulate data effectively sets the foundation for strategic growth and sustained competitive advantage in today’s fast-paced business world.

