Overview:
Navigating the Power BI Visual Marketplace involves a straightforward process that allows users to enhance their data visualizations with custom visuals tailored for various reporting needs. The article outlines a step-by-step guide for accessing, installing, and customizing these visuals, emphasizing their role in transforming complex data into clear insights that facilitate effective decision-making and storytelling.
Introduction
In the realm of data visualization, the Power BI Visual Marketplace stands out as an invaluable resource for organizations seeking to elevate their reporting capabilities. This vibrant hub is filled with custom visuals that not only enhance the presentation of data but also tackle common operational challenges such as time-consuming report creation and data inconsistencies.
With offerings from both Microsoft and innovative third-party developers, users can access a diverse range of tools designed to transform complex datasets into clear, actionable insights. As the demand for personalized data solutions continues to rise, understanding how to navigate this marketplace is essential for unlocking the full potential of Power BI, ensuring that data storytelling resonates with stakeholders and drives informed decision-making.
Introduction to the Power BI Visual Marketplace
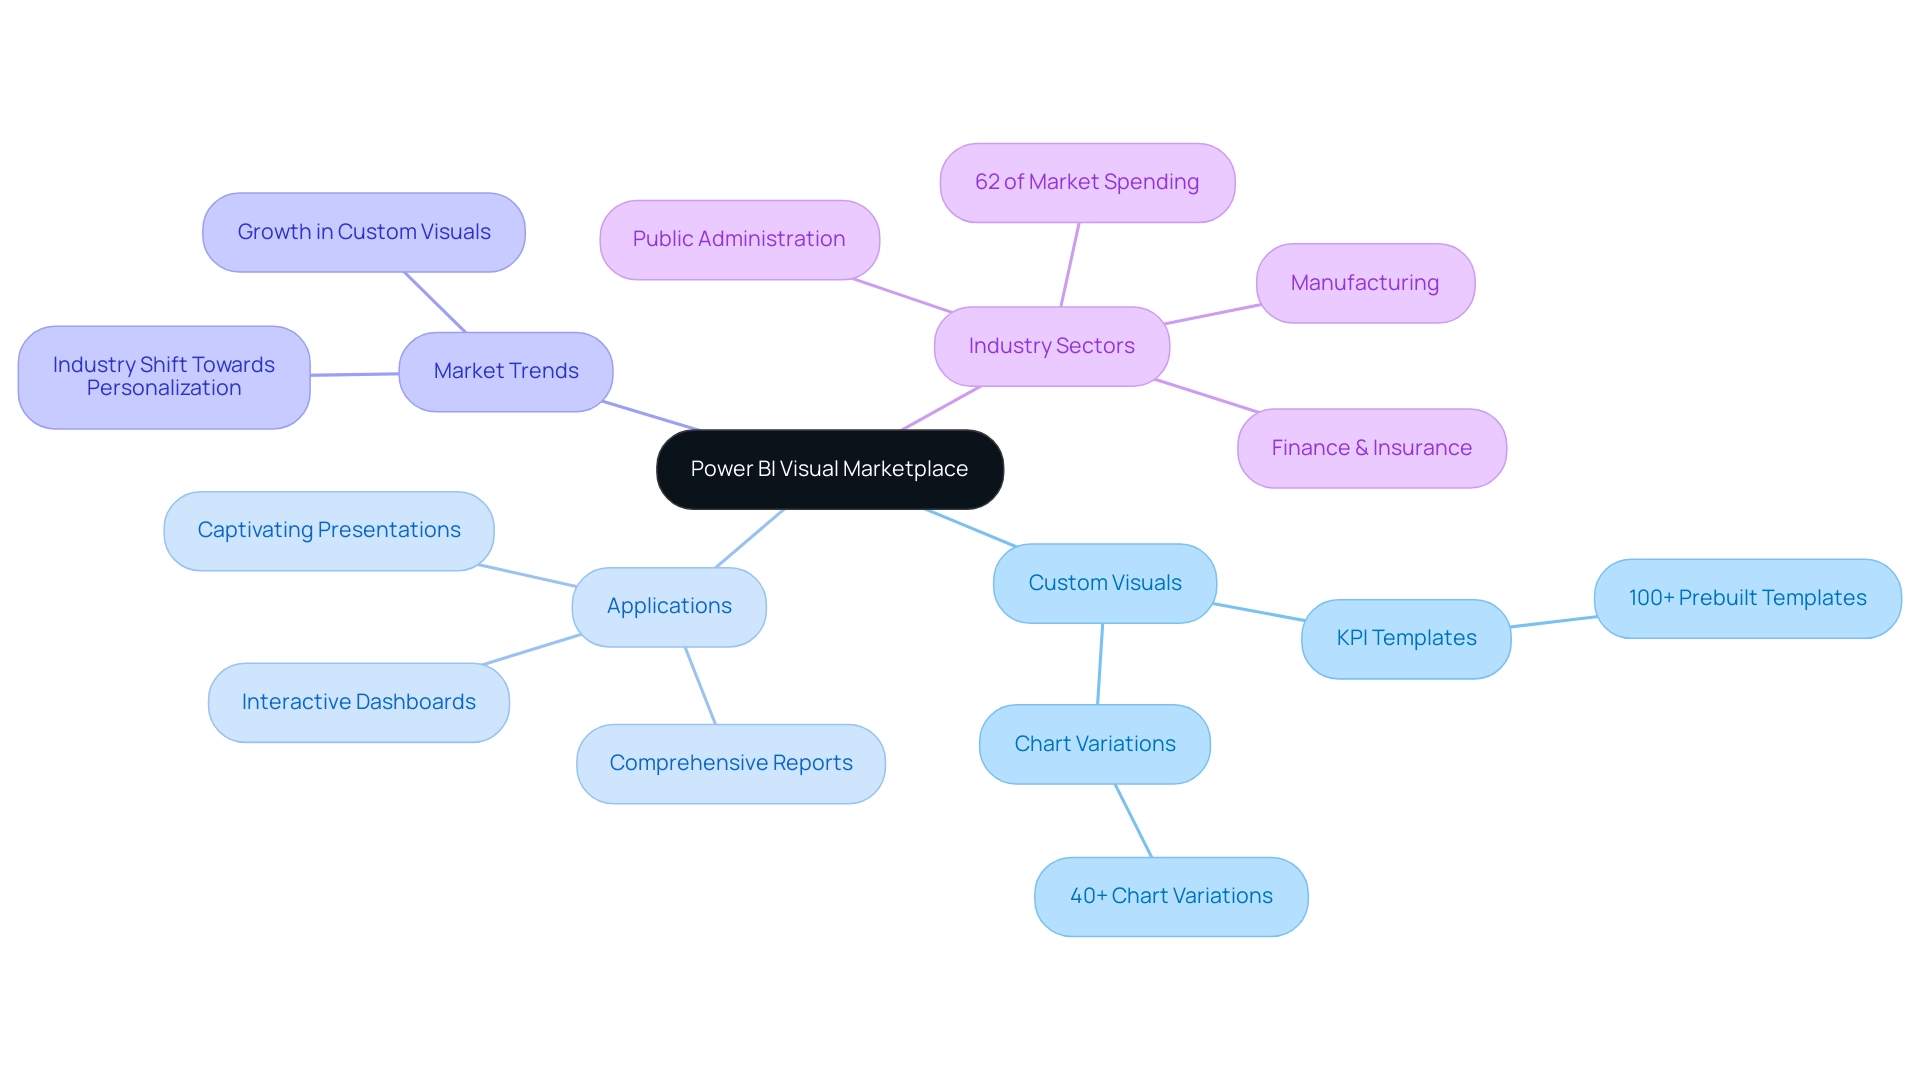
The Power BI Visual Marketplace serves as a dynamic hub for custom representations designed to enhance your information visualization capabilities. This extensive repository showcases a collection of images crafted by Microsoft, alongside innovative offerings from third-party developers, such as KPI by Powerviz, which boasts over 100 prebuilt KPI templates and 40 chart variations. Users can greatly enhance functionality beyond standard visualizations, tackling common challenges such as time-consuming documentation creation and inconsistencies in information.
Importantly, these visuals also offer actionable guidance, transforming complex information into clear insights that drive decision-making. Each visual is tailored to enhance specific aspects of information presentation, whether for interactive dashboards, comprehensive reports, or captivating presentations. By learning to navigate the Power BI Visual Marketplace efficiently, you can unlock the full potential of your Business Intelligence experience, ensuring that your storytelling through information resonates with your audience.
Enterprise Account Director Kevin Scott emphasizes this potential, stating, ‘In this step-by-step video, I showcase how one of my customers leveraged HG Insights’ Technology Intelligence to uncover a $200M opportunity in the Business Intelligence market.’ Recent trends indicate remarkable growth in custom visuals within the Power BI Visual Marketplace, reflecting a broader industry shift towards personalized and impactful visualization solutions. Additionally, the Finance & Insurance, Manufacturing, and Public Administration sectors collectively account for 62% of the overall market spending on BI software, highlighting the significant demand and opportunity for BI solutions.
Embracing these tools not only enhances your reporting capabilities but also fosters a data-driven culture that drives business growth.
Step-by-Step Guide to Navigating the Marketplace
Navigating the power bi visual marketplace is a straightforward process that opens up a world of interactive information presentation and storytelling. By leveraging Business Intelligence tools, you can combat challenges such as time-consuming document creation and data inconsistencies, which often hinder operational efficiency. Furthermore, incorporating RPA solutions such as EMMA and Automation can further streamline these processes.
Follow these steps to enhance your reports:
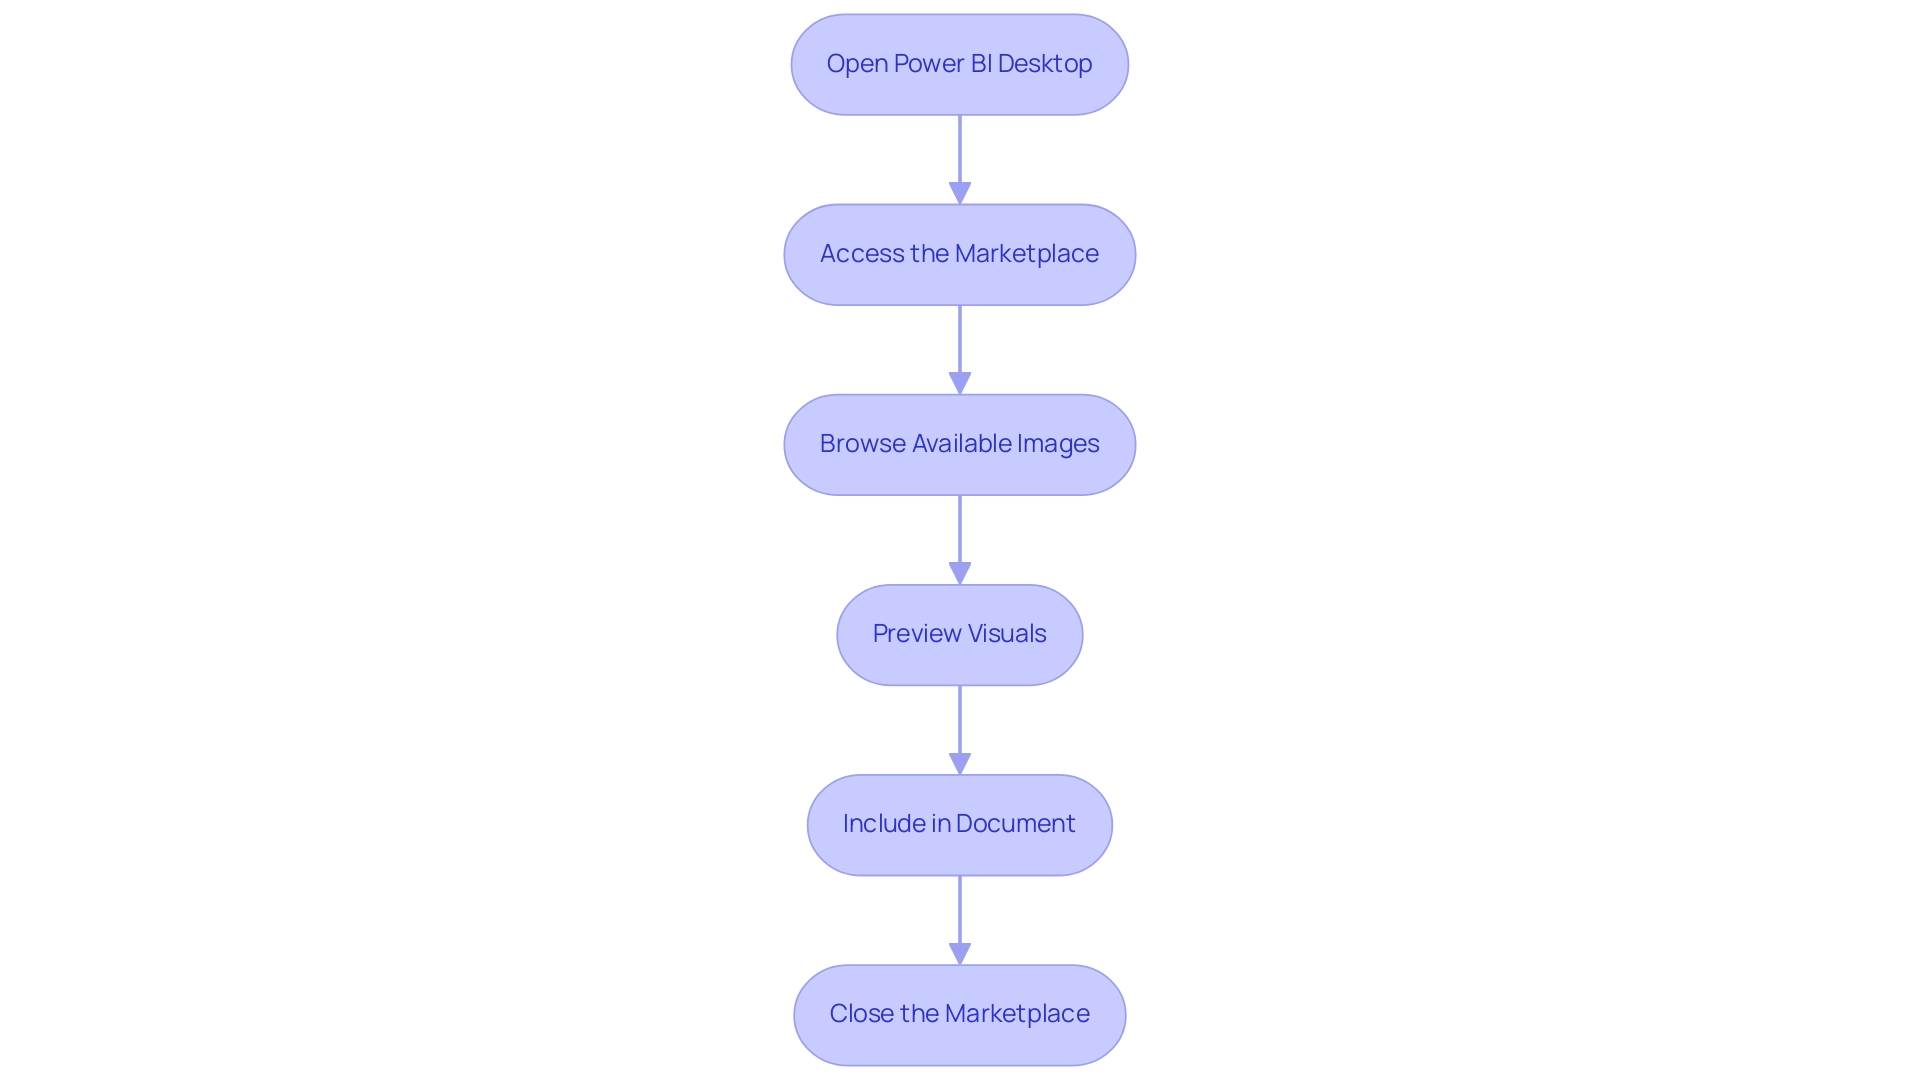
- Open Power BI Desktop: Begin by launching the application on your computer, setting the stage for your data exploration.
- Access the Marketplace: In the ‘Visualizations’ pane on the right-hand side, click the three dots (ellipsis) at the bottom; this action will lead you straight into the marketplace, brimming with possibilities.
- Browse Available Images: Take your time to explore various categories or use the search bar to pinpoint specific images tailored to your objectives. The wealth of options available will empower you to find exactly what you need.
- Preview Visuals: Click on any visual that catches your interest to view detailed information, including screenshots, descriptions, and user ratings.
This insight will assist you in making informed choices about which images best fit your narrative.
Include in Document: Once you find a visual that aligns with your vision, just click ‘Add’ to effortlessly integrate it into your document, improving your storytelling abilities.
Close the Marketplace: After adding your selected visuals, close the marketplace to return to your report, prepared to present your information in a compelling manner.
By effectively utilizing the power bi visual marketplace, along with RPA solutions, you can transform raw information into impactful narratives that drive meaningful action and address common challenges in information management. Remember the insightful words of Darya Yatchenko, Lead Technical Writer:
Remember, data visualization is not just about presenting information, but also about telling a story and driving meaningful action.
Furthermore, consider the value proposition of acquiring BI Pro with Microsoft 365 applications for one low price per user, ensuring you have access to industry-leading security.
Should you need assistance, technical support for BI can be accessed through Microsoft Fabric, providing essential resources for your navigation. Embrace these tools to elevate your operational efficiency and lead your organization toward data-driven decision-making.
Installing Visuals from the Power BI Marketplace
Installing visuals from the Power BI Marketplace can be a straightforward process when following these essential steps:
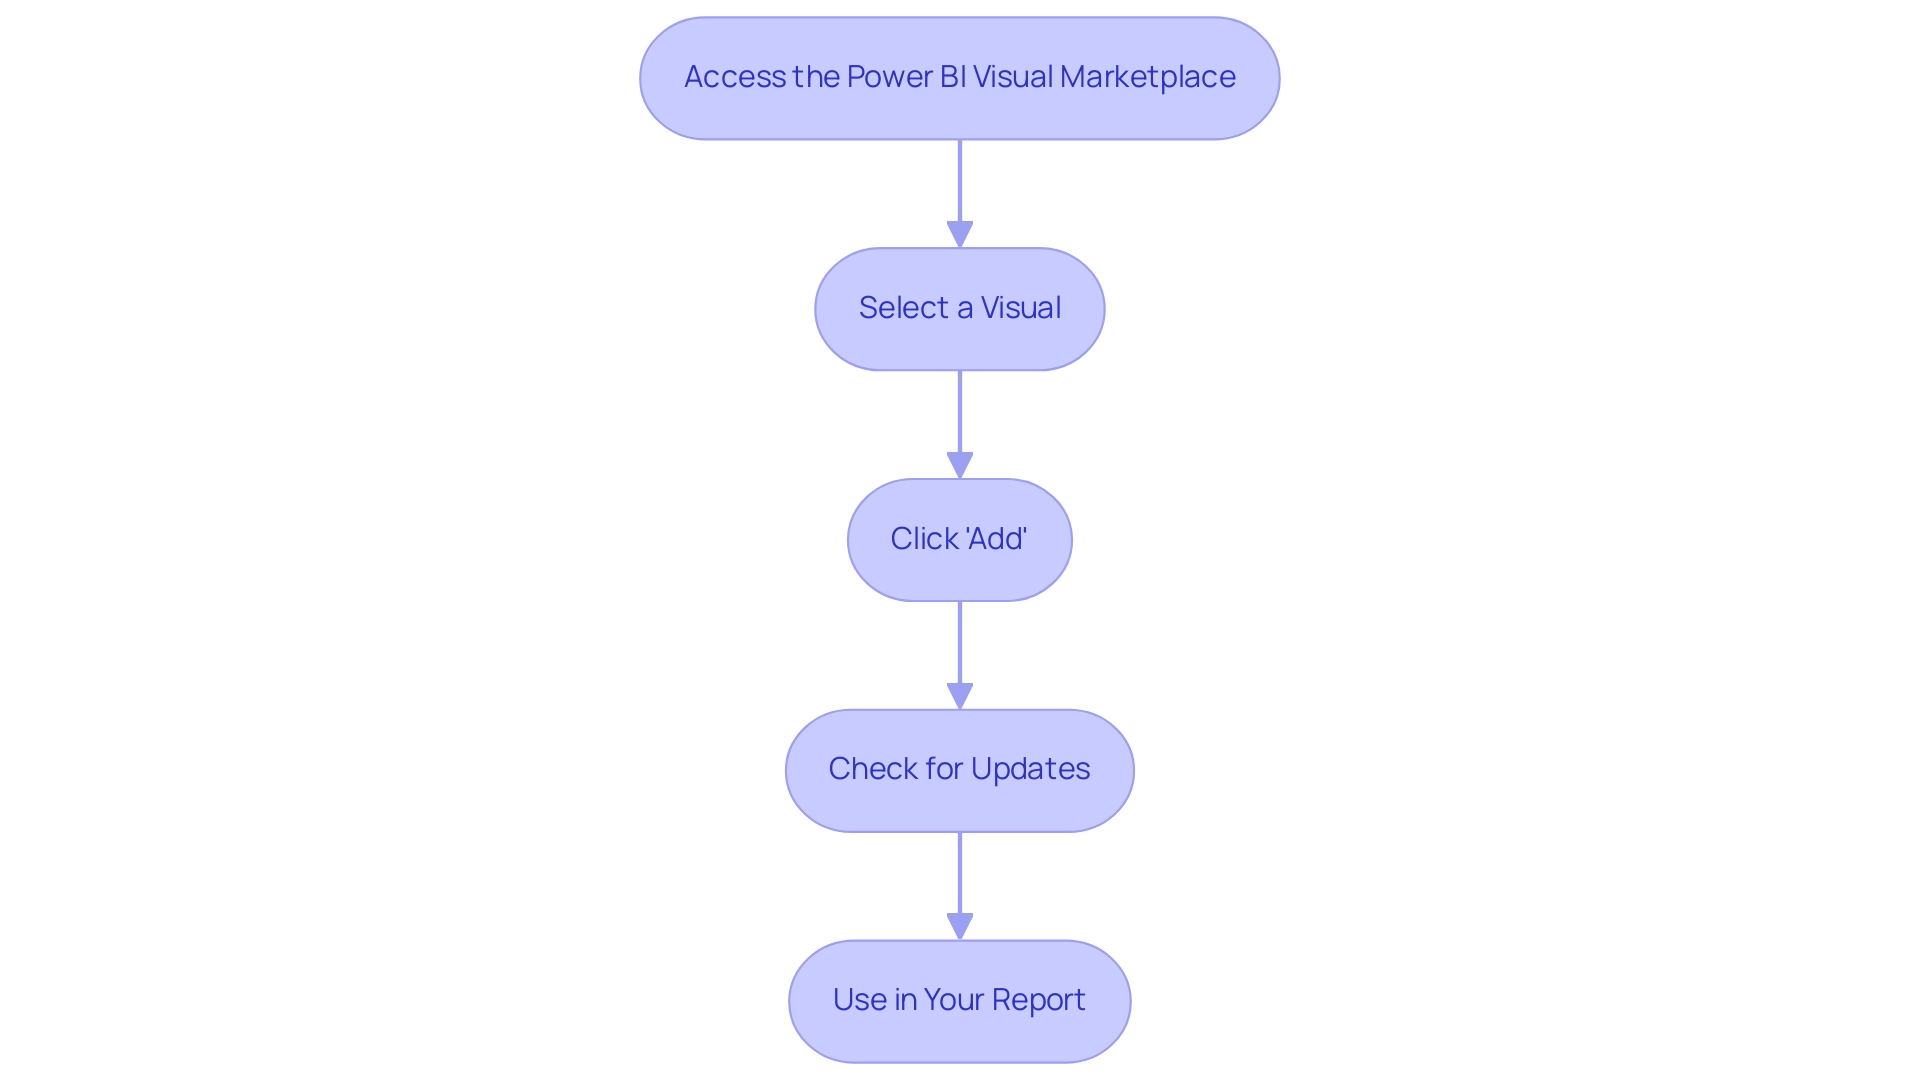
- Access the Power BI visual marketplace: Begin by navigating to the Visualizations pane to open the Power BI visual marketplace, where a variety of powerful tools await your exploration.
- Select a Visual: Browse through the diverse selection and click on any visual that piques your interest to view its detailed features and functionalities.
- Click ‘Add’: Once you’ve reviewed the visual, simply click the ‘Add’ button to seamlessly integrate it into your Power BI workspace.
- Check for Updates: Keeping your graphics current is crucial; check for updates regularly through the ‘Manage graphics’ option in the Visualizations pane to ensure optimal performance and access to new features.
- Use in Your Report: After installation, your new visual will appear in the Visualizations pane, ready to enhance your reports and engage your audience.
By utilizing these images from the Power BI visual marketplace, organizations like the Red Cross have transformed their fundraising strategies and gained deeper insights into donor behavior. The Red Cross encountered difficulties in handling donor information and evaluating the success of their fundraising campaigns, but with the integration of BI, they enhanced campaign performance and support efficiency through improved donor insights.
Additionally, the ‘Drill Down Timeline PRO’ feature allows users to conduct detailed examinations of timelines with customizable interactions, showcasing the versatility of BI visuals. As Ryan Majidimehr emphasizes, “We hope that these exciting new capabilities enable you to create and migrate even more BI semantic models to Direct Lake mode…” This highlights the significant potential for real-time analytics and AI integration that can drive effective decision-making and storytelling in your presentations.
Additionally, our BI services provide a 3-Day BI Sprint, which enables quick development of professionally crafted documents, and the General Management App, which offers thorough management and intelligent evaluations. With tools like RPA optimizing your processes and customized AI solutions improving information quality, you can overcome implementation challenges and utilize Business Intelligence effectively for informed decision-making.
Customizing Your Power BI Visuals
Customizing your Power BI visuals from the power bi visual marketplace is essential for creating impactful reports that drive actionable insights. With 2,501 users currently online, there’s a vibrant community engaged in improving their presentation skills. Here’s a streamlined approach to enhance your information presentations:
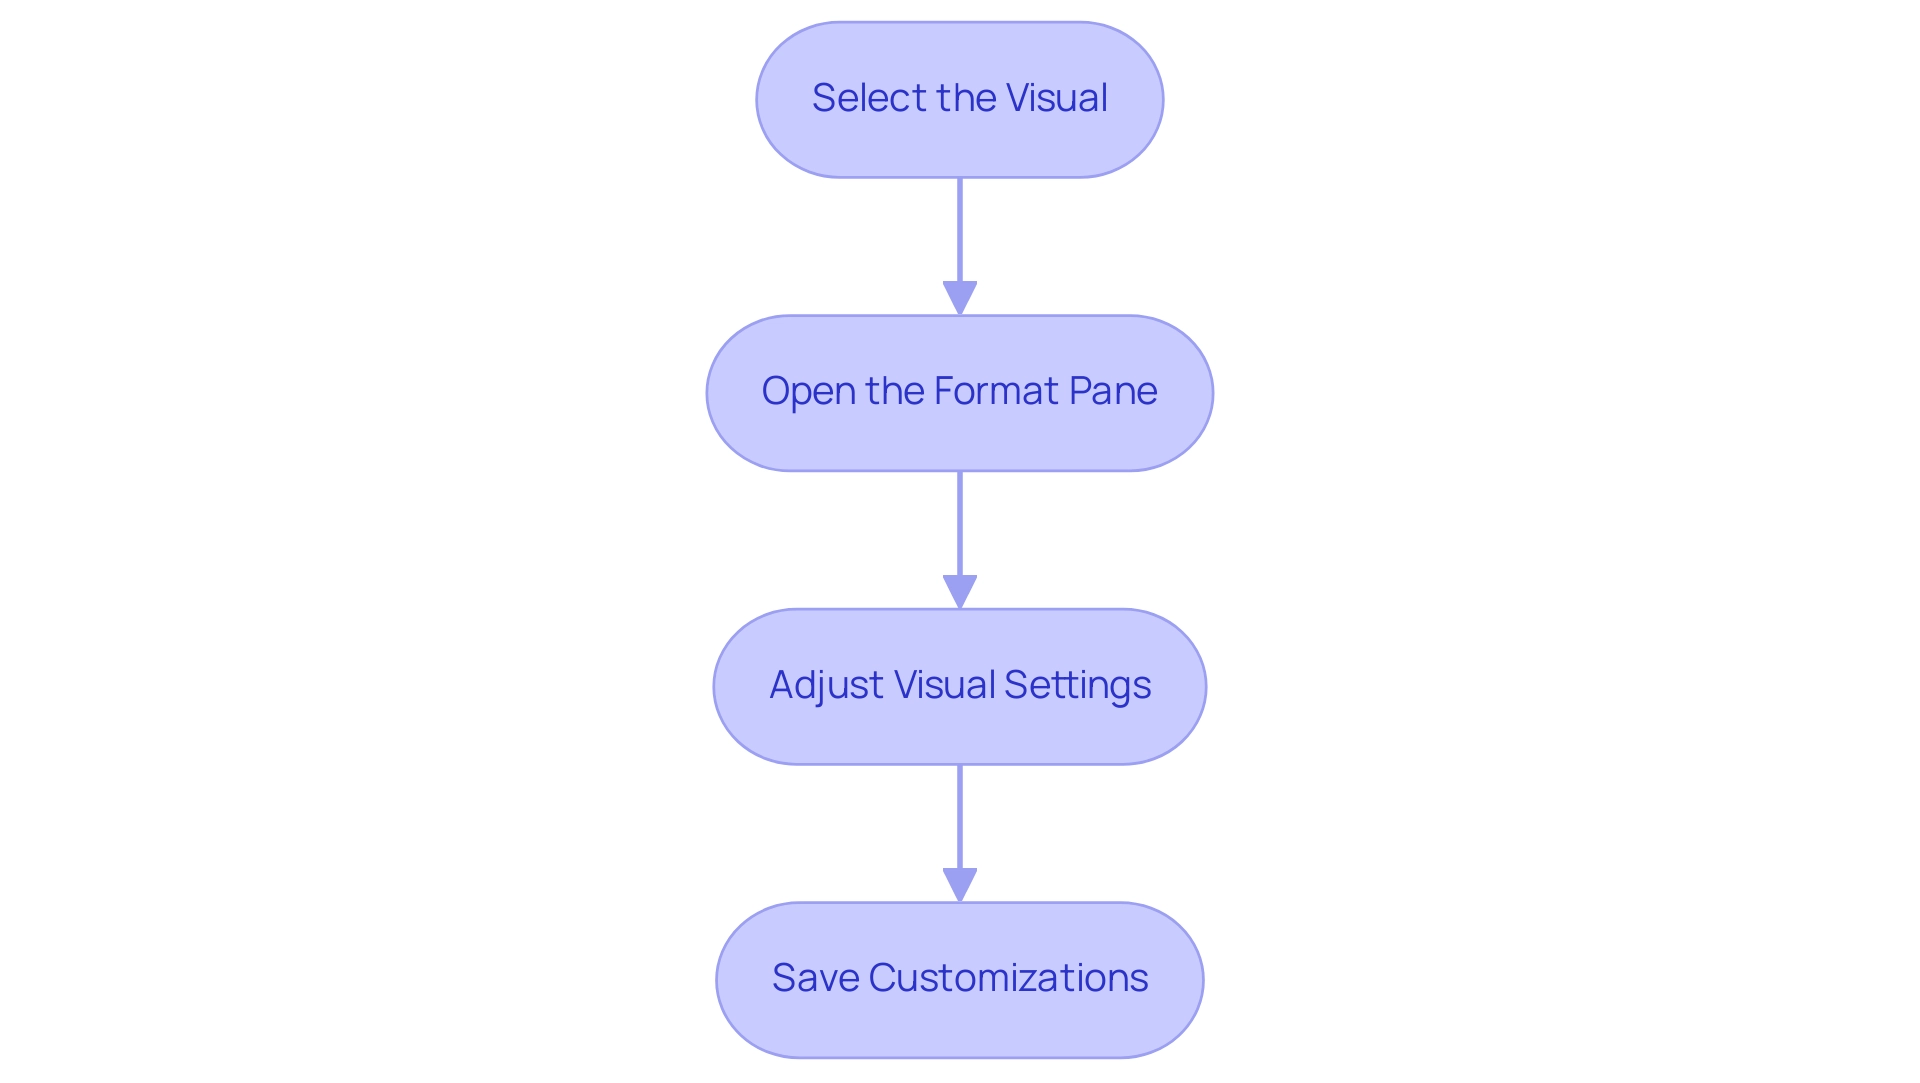
- Select the Visual: Start by clicking on the visual you want to customize within your document. This foundational step allows you to focus your modifications where they matter most.
- Open the Format Pane: Navigate to the Visualizations pane and click the paint roller icon. This action opens a range of formatting options, providing you with the tools needed to personalize your visual effectively.
- Adjust Visual Settings: Dive into the settings to modify aspects like colors, labels, titles, and data fields. This is your opportunity to tailor the visual to meet your specific reporting requirements. For example, the customization of visuals is facilitated in BI mobile applications for iOS and Android tablets, ensuring your documents are accessible on various devices. Don’t hesitate to experiment with various styles to discover which combinations yield the best results for your audience.
- Save Customizations: After making your desired changes, remember to save your document. This step is crucial to ensure that all customizations are retained and will be available for future presentations in the Power BI visual marketplace.
To illustrate the impact of customization, consider the case study of the Chiclet Slicer, which can be found in the Power BI visual marketplace. This tool acts as an interactive filter that enhances the visual appeal of documents. By using chiclet slicers, users can filter information with different colors, layouts, and images, effectively streamlining exploration and analysis. However, numerous organizations encounter obstacles like information inconsistencies across documents and a deficiency of actionable direction, which can diminish the effectiveness of their insights.
Utilizing our 3-Day BI Sprint can speed up your document creation process, while the General Management App offers thorough management and intelligent reviews to tackle these challenges. By adhering to these steps and employing these powerful tools, you can significantly improve the impact of your documents, making information storytelling more captivating and informative.
Benefits and Limitations of Power BI Visuals
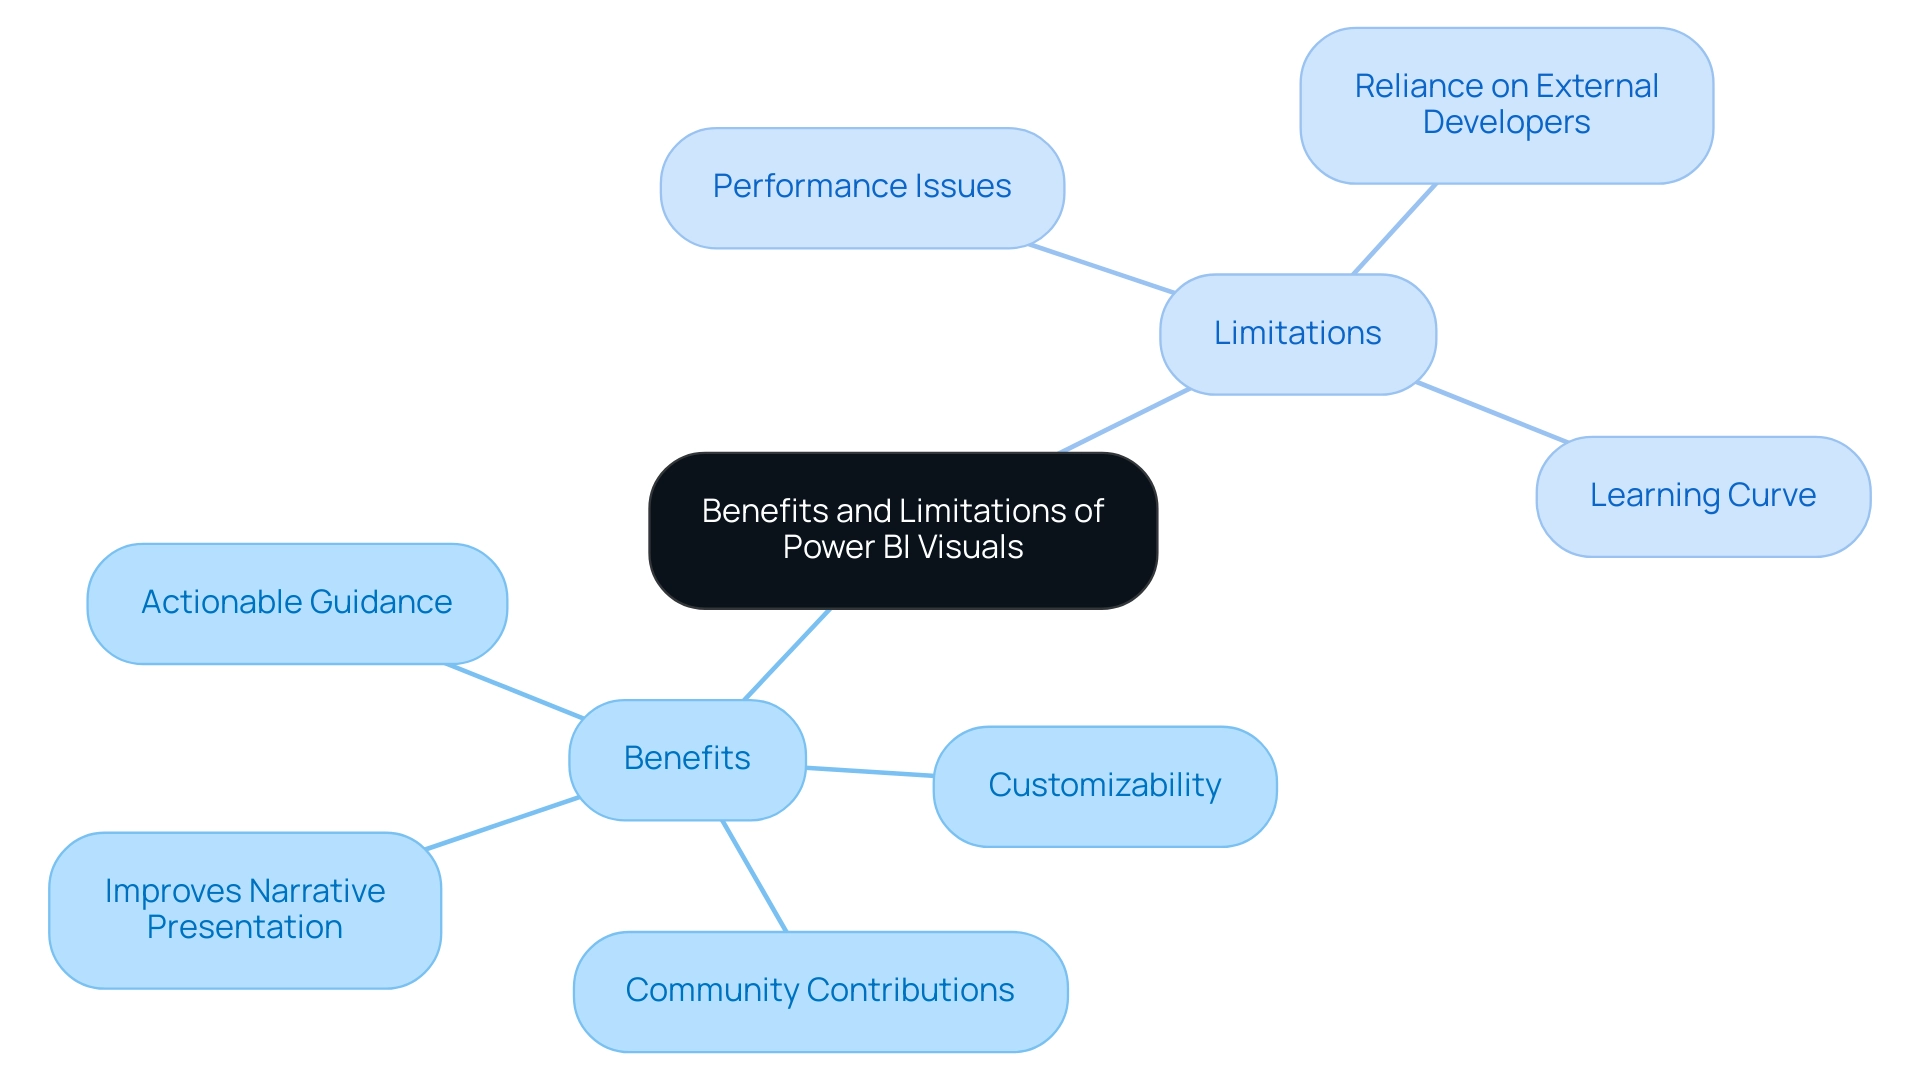
Utilizing graphics from the power bi visual marketplace can greatly improve narrative presentation while tackling typical issues encountered in operational efficiency. Custom visuals can transform information into engaging narratives, making it easier for stakeholders to grasp key insights quickly—an essential need given the often time-consuming nature of report creation. Furthermore, the range of options accessible enables customized presentations that connect with varied audiences, addressing the problem of inconsistencies effectively.
Community contributions bring innovative solutions to the table, fostering a dynamic ecosystem that continuously evolves to meet users’ needs.
A case study titled Benefits of Custom Charts in Power BI highlights that while Power BI’s default charts are versatile, custom charts enhance storytelling, providing specialized visualizations that improve engagement and brand consistency. Importantly, these custom representations can also provide actionable guidance, assisting stakeholders in understanding the next steps based on the data presented. This addresses the frequent issue where documents are filled with numbers and graphs yet lack clear direction.
However, there are limitations to consider. Some custom graphics, particularly complex ones, may impact report performance, leading to slower load times and a less responsive user experience. Additionally, reliance on external developers poses risks, especially if support ceases or updates are not provided, potentially leaving organizations with outdated tools.
The adoption of new visuals may also require users to invest time in learning how to effectively use and customize them, which could temporarily hinder productivity.
Recent updates to BI in April 2024 have introduced new features that may address some of these limitations, providing advanced functionalities to enhance visualizations. Daniel, a BI Super User, shared insights on the limitations of using these offerings:
“Regarding both questions, unfortunately not. I’d love to see both also… Not ideal outcomes but might give you some ideas.”
This emphasizes the significance of tackling specific issues through updates and enhancements to the visual listings in the power bi visual marketplace, including governance strategies that can reduce inconsistencies.
In summary, while personalized graphics in Business Intelligence offer thrilling opportunities for improved information presentation and actionable insights, it is essential to navigate their limitations carefully to ensure optimal performance and user satisfaction, while also implementing governance strategies to maintain information integrity.
Troubleshooting Common Issues with Power BI Visuals
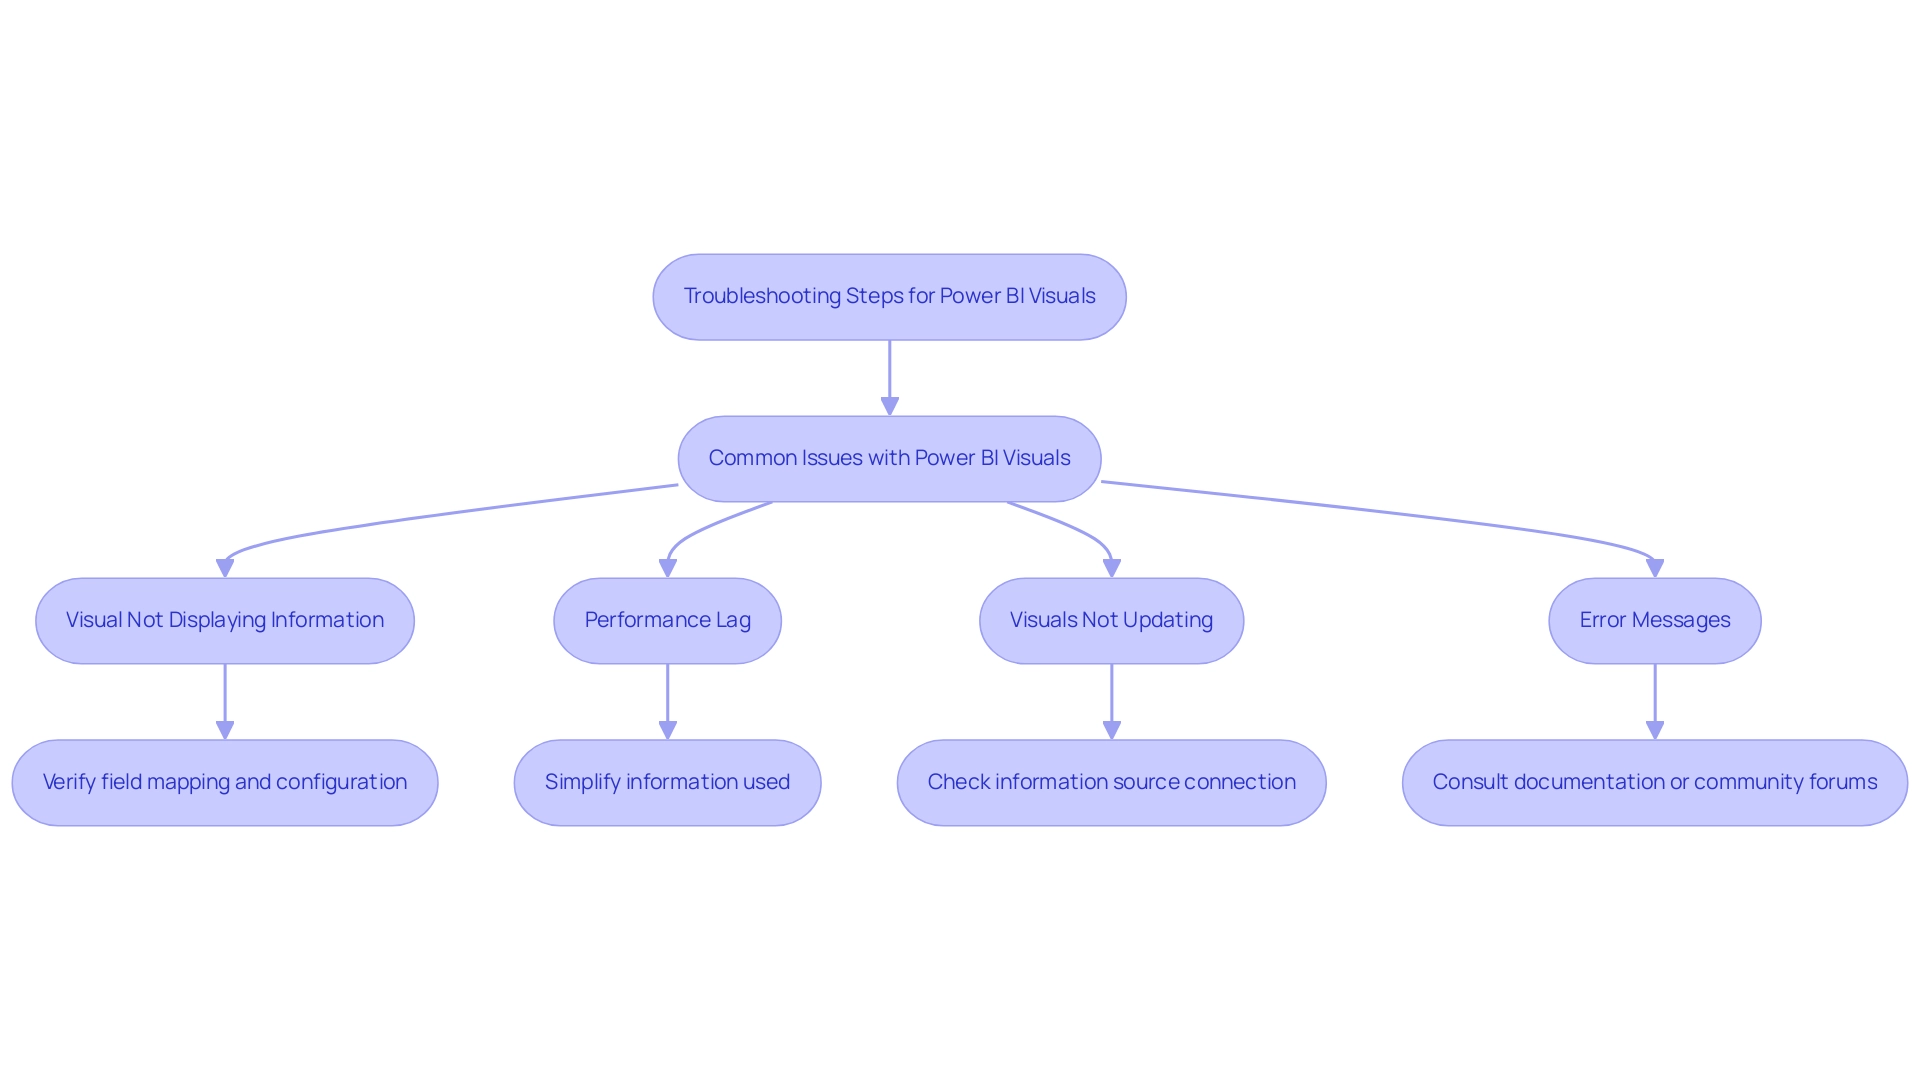
When utilizing Power BI visuals, you may encounter several common issues that can hinder your operational efficiency. Here’s how to effectively troubleshoot them, enhancing your data presentation and storytelling capabilities while considering the role of Robotic Process Automation (RPA) and tailored AI solutions in streamlining these processes:
-
Visual Not Displaying Information:
Start by verifying that the fields are accurately mapped within the visual settings. Ensure your information model is properly configured to avoid discrepancies. With over 15,000 related questions on StackOverflow about Power BI, it’s evident that many users face similar challenges. Implementing RPA can automate information preparation tasks, reducing the risk of mistakes in mapping. -
Performance Lag:
If you experience delays in visual loading, consider simplifying the information being utilized. Decreasing the quantity of points shown can significantly improve performance, making visuals more responsive. This is particularly important as Power BI is recognized for its user-friendliness compared to Tableau, impacting performance positively for less skilled users. Tailored AI solutions can also enhance queries, further improving loading times. -
Visuals Not Updating:
If your visuals fail to refresh, double-check that your information source is correctly connected. Remember to refresh your dataset within Power BI to reflect any changes. As Rico Zhou, a Community Support expert, advises, “To configure data refresh, you may need to install a gateway.” Automating this process through RPA can ensure that your visuals are always up-to-date without manual intervention. -
Error Messages:
Pay attention to any error messages that arise, as they often contain valuable insights into the underlying issues. For specific troubleshooting tips, consult the visual’s documentation or engage with community forums, where shared experiences can guide you through solutions. Leveraging AI can help in analyzing error patterns and suggesting potential fixes, enhancing your troubleshooting efficiency.
By addressing these common challenges and integrating RPA and AI solutions, you can not only optimize your experience with the Power BI visual marketplace but also enhance your organization’s ability to extract actionable insights, ultimately driving growth and innovation.
Conclusion
Unlocking the full potential of the Power BI Visual Marketplace can transform the way organizations approach data visualization and reporting. By leveraging custom visuals, users can enhance their storytelling capabilities, turning complex datasets into clear and actionable insights that resonate with stakeholders. The marketplace offers a diverse range of options, allowing for tailored presentations that address common challenges such as time-consuming report creation and data inconsistencies.
Navigating this vibrant hub is straightforward, empowering users to easily install, customize, and integrate visuals into their reports. With clear steps and practical guidance, organizations can overcome hurdles and streamline their data management processes. Moreover, the integration of Robotic Process Automation and tailored AI solutions can further enhance operational efficiency, ensuring that data remains accurate and up-to-date.
While the benefits of utilizing custom visuals are significant, it is essential to remain aware of potential limitations and challenges. By implementing effective governance strategies and troubleshooting common issues, organizations can maximize the performance of their Power BI experience. Ultimately, embracing the Power BI Visual Marketplace is not just about improving reporting capabilities; it is about fostering a data-driven culture that drives informed decision-making and fuels business growth. The time to elevate data storytelling is now—unlock the power of visualization and lead your organization toward a more insightful future.

