Overview
In Excel, the primary function for comparing all other rows with the first row is the IF function. This powerful tool evaluates whether values in subsequent rows align with those in the first row. By employing the IF function, professionals can significantly enhance data accuracy and operational efficiency.
Furthermore, integrating tools like conditional formatting allows for the swift identification of discrepancies, ensuring consistency across datasets. This approach not only streamlines data management but also empowers users to maintain high standards in their analytical processes.
Introduction
In the realm of data management, the ability to compare rows in Excel is a pivotal skill for ensuring accuracy and consistency across datasets. As organizations grapple with the challenges posed by unstructured data and inconsistencies, mastering row comparison techniques becomes essential. This article delves into the intricacies of row comparison, highlighting its significance in data validation, error detection, and operational efficiency.
By leveraging advanced Excel functions like IF, COUNTIF, and VLOOKUP, alongside integrating Robotic Process Automation (RPA) for streamlined workflows, users can enhance their data management practices. Practical examples and common challenges will be explored, providing readers with a comprehensive understanding of how to effectively utilize row comparison techniques. This knowledge will drive informed decision-making and foster a culture of data integrity within organizations.
Understanding Row Comparison in Excel
Row comparison in Excel is an essential technique that evaluates information in one row against another to reveal similarities or discrepancies. Specifically, it addresses the function needed to compare all other rows with the first row. This process is crucial for information validation, error checking, and maintaining consistency across datasets. Organizations often face substantial inconsistencies due to a lack of governance strategies, leading to confusion and distrust in the presented details.
Given that approximately 80% of current information is unstructured, effective row comparison techniques are increasingly vital for ensuring information integrity and enhancing decision-making.
In environments where precise information is critical for informed decisions, users can quickly identify inconsistencies by systematically comparing rows. This raises the question of what function would be used for comparing all other rows with the first row. For instance, a company that utilized the Astera Pipeline Builder from Creatum GmbH to verify and purify customer information found that correcting errors in their Excel files significantly improved their email marketing initiatives, resulting in higher revenue and more strategic insights. This underscores how effective row comparison techniques can directly contribute to operational success and drive data-driven insights.
Moreover, leveraging Robotic Process Automation (RPA) can streamline these manual workflows, reducing errors and allowing teams to focus on more strategic tasks. As organizations navigate the rapidly evolving AI landscape, combining RPA with traditional information management practices can enhance operational efficiency and support continuous improvement in validation processes. It is essential that reports provide clear, actionable guidance to stakeholders, ensuring that information is not only presented but also accompanied by next steps for decision-making.
Experts recommend routine assessments and updates to validation guidelines in spreadsheets to maintain their relevance and efficiency, emphasizing the importance of upholding information integrity. As noted by a researcher, “Excel is a highly trusted and user-friendly tool for information visualization, offering an intuitive interface, visually appealing graphics, and strong functionality that make it a preferred choice for students and professionals alike.”
Information analysts have observed that enhancing productivity through row evaluation prompts the question of what function would be used to compare all other rows with the first row. This not only streamlines workflows but also fosters a culture of precision and reliability in information management. Incorporating row comparison techniques into daily operations, alongside RPA, can lead to significant improvements in operational efficiency. As organizations increasingly rely on information-based insights, mastering this skill in a spreadsheet program is not just beneficial but essential for anyone involved in information management.
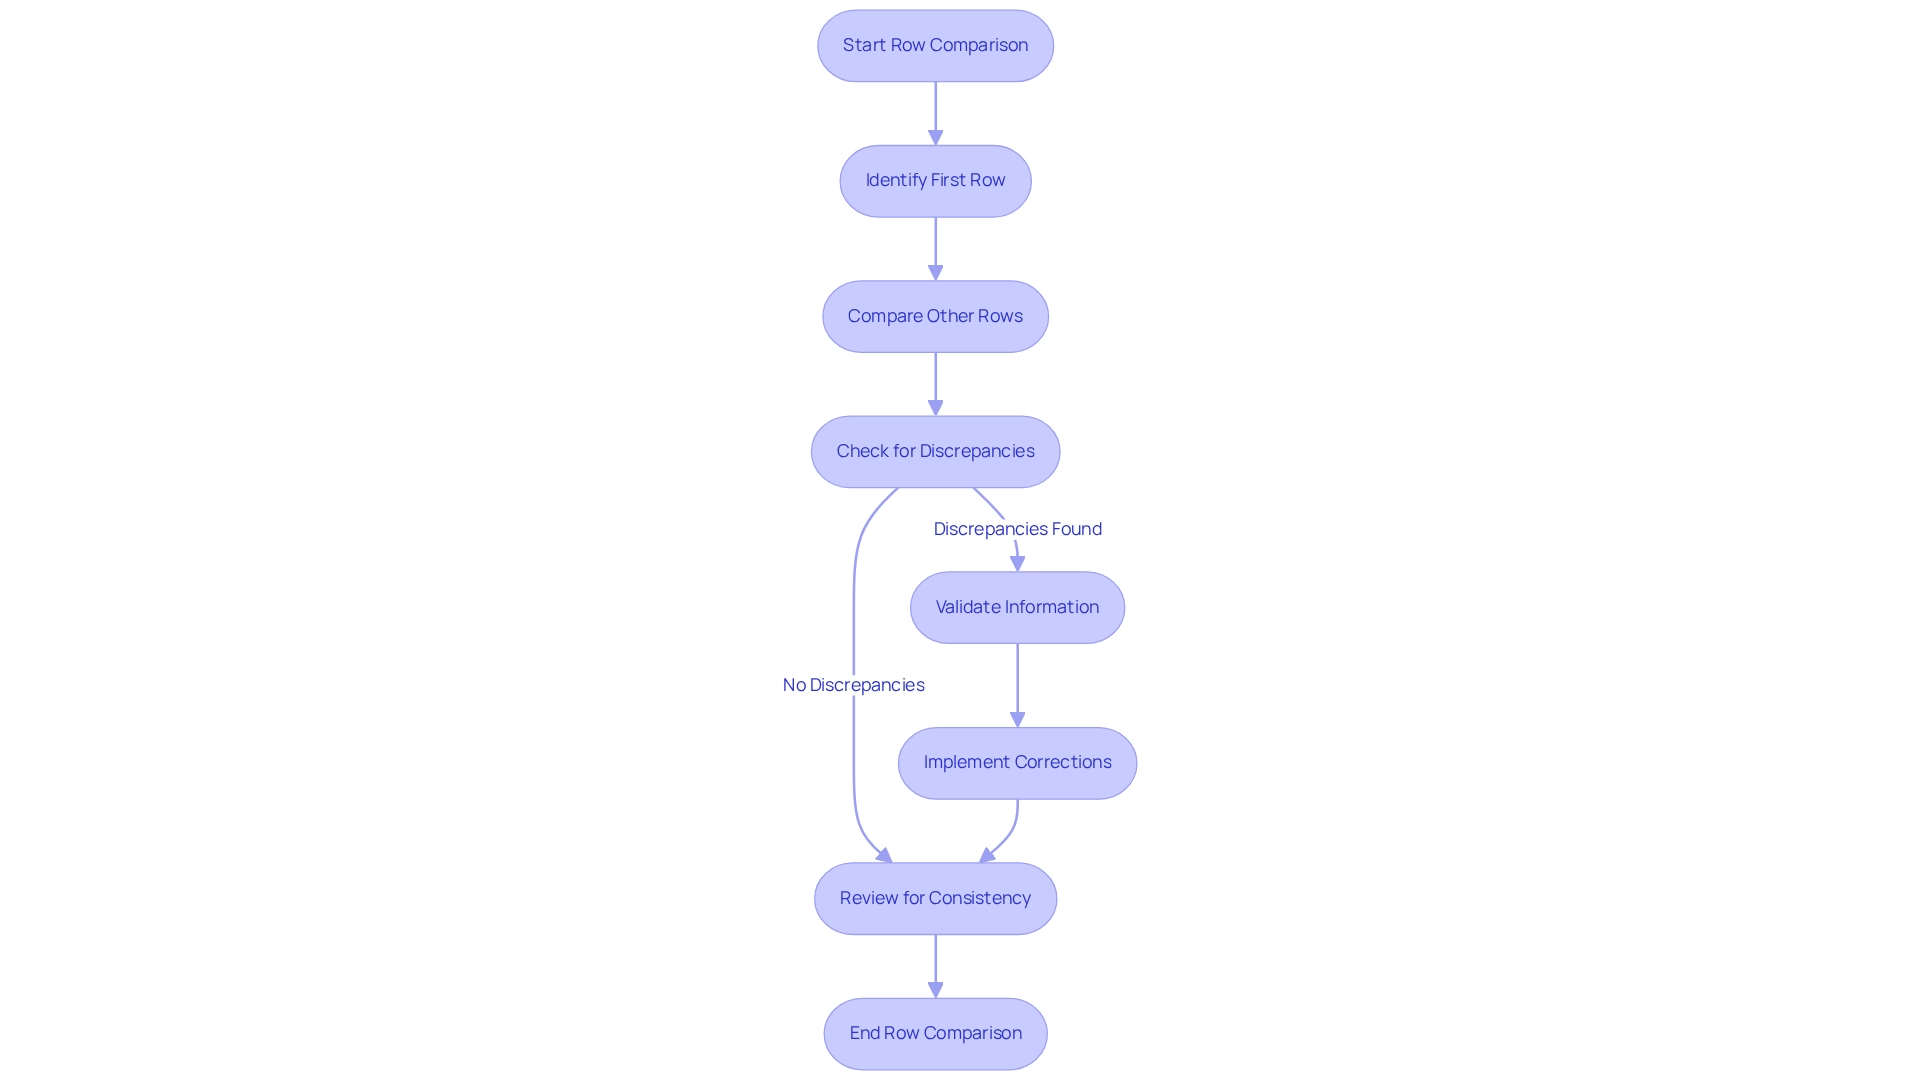
Why Compare Rows with the First Row?
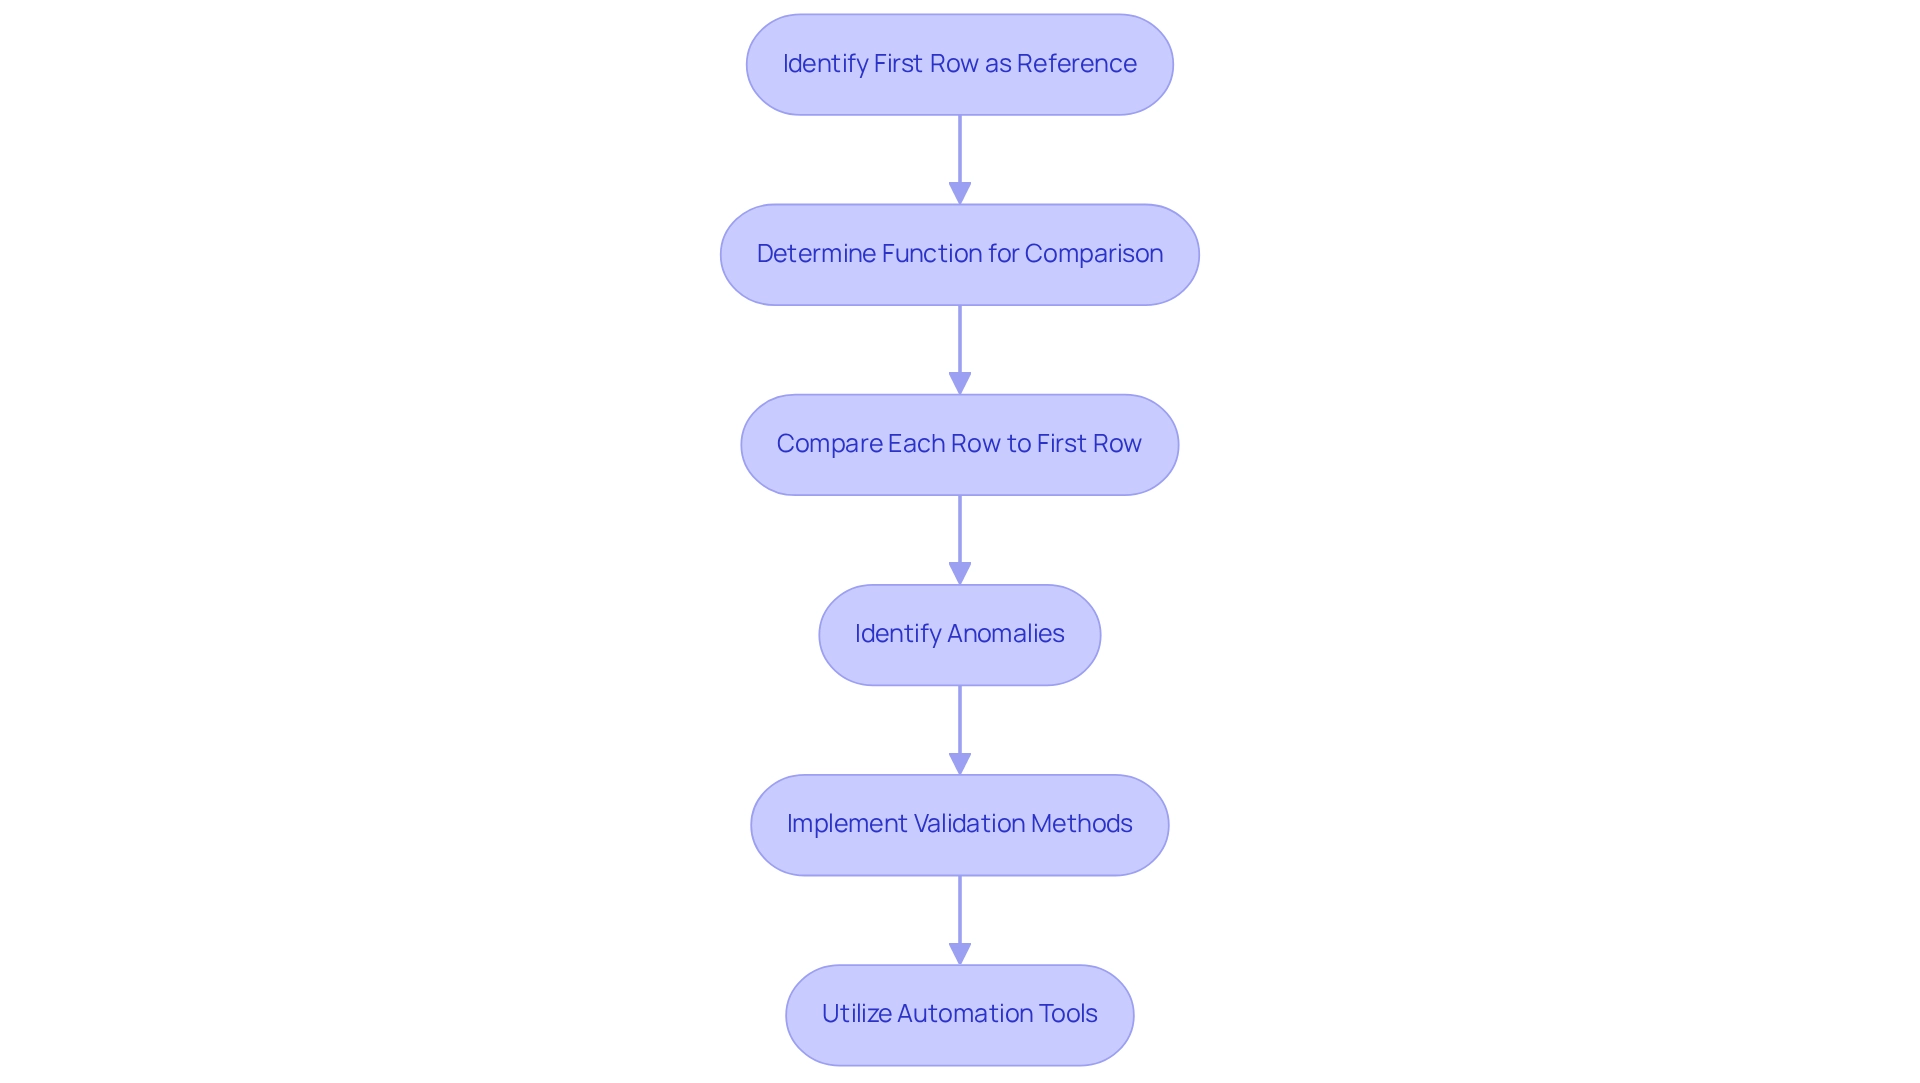
A fundamental practice in Excel involves contrasting rows with the initial row, particularly when determining the appropriate function to compare all other rows against the first row, which often serves as a header or standard for subsequent entries. This contrast is vital for swiftly identifying irregularities or deviations from expected values, crucial for maintaining information integrity. Statistics reveal that anomalies occur in approximately 20% of datasets, emphasizing the necessity for rigorous validation methods.
By establishing the first row as a reference point, users can effectively ascertain the function required to compare all other rows with it, ensuring accuracy and reliability.
In quality control processes, this method proves invaluable. Organizations that routinely apply row comparisons frequently report significant improvements in information accuracy, leading to enhanced decision-making outcomes. A case study involving a financial institution demonstrated how they employed the function to detect discrepancies early, resulting in a 30% reduction in reporting errors.
This aligns with the capabilities of AI-powered models, such as those offered by Creatum GmbH, which enhance traditional methods through machine learning to minimize false positives and reveal hidden risks.
Experts emphasize that this practice not only elevates information quality but also streamlines workflows. As one quality control expert noted, “Ensuring information integrity through row evaluation is crucial for efficient analysis and reporting.” This approach allows teams to focus on strategic initiatives rather than being bogged down by inaccuracies. Furthermore, leveraging Robotic Process Automation (RPA) can automate these manual validation tasks, boosting operational efficiency in an increasingly dynamic AI landscape.
Creatum GmbH also delivers near real-time anomaly detection in financial workflows, enabling organizations to respond proactively to risks.
Current trends in quality assurance increasingly utilize Excel’s row evaluation features, with companies embracing automated solutions for real-time information validation. This shift towards automation reflects a broader movement in information management, where efficiency and accuracy are paramount. By prioritizing evaluations with the first row, businesses can ensure that their data remains a reliable foundation for informed decision-making.
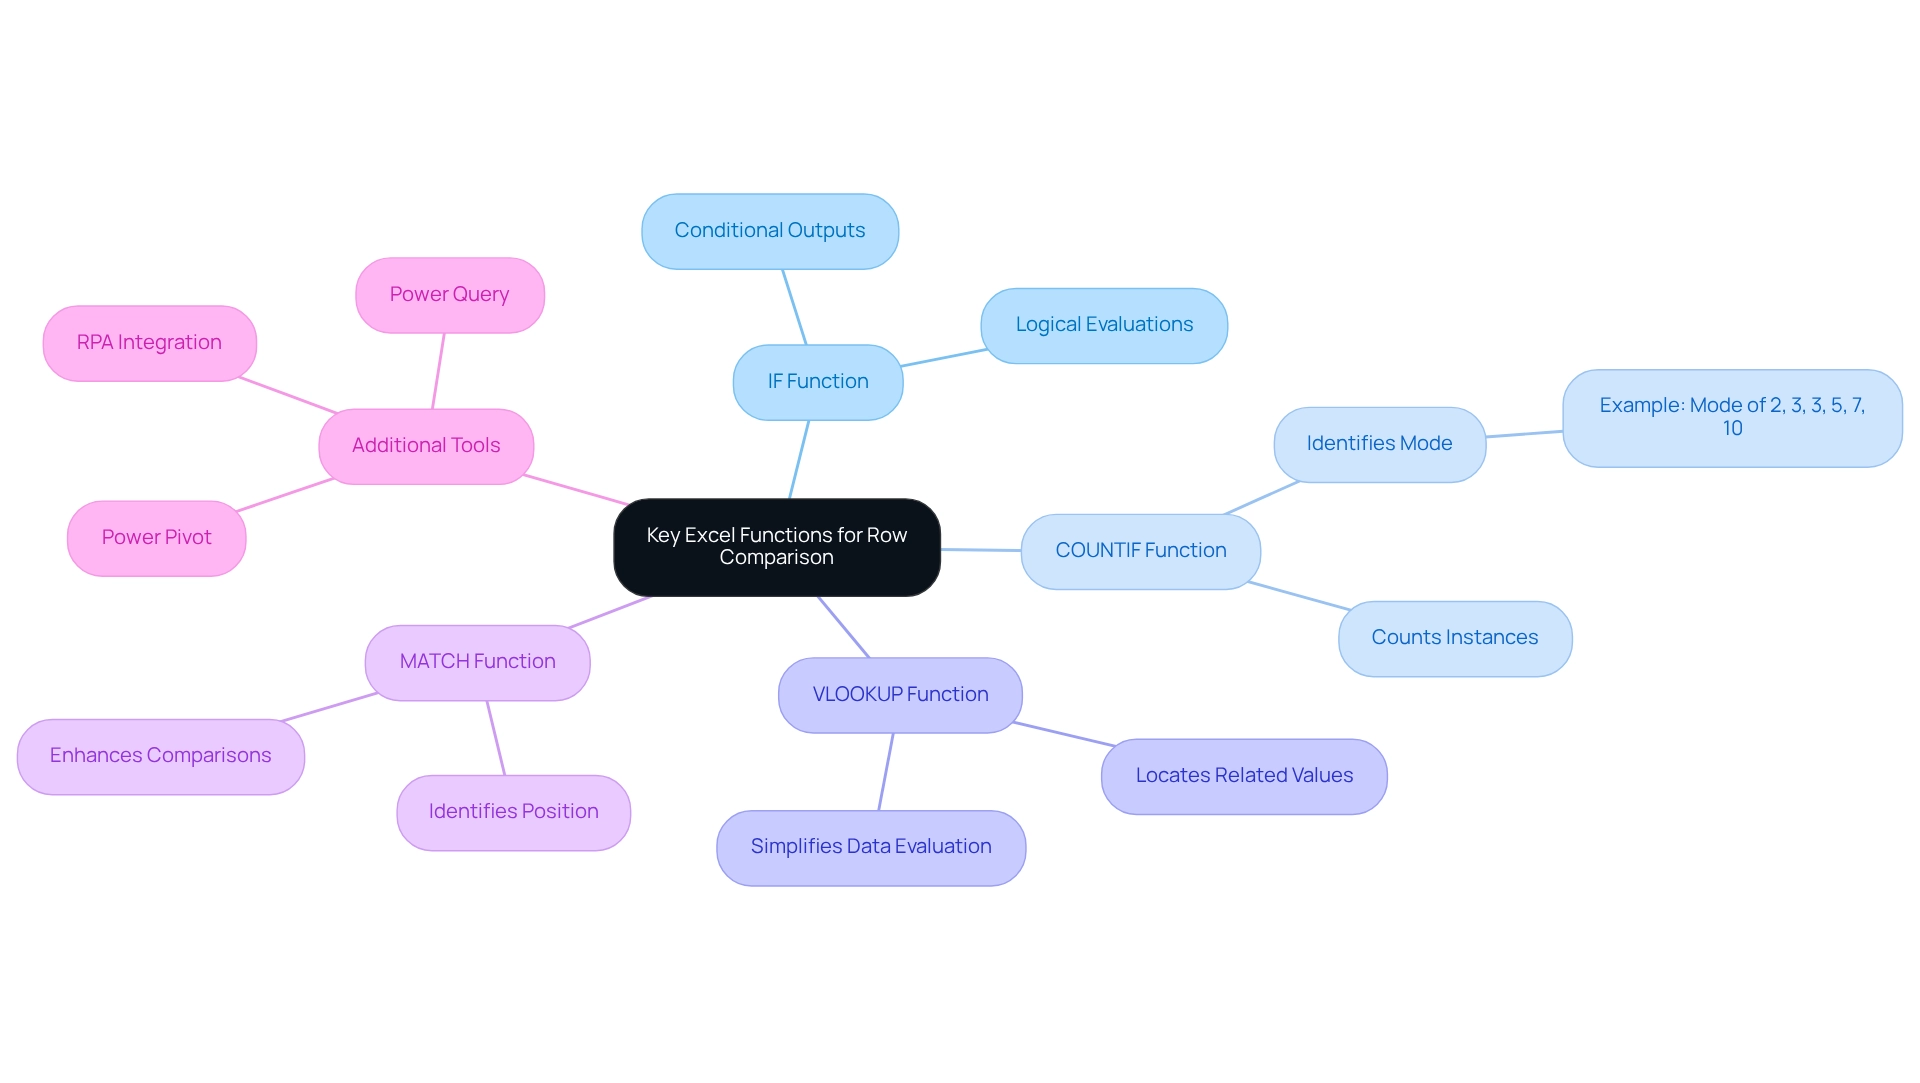
Key Excel Functions for Row Comparison
In Excel, several essential functions play a pivotal role in effective row evaluation, notably IF, COUNTIF, and VLOOKUP. The IF function enables users to perform logical evaluations between cells, returning designated values based on whether specific conditions are met. COUNTIF counts instances of particular values across horizontal arrangements, providing insights into data distribution.
For instance, in a dataset containing the numbers 2, 3, 3, 5, 7, and 10, the mode is 3, demonstrating how COUNTIF can identify the most frequently occurring value. VLOOKUP is crucial for locating related values across various datasets, thereby simplifying the evaluation process. Additionally, the MATCH function identifies the position of a value within a row, further enhancing comparisons across multiple rows.
Mastering these functions is vital for enhancing analytical capabilities in spreadsheet software. As Zach Bobbitt, creator of Statology, states, “My goal with this site is to help you learn statistics through using simple terms, plenty of real-world examples, and helpful illustrations.” Companies have reported significant improvements in their analytical abilities through targeted training in these functions.
A case study involving law enforcement officers revealed that proficiency in spreadsheet formulas such as IF, COUNTIF, and VLOOKUP not only boosted productivity but also enriched the officers’ contributions within their departments.
As we look toward 2025, the latest trends indicate an increasing reliance on these functions for information analysis, with experts advocating for their mastery. Spreadsheet instructors stress that understanding which function to use when comparing all other rows with the first row is essential for improved decision-making and operational efficiency. Moreover, integrating tools like Power Automate can streamline workflows and automate repetitive tasks, enabling teams to concentrate on strategic initiatives.
Furthermore, mastering additional spreadsheet tools like Power Query and Power Pivot is becoming increasingly important for advanced analysis. By leveraging these powerful tools and RPA, organizations can revolutionize their data analysis processes, fostering growth and innovation.
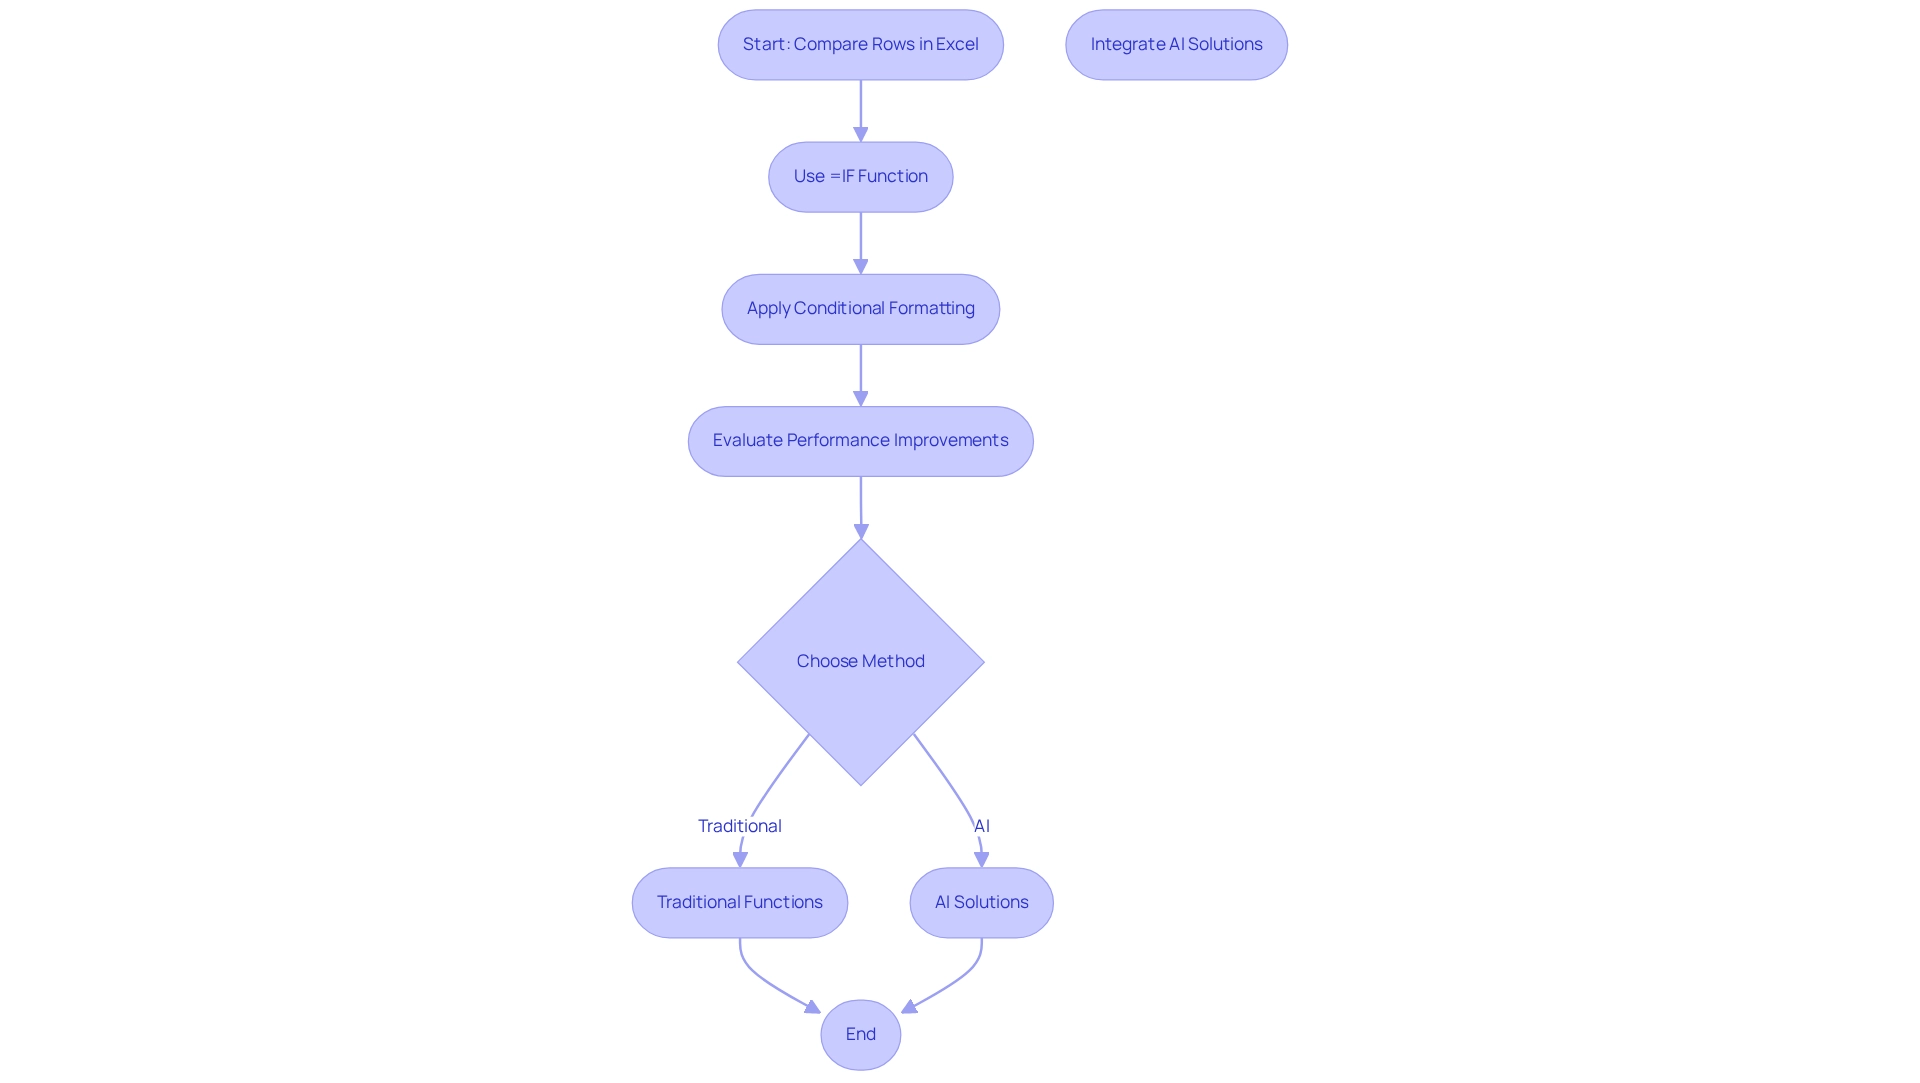
Practical Examples: Comparing Rows with Excel Functions
To effectively compare entries in Excel, one might wonder about the appropriate function for comparing all rows with the first row. A straightforward option is the formula =IF(A2=A1, "Match", "No Match"), which checks if the value in cell A2 matches that of cell A1. This simple contrast can be applied down the column to further lines. For more intricate comparisons, conditional formatting serves as a powerful tool to visually highlight differences between rows.
By selecting a range and applying specific conditional formatting rules, users can quickly identify which cells deviate from the first row. This raises the question: what function would be used to compare all other rows with the first row?
The efficiency of conditional formatting in analysis simplifies the detection of discrepancies, conserving time and enhancing precision. Research indicates that applying best practices in spreadsheet software—such as minimizing the used range and avoiding volatile functions—can significantly improve calculation speed, particularly when handling large datasets. In a case study titled “Handling Large Data Sets in Excel,” users reported a notable enhancement in performance after adopting these strategies, enabling them to work more effectively with extensive information.
Moreover, incorporating AI solutions, such as Small Language Models and GenAI Workshops from Creatum GmbH, can further enhance information quality and governance. These AI-driven methods address issues like inadequate master information quality, ensuring that your information is not only precise but also usable for decision-making. The characteristics of Small Language Models can enhance analysis processes, while GenAI Workshops provide practical training for users to effectively utilize AI within spreadsheet software.
Statistics reveal that there are thirty-two 30-minute periods between 07:00 and 23:00, illustrating the potential time savings when utilizing spreadsheet functions for row comparison. Practical illustrations from analysts demonstrate that using spreadsheet conditional formatting, along with AI tools from Creatum GmbH, not only aids in spotting inconsistencies but also supports more informed decision-making. Additionally, resources like Ablebit’s Date & Time Formula Wizard for spreadsheets can simplify adding and subtracting time and dates, offering further learning opportunities for users.
As Abigail Sims, a technology author, notes, “The software’s capabilities in information management are crucial for operational efficiency.” By integrating these techniques and utilizing AI from Creatum GmbH, organizations can enhance their information management processes, ultimately boosting operational efficiency.
Common Challenges in Row Comparison and How to Overcome Them
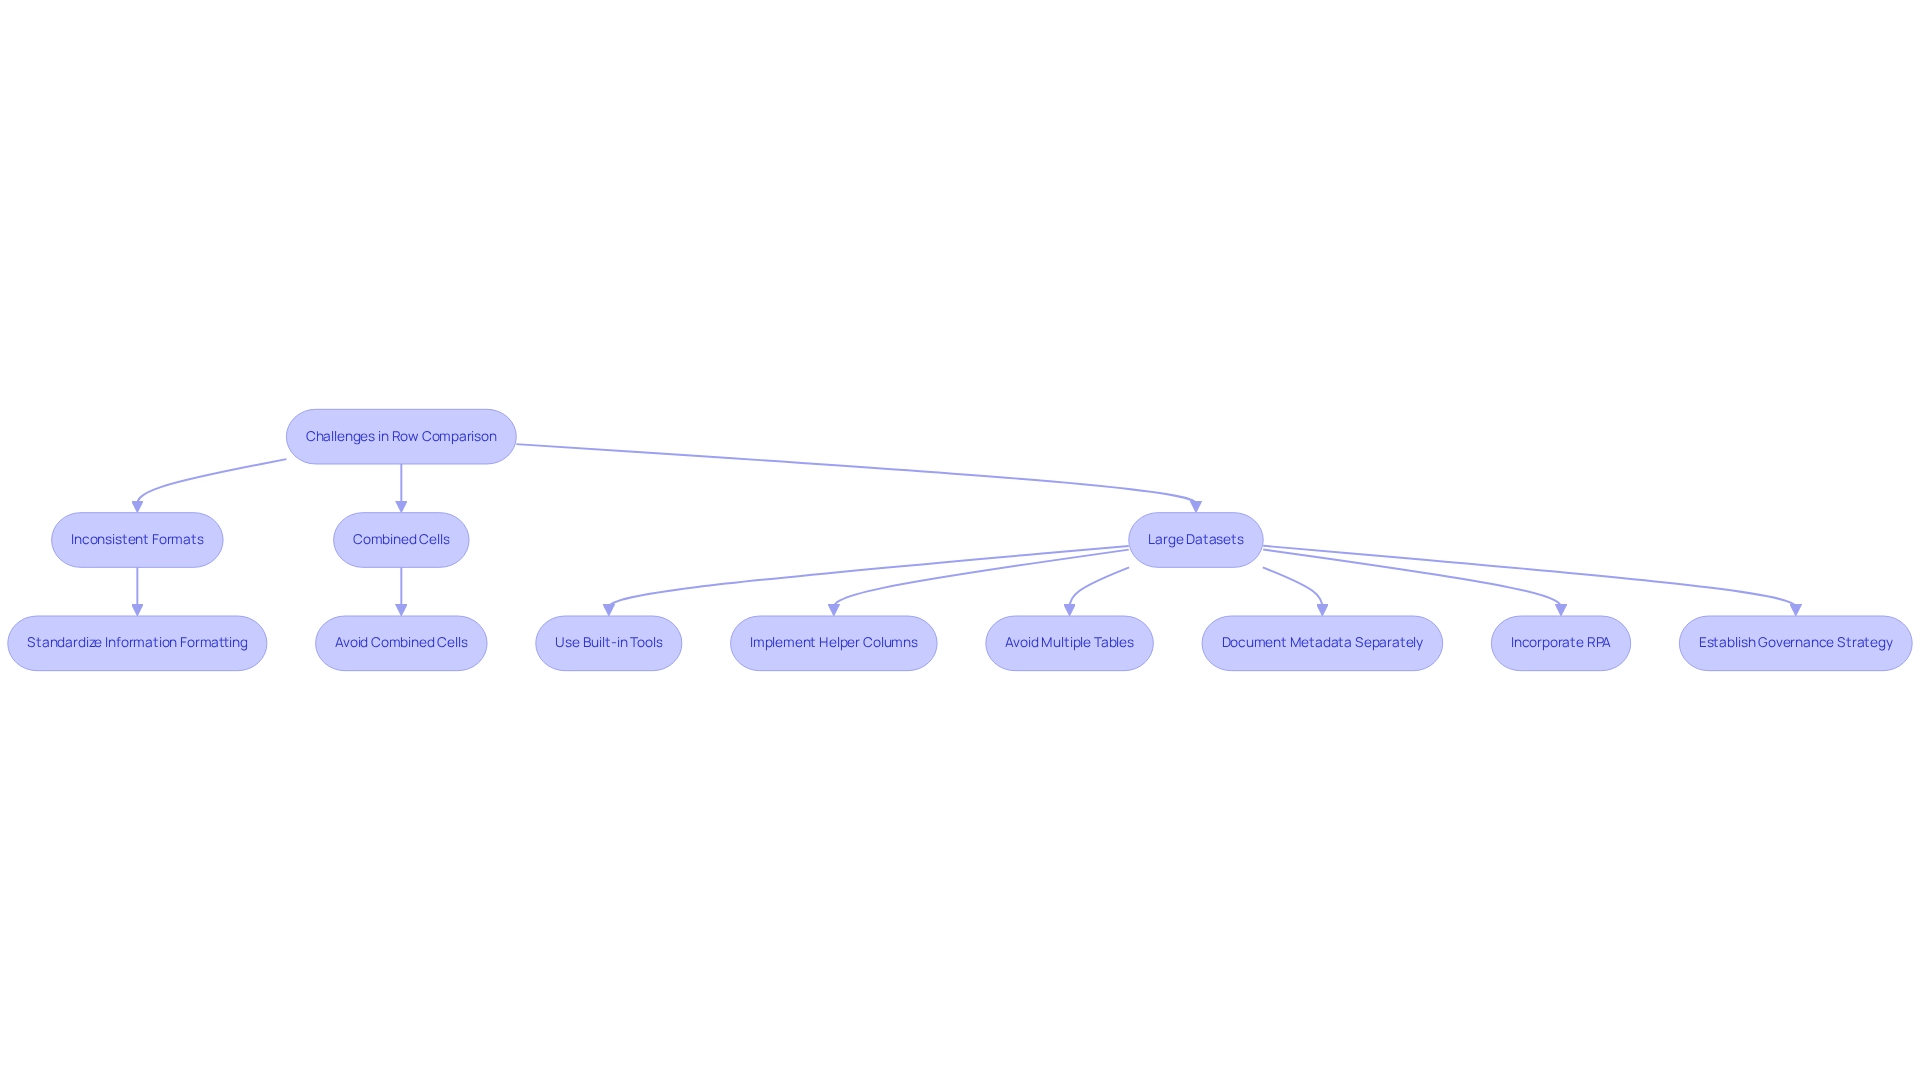
One common issue in row evaluation within Excel is the inconsistency of formats, which can lead to misleading results, such as false negatives. For instance, if one row has dates formatted as text while another uses actual date values, the evaluation may yield incorrect results. To alleviate this issue, standardizing information formatting across all rows is essential, ensuring consistency in how details are represented.
Furthermore, combined cells can hinder data analysis and should be avoided to preserve clarity in evaluations.
Another major challenge emerges when managing large datasets, which can significantly affect the software’s performance. In these situations, using Excel’s built-in tools, like ‘Go To Special,’ can effectively highlight differences between rows, simplifying the analysis process. Additionally, implementing helper columns can streamline complex comparisons, enhancing overall efficiency.
Best practices also involve avoiding multiple tables within one spreadsheet and recording zeros as information to ensure consistency.
Organizations that prioritize consistent information formatting in Excel have reported enhanced accuracy in their analyses. A case study on metadata documentation highlights the necessity of maintaining clear and separate documentation for metadata, which provides essential context for datasets. This practice not only supports transparency but also guarantees that information can be reused effectively, thereby improving the reproducibility of research findings.
Incorporating Robotic Process Automation (RPA) can further streamline these processes by automating repetitive tasks linked with information formatting and comparison, which often slow down operations. This allows teams to focus on strategic decision-making. As Ravikiran A S., a Research Analyst, states, “Now that you know the fundamentals of Data Formatting in a spreadsheet, you will learn how to implement formatting in real-time.”
This highlights the significance of mastering information formatting techniques. Moreover, statistics suggest that frequent formatting problems in Excel can result in considerable performance decline, especially in extensive datasets. By tackling these formatting challenges proactively and utilizing RPA, organizations can enhance their information management processes, reduce errors, and improve operational efficiency.
Furthermore, establishing a governance strategy is crucial to ensure information consistency and reliability across reports.
Advanced Techniques for Comparing Rows in Excel
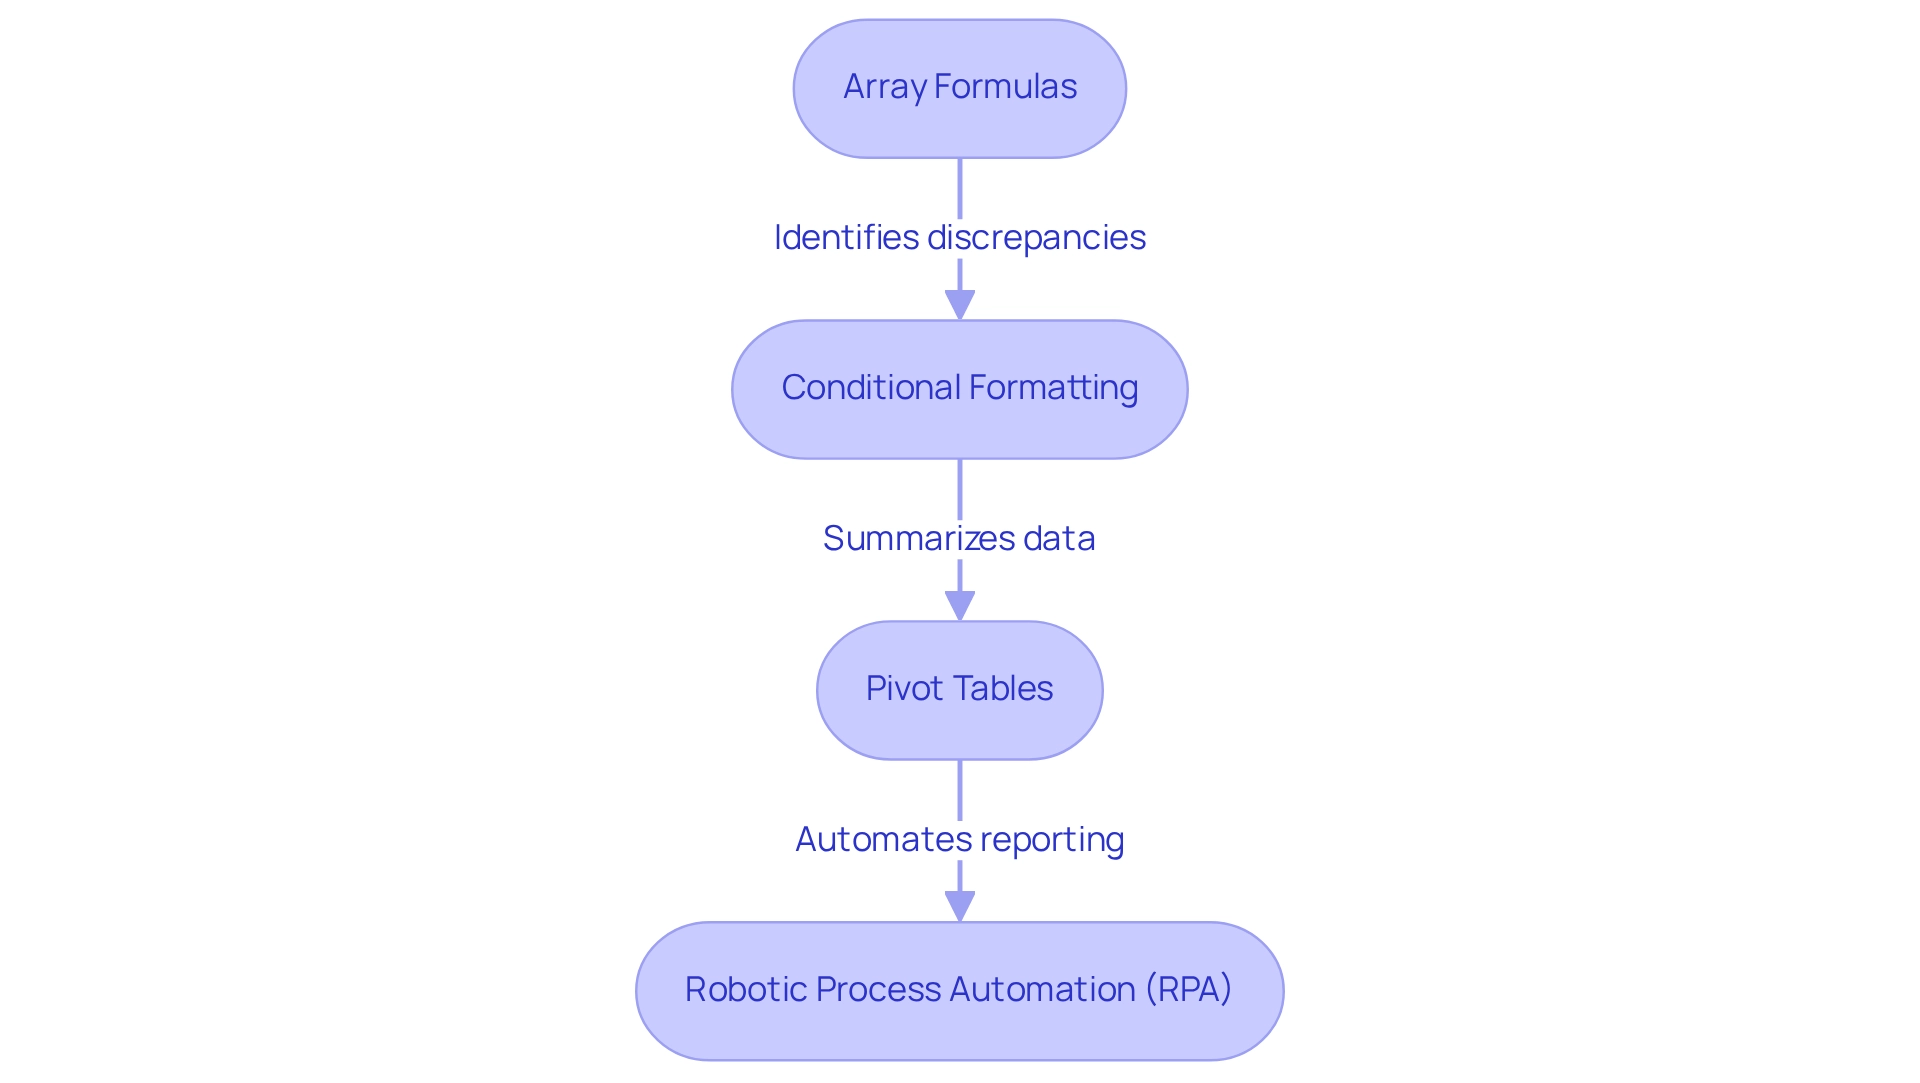
Sophisticated methods for contrasting entries in Excel leverage the features of array formulas and conditional formatting to enhance analysis. Array formulas empower users to evaluate discrepancies across datasets, prompting the question: what function would be employed to compare all other rows with the first row? For instance, utilizing an array formula allows for the effective identification of variations between rows, streamlining the validation process.
A practical illustration of data management in Excel is evident in the statistic that the total number of characters counted in the range A2:A6 is 66. This showcases how array formulas can adeptly manage and analyze information.
Conditional formatting further elevates this process by automatically highlighting cells that differ from a designated reference row. This visual cue simplifies error identification, enabling users to swiftly address discrepancies. As Charley Kyd noted, “information could be smoothed by calculating a centered trendline through neighboring values,” underscoring the importance of accurate analytical methods.
Moreover, pivot tables serve as a powerful resource for summarizing and comparing information across multiple rows. They facilitate deeper insights into trends and patterns, allowing analysts to derive meaningful conclusions from complex datasets. A case study titled “Practical Applications of Array Constants” exemplifies how users can apply array constants in various scenarios, such as multiplying items in an array or transposing arrays.
This equips users with essential skills to enhance their analytical capabilities in spreadsheets, ultimately fostering growth and innovation within their operations.
In 2025, the effectiveness of these advanced spreadsheet techniques is underscored by statistics indicating a significant rise in the adoption of array formulas for information analysis. This highlights their role in boosting operational efficiency. Furthermore, leveraging Robotic Process Automation (RPA) can further refine these processes by automating repetitive tasks related to spreadsheet reporting. This allows teams to concentrate on strategic analysis and decision-making. Such alignment with RPA’s capabilities not only minimizes time-consuming tasks and errors but also supports the overarching objective of enhancing operational efficiency and driving data-driven insights for business growth.
Key Takeaways: Mastering Row Comparison in Excel
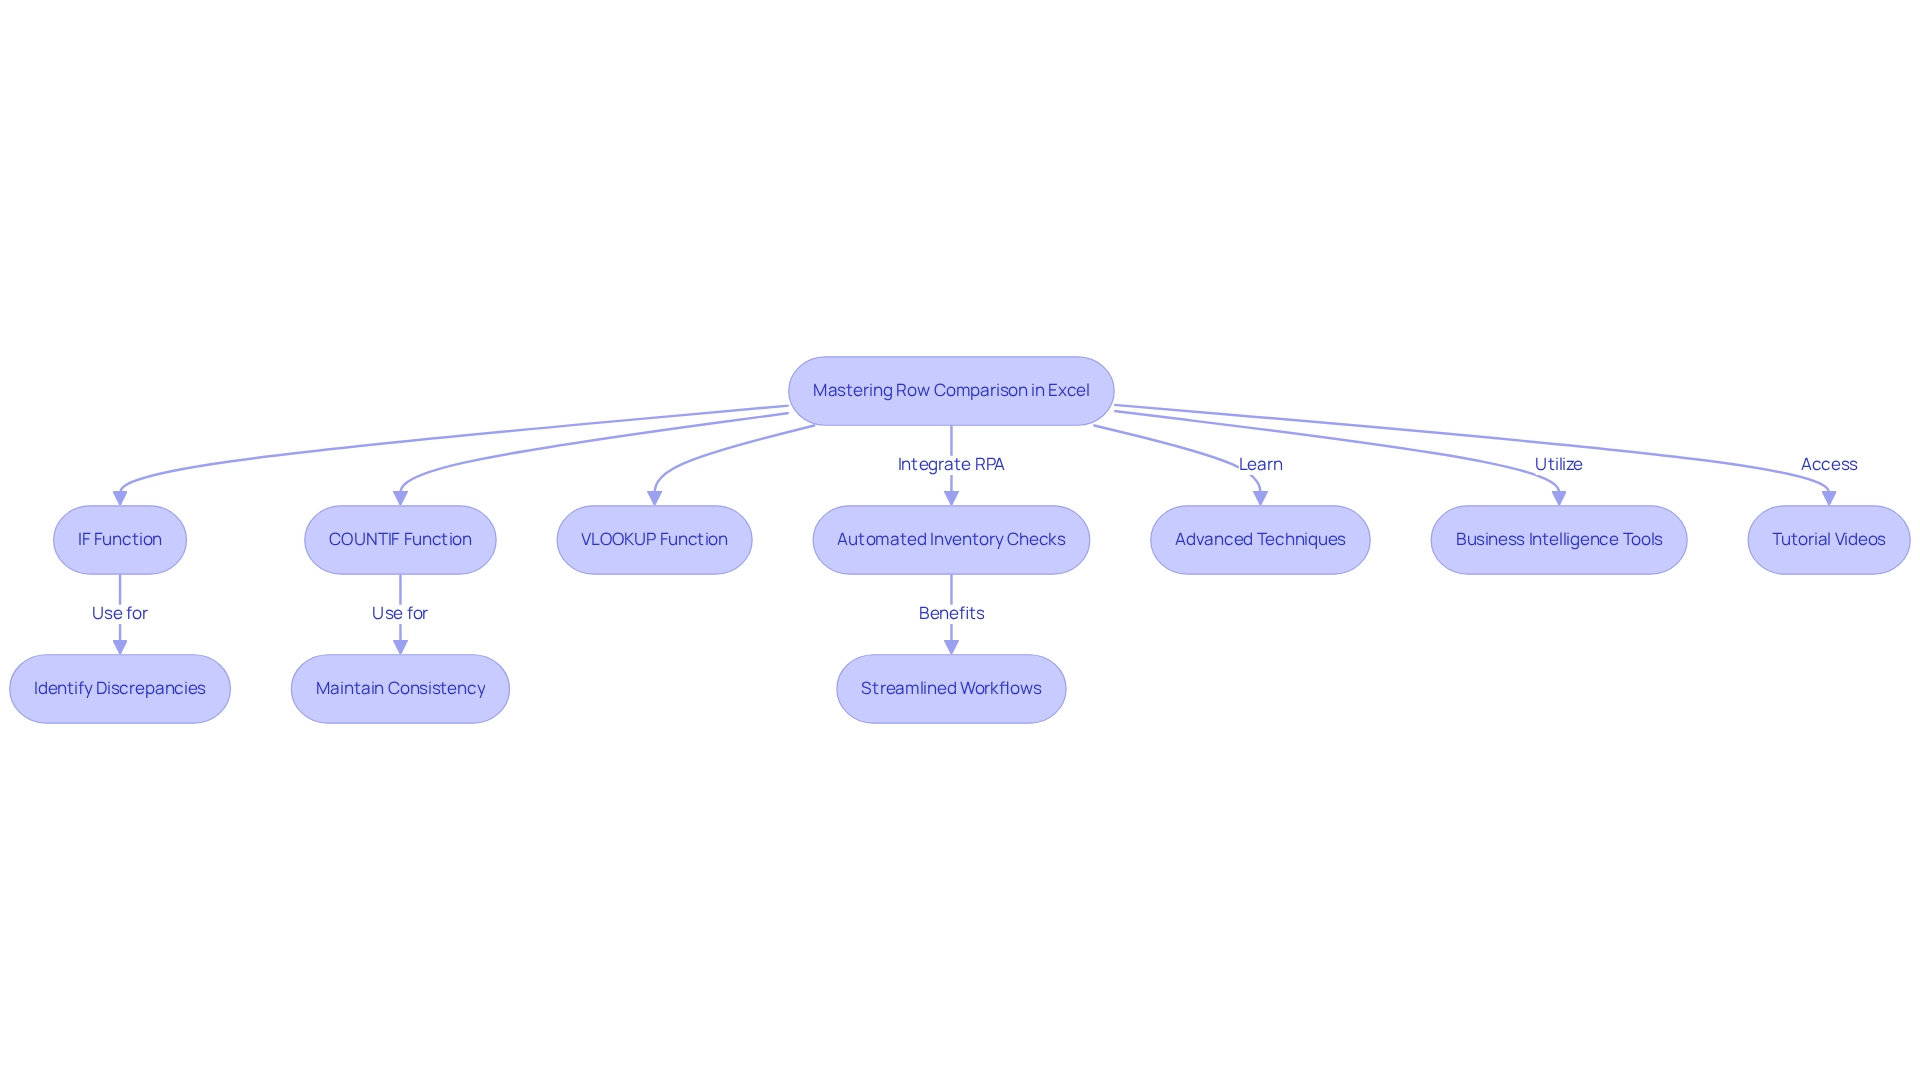
Mastering row analysis in spreadsheet software is essential for ensuring information precision and enhancing operational effectiveness. Key functions such as IF, COUNTIF, and VLOOKUP serve as indispensable tools for effective data comparisons. By utilizing these functions, users can swiftly identify discrepancies and maintain consistency across datasets, a crucial aspect for informed decision-making.
Incorporating Robotic Process Automation (RPA) from Creatum GmbH into these processes can significantly streamline workflows, reducing the time spent on manual tasks and minimizing errors. For instance, a small retail business improved its inventory management through a detailed tracking system. This system not only categorized products but also calculated total inventory value, resulting in notable enhancements in efficiency and profitability.
By automating inventory checks with functions like IF and tracking stock levels using COUNTIF, the business effectively combined spreadsheet functionalities with RPA, leading to increased operational productivity.
Statistics reveal that organizations proficient in Excel can reduce management errors by as much as 30%, underscoring the importance of precise analysis. Furthermore, in histograms, the heights of rectangles must be proportional to the frequency density, which is the frequency divided by the amplitude of the class, highlighting the necessity for accurate representation.
Professional insights emphasize that efficient row comparison is vital for operational effectiveness, enabling teams to focus on strategic initiatives rather than rectifying inaccuracies. Daniel Raymond, a Project Manager, notes, “With a strong background in managing complex projects, efficient information management tools are essential for streamlining processes and enhancing productivity.”
Advanced techniques, including array formulas and conditional formatting, empower users to analyze information comprehensively. These skills not only optimize information management processes but also enhance the ability to derive actionable insights from complex datasets. Key takeaways for mastering row comparison in spreadsheets include understanding the nuances of these functions and being able to determine which function to use for comparing all other rows with the first row, ultimately driving better decision-making and operational success.
Moreover, incorporating Business Intelligence tools can transform unrefined information into actionable insights, facilitating informed decision-making that fosters growth and innovation. RPA can help navigate the complexities of the evolving AI landscape, ensuring that businesses can concentrate on what truly matters. Tutorial videos covering a range of Excel topics serve as valuable resources for those looking to enhance their skills in data management.
Conclusion
Mastering row comparison techniques in Excel is not just beneficial; it is essential for achieving data accuracy and operational efficiency. Functions like IF, COUNTIF, and VLOOKUP are indispensable tools that empower users to swiftly identify discrepancies and maintain consistency across datasets. This proficiency is vital for informed decision-making, especially in environments where data integrity is paramount.
Integrating Robotic Process Automation (RPA) further enhances these processes by streamlining workflows, reducing the time spent on manual tasks, and minimizing errors. Consider the example of a retail business optimizing its inventory management through Excel; it highlights the tangible benefits that arise from combining Excel’s capabilities with automation. Statistics show a potential reduction in data management errors by up to 30%, underscoring the importance of accurate data analysis in fostering operational success.
Advanced techniques, such as array formulas and conditional formatting, empower users to conduct comprehensive data analyses, ensuring organizations can extract actionable insights from complex datasets. By understanding and applying these functions in real-world scenarios, businesses can drive better decision-making and enhance productivity. Ultimately, effective row comparison transcends a mere technical skill; it is a foundational practice that supports strategic initiatives, allowing teams to concentrate on what truly matters in a data-driven landscape.
Frequently Asked Questions
What is row comparison in Excel?
Row comparison in Excel is a technique that evaluates information in one row against another to identify similarities or discrepancies, particularly comparing all other rows with the first row.
Why is row comparison important?
It is crucial for information validation, error checking, and maintaining consistency across datasets, helping organizations avoid confusion and distrust in their data.
What percentage of current information is unstructured, and why is this significant?
Approximately 80% of current information is unstructured, making effective row comparison techniques vital for ensuring information integrity and enhancing decision-making.
How can row comparison improve operational success?
By systematically comparing rows, users can quickly identify inconsistencies, leading to improved accuracy in data, which can enhance operational success and drive data-driven insights.
What role does Robotic Process Automation (RPA) play in row comparison?
RPA can streamline manual workflows involved in row comparison, reducing errors and allowing teams to focus on more strategic tasks.
What is the recommended practice for maintaining validation guidelines in spreadsheets?
Experts recommend routine assessments and updates to validation guidelines to ensure their relevance and efficiency in maintaining information integrity.
How does row comparison contribute to quality control?
It allows organizations to detect discrepancies early, which can lead to significant improvements in information accuracy and decision-making outcomes.
What is the impact of using AI-powered models in conjunction with row comparison?
AI-powered models can enhance traditional row comparison methods by minimizing false positives and revealing hidden risks, thus improving information quality and operational efficiency.
How can organizations benefit from embracing automated solutions for real-time information validation?
Automated solutions can facilitate real-time validation, reflecting a broader trend in information management that prioritizes efficiency and accuracy in data handling.

