Introduction
In a world where data reigns supreme, Power BI emerges as a transformative business analytics tool that empowers organizations to harness the potential of their data. Designed by Microsoft, this platform facilitates the visualization and sharing of insights, enabling teams to make informed, data-driven decisions swiftly.
With features like rapid report creation and enhanced data connectivity, Power BI not only streamlines workflows but also significantly boosts productivity. As businesses navigate the complexities of operational efficiency and scalability, understanding the capabilities of Power BI becomes essential.
This article delves into the fundamentals of Power BI, including:
- Effective training strategies
- Prerequisites for learners
- The wealth of free resources available
It also highlights real-world applications and success stories that demonstrate the profound impact of this powerful tool across various industries. By exploring these aspects, organizations can unlock the full potential of Power BI and drive their operational success in an increasingly data-centric landscape.
Understanding Power BI: An Overview for Beginners
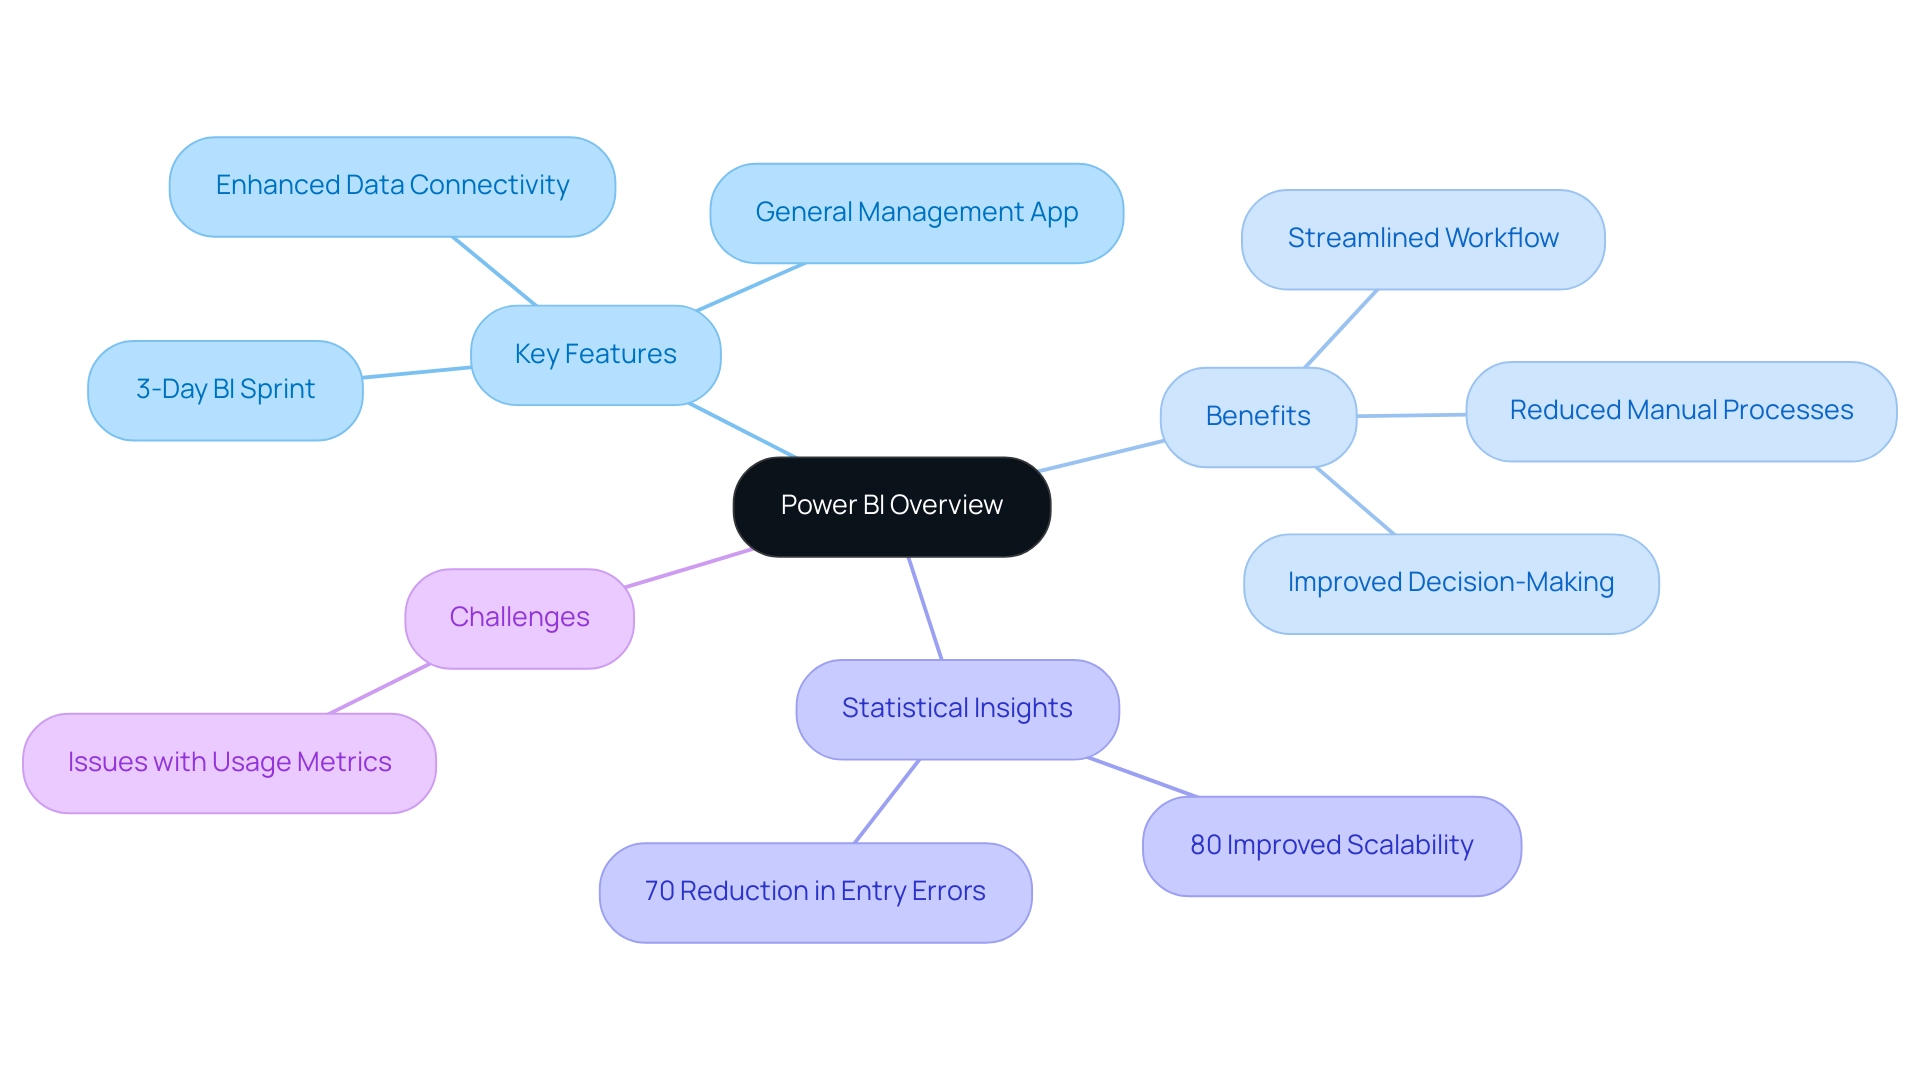
This tool distinguishes itself as a strong business analytics solution created by Microsoft, intentionally designed to convert raw information into actionable conclusions. This platform not only allows organizations to visualize their information and share valuable insights effortlessly across teams but also enables users to create dynamic dashboards and thorough analyses that support evidence-based decision-making. Key features of BI include:
- A 3-Day BI Sprint for quick report creation
- The General Management App for comprehensive management and smart reviews
- Enhanced data connectivity for seamless integration with various data sources
Additionally, with Automate, organizations can streamline workflow automation, assess risks, and ensure professional execution for risk-free ROI, significantly reducing manual processes and enhancing productivity. These tools empower users to delve deep into their business metrics, fostering a better understanding of performance and facilitating timely, informed decisions. However, challenges may arise, such as issues viewing or downloading usage metrics from the Power BI service, which could impact user experience.
As organizations aim to enhance operational efficiency and scalability, it’s noteworthy that 80% of those utilizing cloud-based BI reporting report improved scalability. This corresponds with findings from recent case studies, such as the successful implementation of GUI automation in a mid-sized company, which faced challenges like manual information entry errors and slow software testing. The implementation of GUI automation resulted in a 70% reduction in entry errors and a 50% acceleration in testing processes, showcasing the transformative impact of innovative analytics tools.
Such examples underscore the significance of leveraging these tools, especially as the landscape of business analytics continues to evolve in 2024. Understanding tech trends is increasingly crucial for optimizing operational effectiveness, as highlighted by industry leaders like Tajammul Pangarkar, CMO at Prudour Pvt Ltd.
Navigating Power BI Training: Course Structures and Learning Outcomes
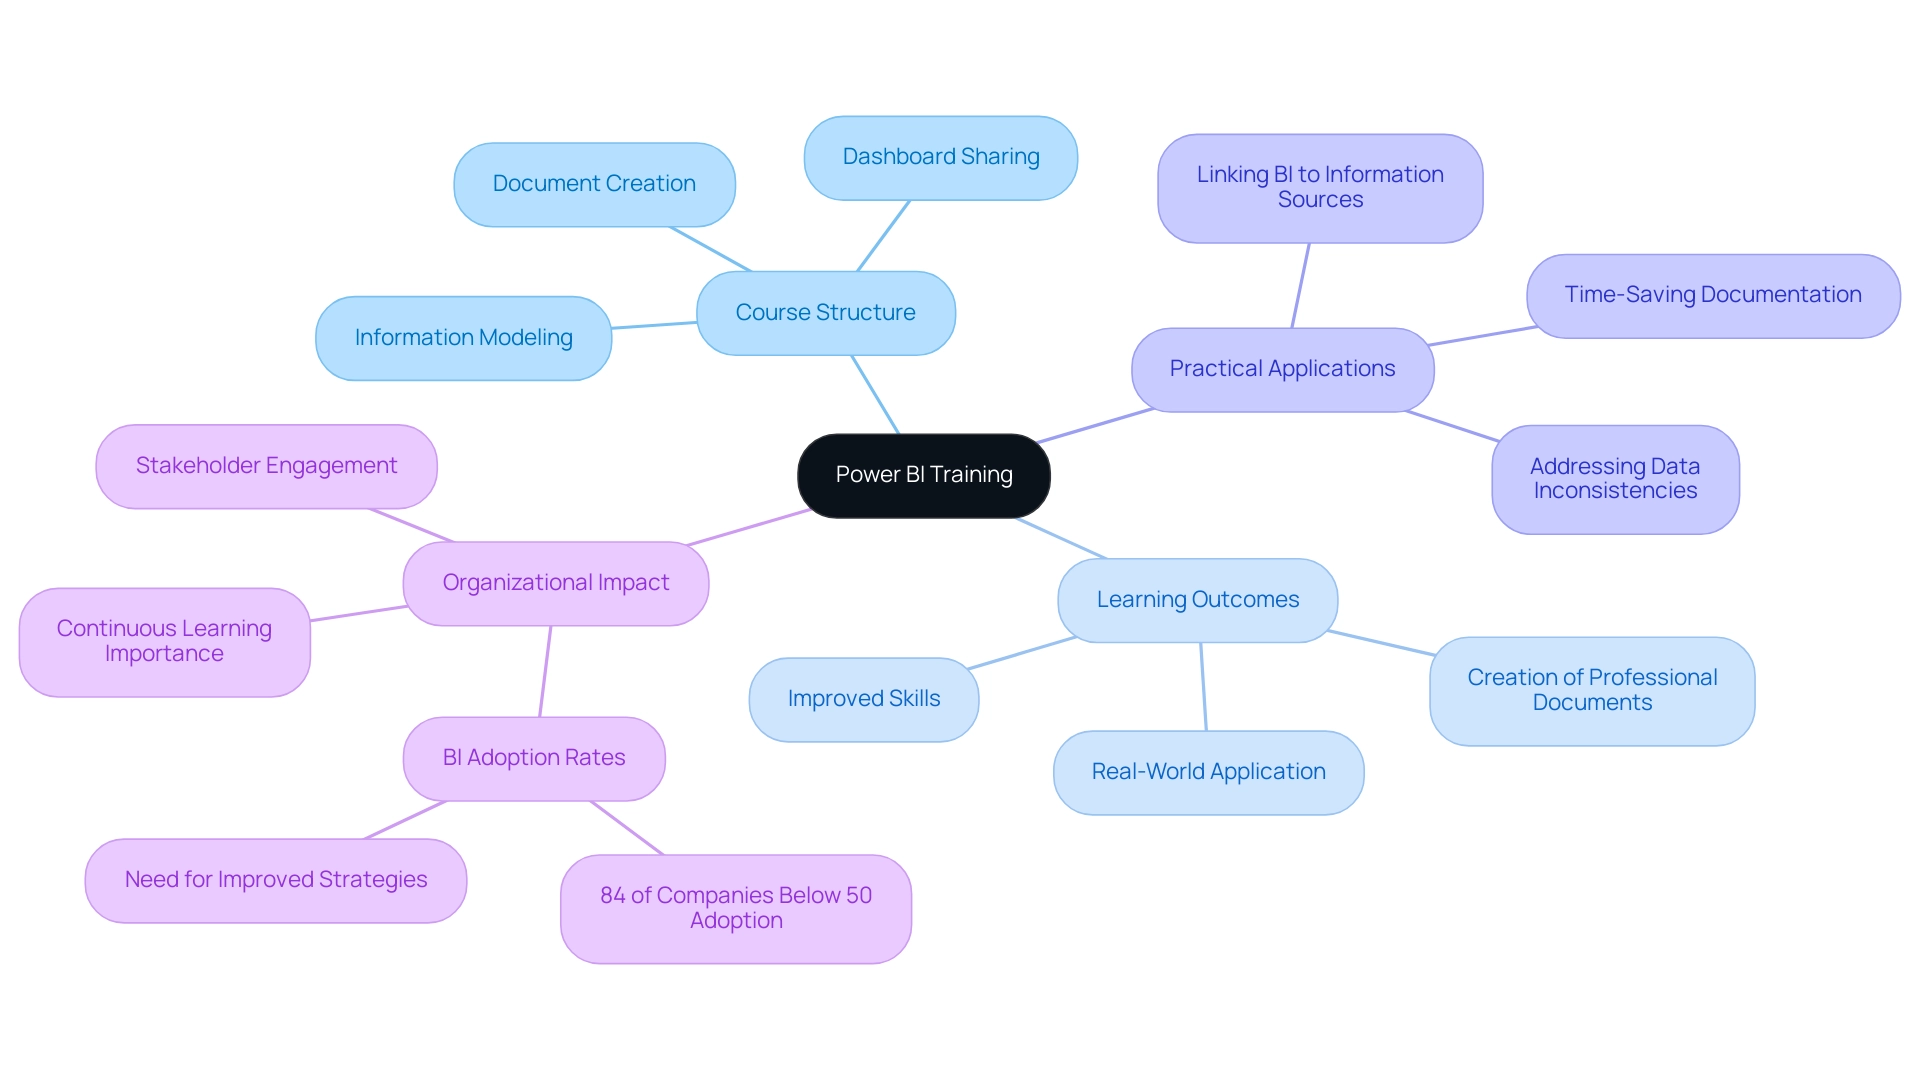
The introduction to Power BI training includes comprehensive courses designed to seamlessly blend theoretical knowledge with practical, hands-on exercises, ensuring participants can effectively apply what they learn in real-world scenarios. Usually organized into units, these classes address crucial subjects like information modeling, document creation, and dashboard sharing, resulting in actionable insights that enhance operational efficiency. Participants can anticipate improving their abilities in linking BI to various information sources, creating engaging visualizations, and publishing informative documents customized to their organizational requirements.
The introduction to Power BI training emphasizes practical applications that prepare learners to utilize Power BI effectively within their teams, tackling common challenges such as time-consuming documentation creation and data inconsistencies. Engaging in a well-structured introduction to Power BI training empowers beginners to systematically progress from fundamental concepts to advanced techniques, echoing the positive feedback from past participants who found the time investment well worth it. In just three days, participants will create a fully functional, professionally designed document on a topic of their choice, allowing them to focus on utilizing the insights.
Additionally, this report can serve as a template for future projects, ensuring a professional design from the start. This approach reflects a broader trend highlighted in recent case studies, where organizations with a robust training framework saw significant improvements in BI adoption rates. Significantly, a survey showed that 84% of companies have a BI adoption rate of less than 50%, highlighting the urgent necessity for effective training strategies.
Furthermore, as organizations define roles and responsibilities to ensure stakeholder engagement and alignment toward common goals, the relevance of Business Intelligence training increases, especially with Microsoft promoting Acterys as their preferred XP&A tool for cross-departmental planning and forecasting. This reinforces the importance of continuous learning in maximizing data-driven insights and operational efficiency.
Prerequisites for Learning Power BI: What You Need to Know
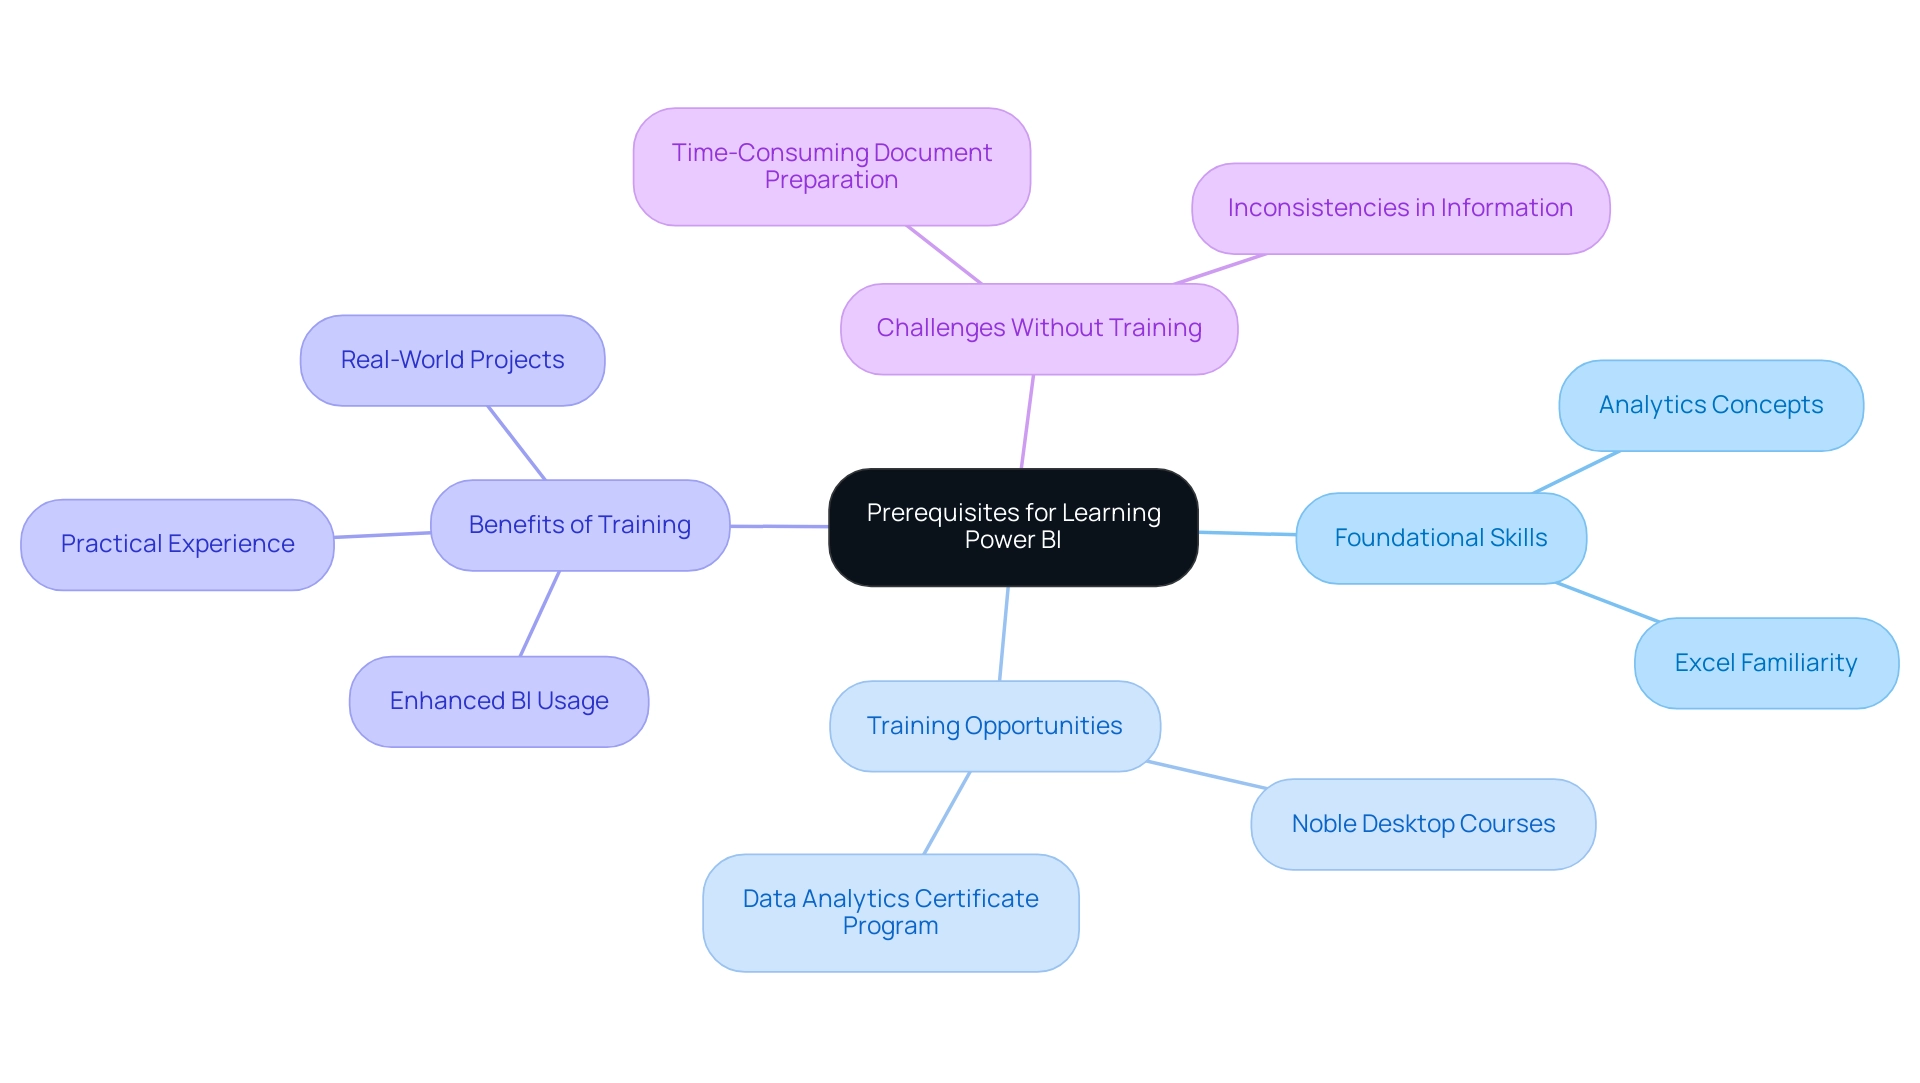
An introduction to Power BI training is most effective when learners arrive with a foundational understanding of analysis concepts and familiarity with Microsoft Excel. Noble Desktop provides an introduction to Power BI training through live, instructor-led BI Bootcamp courses in NYC and online, offering an excellent opportunity to gain these essential skills. Additionally, their Data Analytics Certificate program features an introduction to Power BI training that focuses on practical training with analytics tools, enabling students to undertake real-world projects that improve their learning experience.
Classes are planned from October 1 – 3, 9:00 AM – 4:30 PM EDT in Toronto, providing timely opportunities for prospective learners.
An introduction to Power BI training that covers visualization concepts and offers practical experience with information manipulation can greatly enhance a learner’s capacity to use BI effectively. While an extensive background in programming or database management isn’t a strict prerequisite, the introduction to Power BI training will undoubtedly be enriched by an eagerness to embrace new technologies and concepts. Individuals with a strong analytical mindset often find it easier to comprehend BI’s functionalities and applications, which enhances their experience in an introduction to Power BI training and paves the way for success in their data-driven endeavors.
Additionally, the difficulties of utilizing information from BI dashboards, such as time-consuming document preparation and inconsistencies in information, highlight the need for an introduction to Power BI training and practical guidance.
For example, the module on creating and managing workspaces in the introduction to Power BI training addresses navigation within the service, including establishing and overseeing workspaces and sharing documents, which is essential for practical application. In the Microsoft Azure Data Fundamentals Training DP-900 course, you’ll learn the basics of database principles and build essential knowledge, reinforcing the significance of having a solid foundation in information concepts for an introduction to Power BI training that enhances operational efficiency and business growth. Moreover, incorporating RPA solutions such as EMMA RPA and Automate can simplify information processes and improve the effectiveness of document generation, ultimately resulting in more actionable knowledge and informed decision-making.
Exploring Learning Resources: Free Tutorials and Online Classes
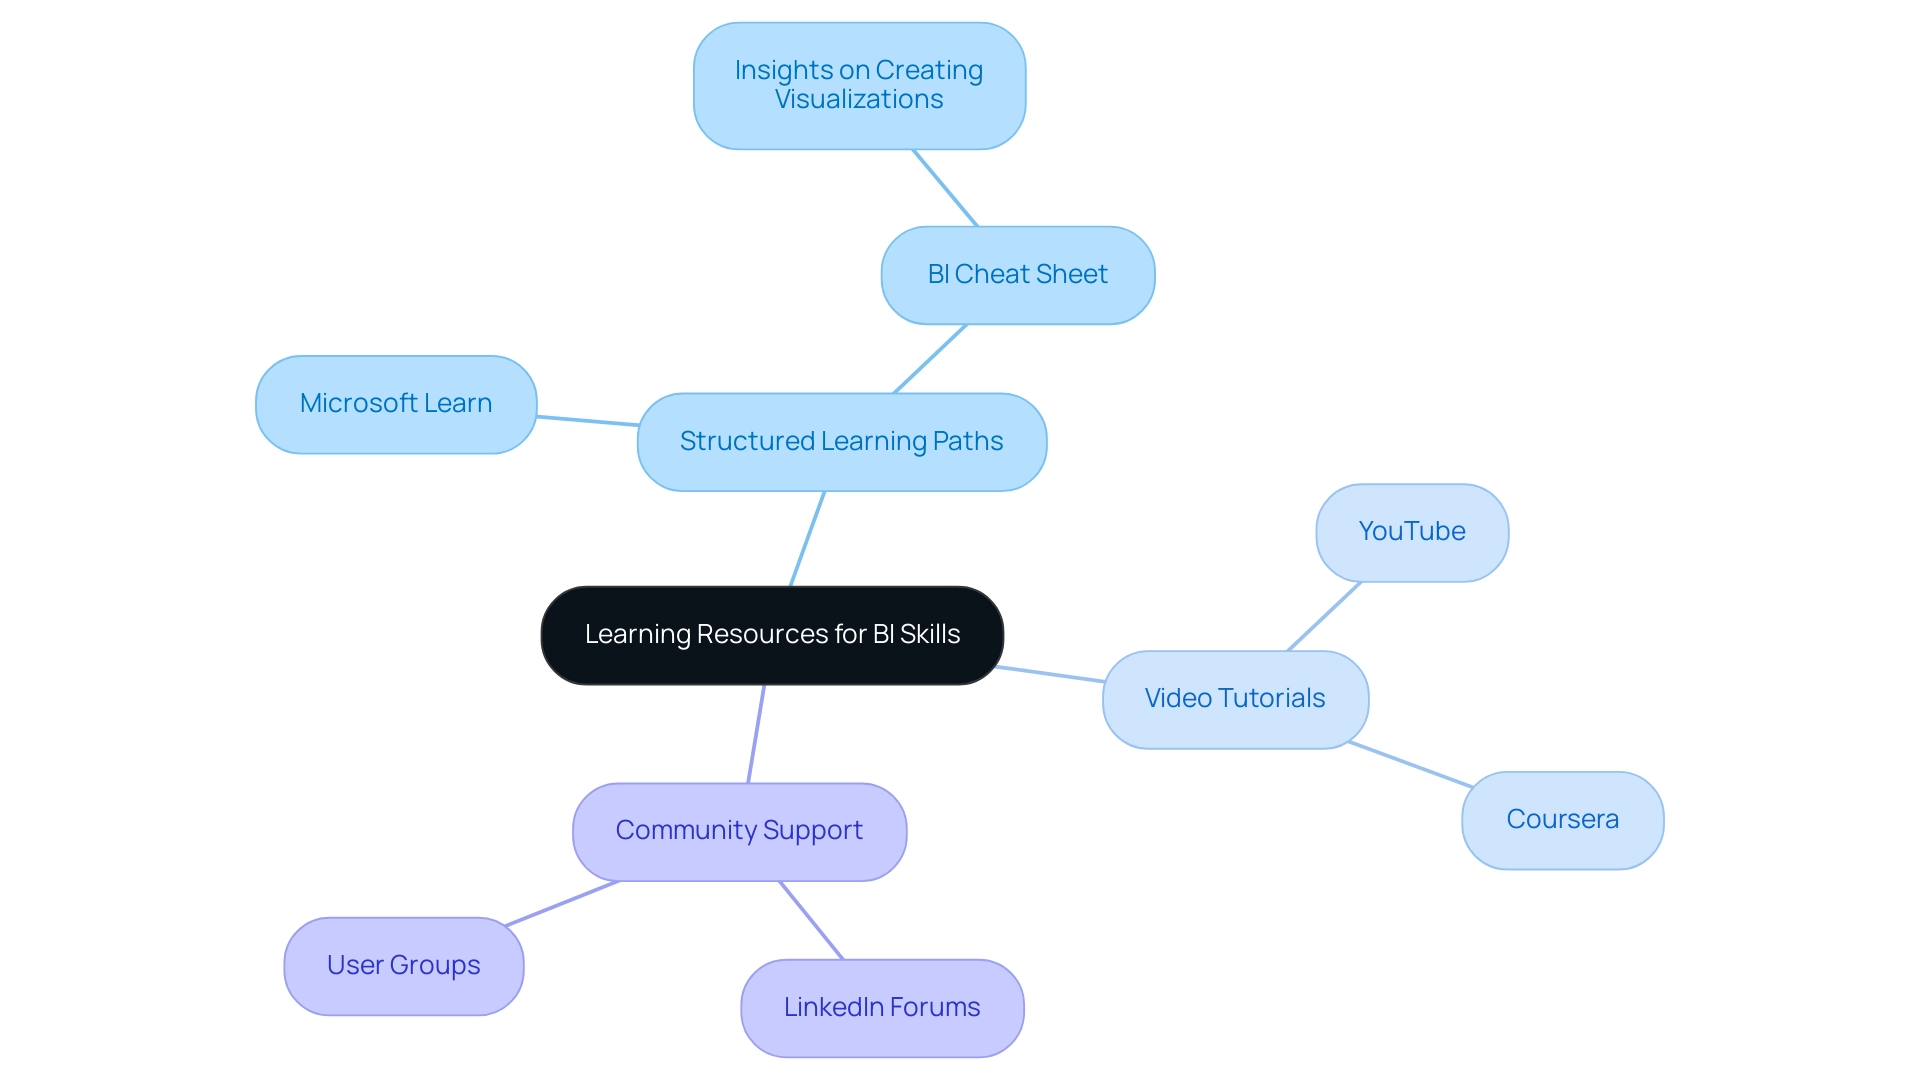
For those looking to enhance their BI skills without financial investment, a wealth of free resources is readily available, addressing common challenges such as time-consuming report creation, data inconsistencies, and the lack of a governance strategy. Websites like Microsoft Learn present structured learning paths tailored to various skill levels, enabling users to progress at their own pace and overcome the hurdles of ineffective reporting and governance issues. A notable resource is the BI Cheat Sheet, which provides insights on creating visualizations and takes about 8 minutes to read, making it an efficient learning tool for understanding best practices in governance.
Additionally, platforms such as YouTube and Coursera provide extensive video tutorials and courses that explore different aspects of BI, catering to both beginners and experienced users alike, ensuring they gain actionable guidance. Community forums and user groups on platforms such as LinkedIn further enrich the learning experience by connecting learners with peers and industry experts, fostering collaboration and support. Engaging with these resources not only broadens knowledge but also equips users with diverse perspectives on effectively utilizing BI in real-world scenarios.
For instance, the HR Analytics in BI course on Udemy, led by Sarah Kithaka, equips participants with practical skills for utilizing BI in HR analytics, illustrating the application of these free resources. As highlighted by a Data Analyst from Rio Tinto, ‘Overall, the training is very good. Thank you, Simplilearn,’ which underscores the effectiveness of structured online learning, particularly for newcomers to the platform, and empowers them to leverage insights effectively while adhering to governance best practices.
Real-World Applications of Power BI: Examples and Case Studies
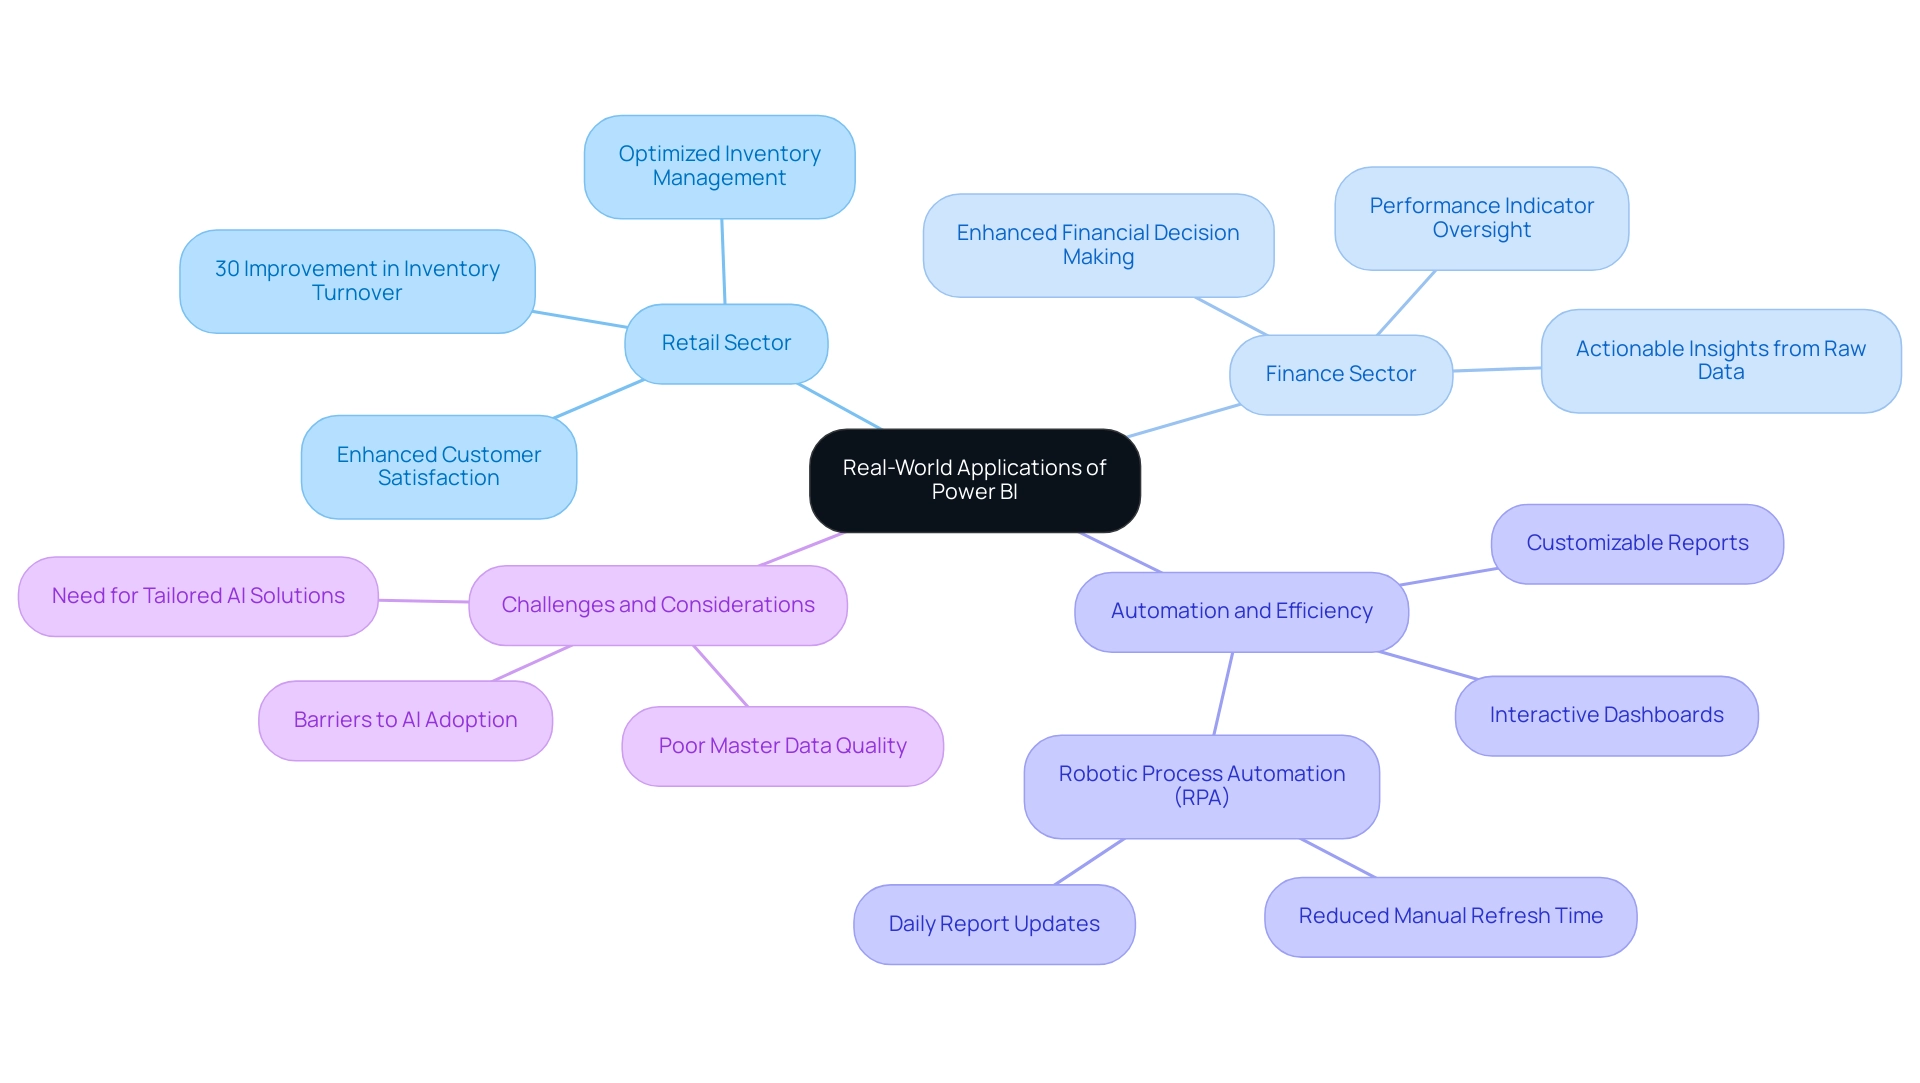
BI functions as a robust tool with diverse applications across various industries, enhancing operational efficiency and informed decision-making. In the retail sector, for example, companies utilize BI to analyze sales data and optimize inventory management, resulting in enhanced customer satisfaction and significant cost reductions. A recent statistic reveals that businesses using Power BI in retail have seen a 30% improvement in inventory turnover rates.
One notable case involved a global company that automated its data processes from Salesforce, Webeo, and LinkedIn Ads using Robotic Process Automation (RPA), reducing manual refresh time from six hours to mere minutes. This transformation permitted daily report updates, streamlining operations and facilitating quicker responses to market dynamics while removing the challenges of time-consuming report creation and inconsistencies. The application of RPA not only diminished mistakes but also liberated team members for more strategic, value-enhancing tasks.
In the finance sector, organizations employ BI to illustrate financial information, oversee performance indicators, and direct investment strategies. By converting raw information into actionable insights, BI enables finance professionals to make informed decisions with confidence. A comparative analysis shows that BI offers superior cloud integration and customization options compared to competitors like Tableau and Salesforce, enhancing its usability for financial analytics.
The effectiveness of BI is further illustrated in a study that highlights its interactive dashboards and customizable reports, which not only enhance comprehension but also provide a competitive advantage in a landscape focused on information.
Statistics indicate that businesses utilizing BI have experienced marked improvements in operational efficiency, particularly in the retail and finance sectors. However, challenges such as poor master data quality and barriers to AI adoption persist, making it essential for organizations to consider tailored AI solutions that align with their specific needs. As SPEC INDIA aptly notes,
With efficient project management practices, international standards to comply, flexible engagement models, and superior infrastructure, SPEC INDIA is a customer’s delight.
This reinforces the notion that an introduction to Power BI training, combined with leveraging RPA to automate manual workflows, can significantly enhance one’s career trajectory, offering invaluable skills that align with the evolving demands of today’s business environments.
Conclusion
Power BI stands as a pivotal tool in the realm of business analytics, transforming raw data into actionable insights that drive operational success. By equipping organizations with the ability to visualize and share data effectively, Power BI enhances decision-making processes and fosters a culture of data-driven strategies. The article has explored essential components of Power BI, from effective training strategies that empower users to harness its full potential, to the prerequisites that ensure learners are well-prepared for their journey.
Furthermore, the availability of free resources and structured training programs underscores the importance of continuous learning in maximizing Power BI’s capabilities. Real-world applications highlighted throughout the article demonstrate the tangible benefits that organizations across various industries can realize, such as improved inventory turnover in retail and enhanced financial analytics in finance. These success stories not only illustrate the transformative impact of Power BI but also emphasize the need for strategic implementation to overcome common challenges.
As businesses continue to navigate an increasingly data-centric landscape, embracing Power BI is not merely advantageous but essential for maintaining a competitive edge. By committing to effective training, leveraging available resources, and understanding the practical applications of this powerful tool, organizations can unlock unprecedented operational efficiency and drive meaningful growth in their respective fields. Now is the time to seize the opportunities that Power BI presents and transform data into a catalyst for success.

