Introduction
In the rapidly evolving landscape of business analytics, the integration of R programming with Microsoft Power BI stands out as a transformative solution for organizations seeking to enhance their data analysis and visualization capabilities. This powerful combination empowers data analysts and business intelligence professionals to tackle complex statistical tasks and create compelling visual narratives, ultimately driving informed decision-making.
As businesses increasingly rely on data-driven insights to navigate competitive markets, the ability to seamlessly merge R’s advanced analytical techniques with Power BI’s user-friendly interface becomes indispensable. From healthcare to finance, diverse industries are leveraging this integration to unlock deeper insights, streamline reporting processes, and elevate operational efficiency.
However, while the potential is immense, organizations must also navigate the challenges of technical expertise and data management to fully harness the benefits of this dynamic duo.
This article delves into the multifaceted advantages of R Power BI integration, real-world applications, and the future trends that will shape its role in business intelligence.
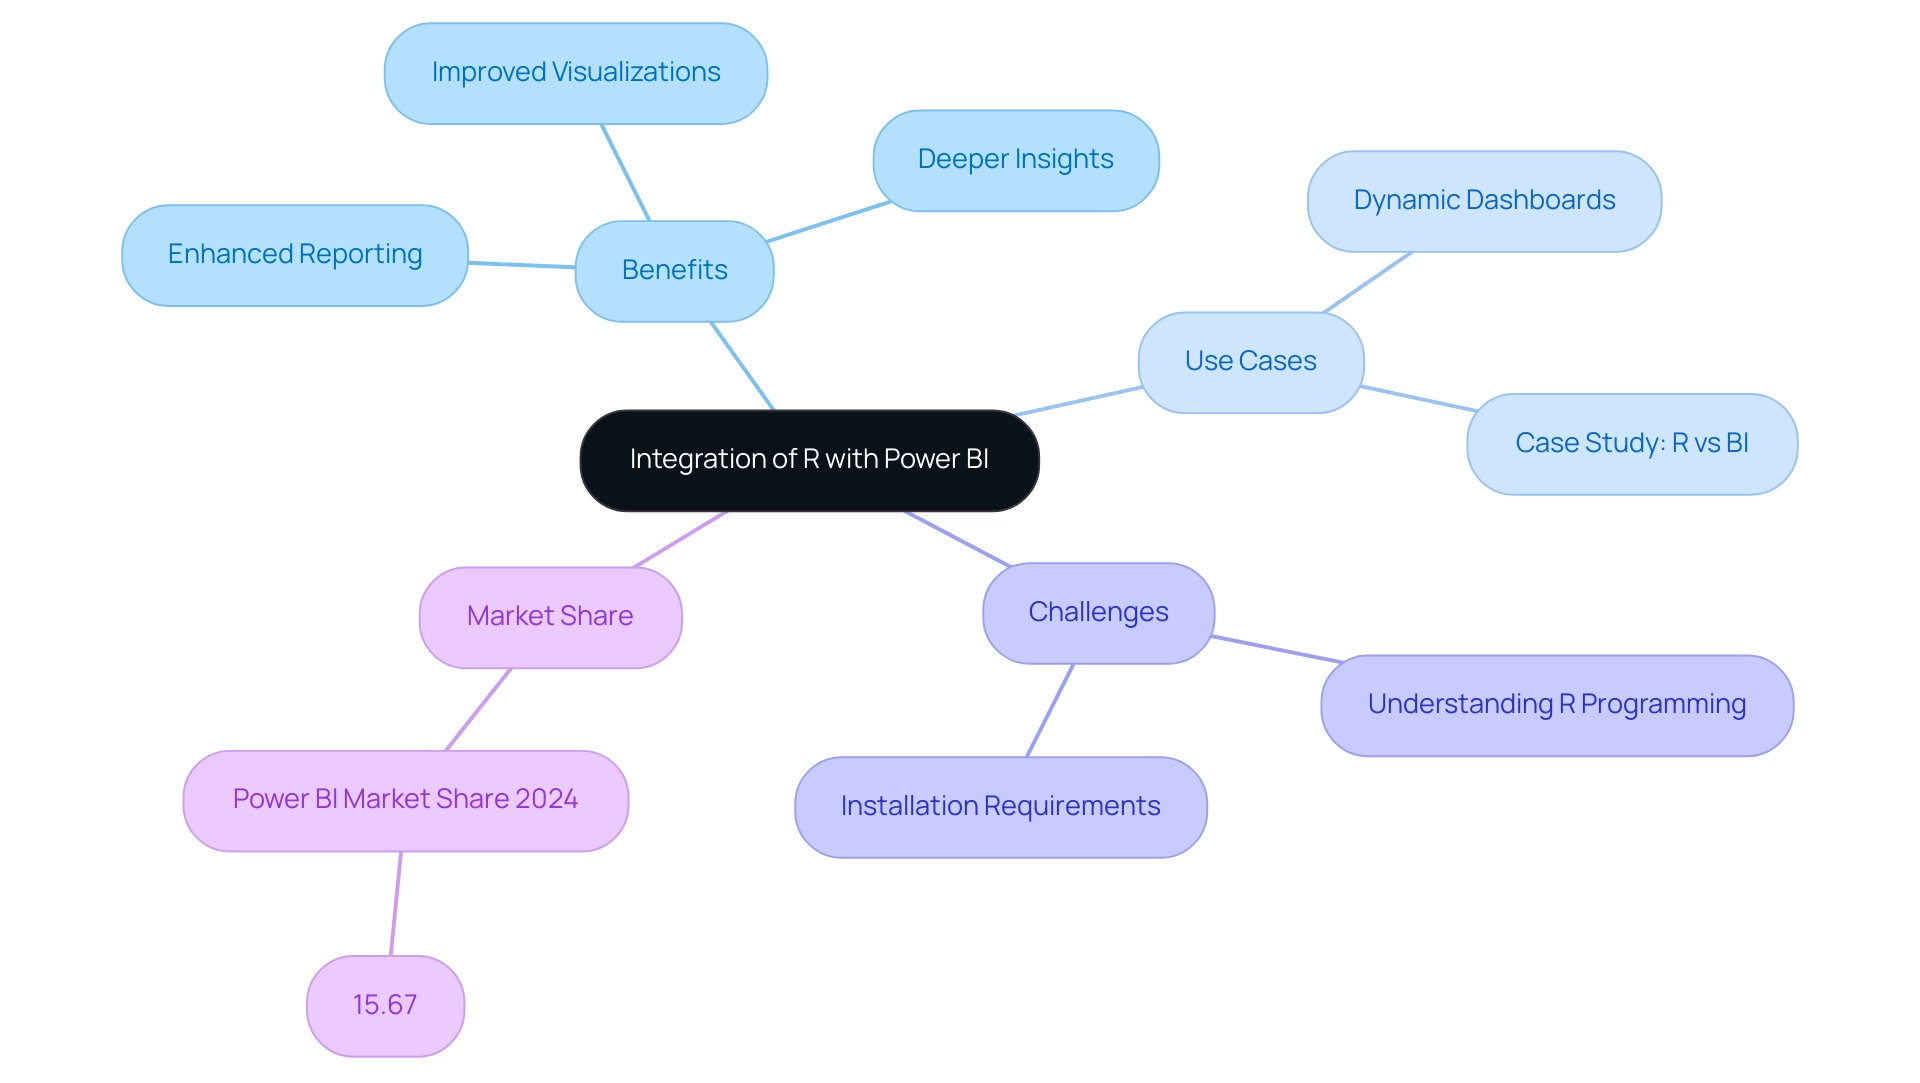
Defining R Power BI: Integration of R with Power BI
The combination of R programming with R Power BI represents a significant advancement in business analytics, enabling users to leverage R’s sophisticated statistical capabilities directly within the R Power BI environment. This synergy not only facilitates the execution of complex analyses and the creation of intricate visualizations but also addresses common challenges in leveraging insights from BI dashboards, such as time-consuming report creation and inconsistencies. Our BI services ensure efficient reporting and clear actionable guidance, highlighted by our 3-Day BI Sprint for rapid report creation and the General Management App for comprehensive management and smart reviews.
A case study titled ‘Visualization: R vs BI’ illustrates BI’s superiority in visual representation due to its user-friendly interface and capability to connect with external sources, enabling quick crafting of visuals. By incorporating R PowerBI scripts into BI, users gain access to an extensive array of statistical methods and visual representations, facilitating deeper insights and more comprehensive analysis. As enterprises progressively aim to enhance their information-driven decision-making, the integration of R Power BI and Business Intelligence empowers analysts and professionals to improve their reporting capabilities efficiently.
Furthermore, it’s important to note, as Akshay Dabhi points out, that while R incorporation provides powerful capabilities, it might require some understanding of the R programming language and its libraries. With BI commanding a notable 15.67% market share in 2024, its ability to seamlessly integrate R Power BI further enhances its position as a leading tool for advanced information analysis and visualization. This integration not only broadens the scope of analytical techniques available but also equips organizations to present information in a more accessible and visually compelling manner, ensuring stakeholders can easily grasp complex insights.
Additionally, the dynamic dashboards in BI enhance financial reporting, providing clearer insights into cash flow and sales. To overcome outdated systems and improve operational efficiency, businesses can leverage EMMA RPA solutions, ultimately transforming their operations and addressing the competitive disadvantage of not utilizing Business Intelligence effectively.
Benefits of R Power BI Integration: Enhancing Data Analysis and Visualization
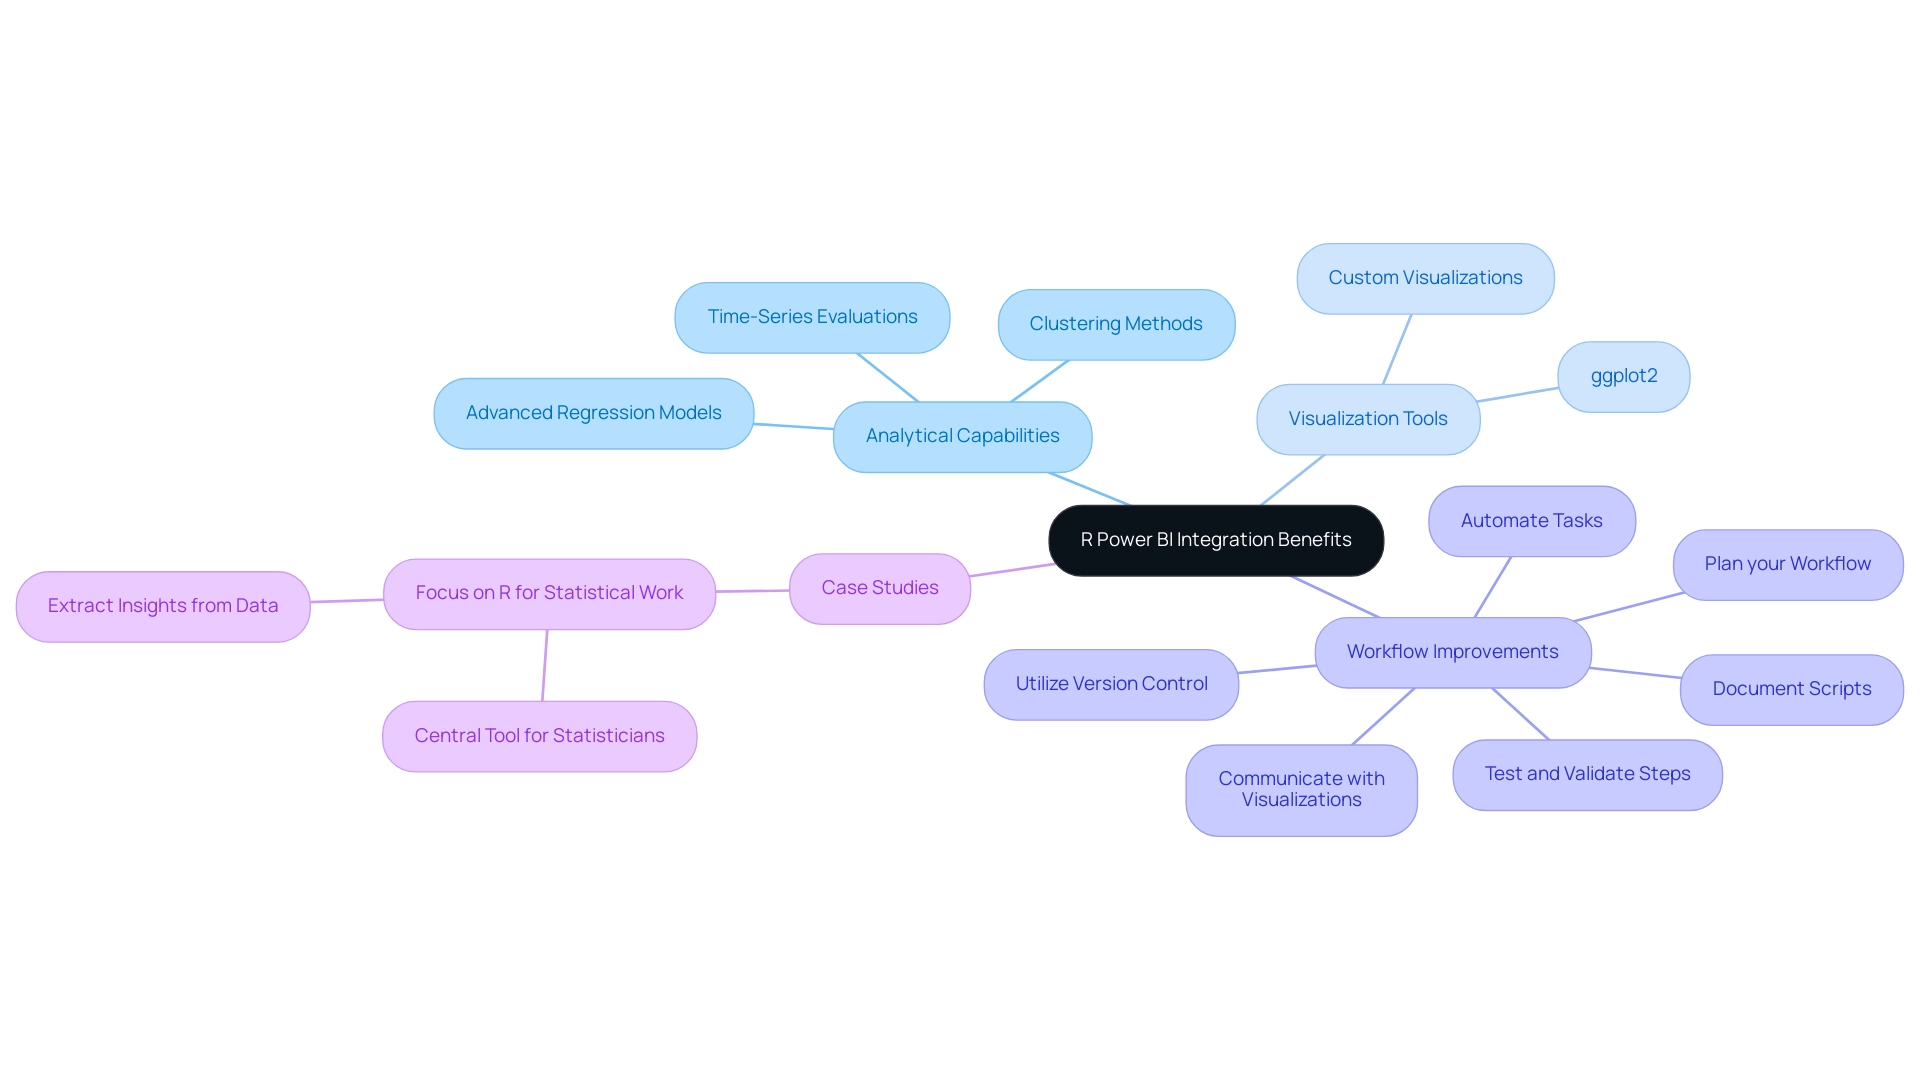
The integration of R Power BI unlocks a wealth of benefits that significantly improve data examination and visualization capabilities. This combination enables users to conduct intricate statistical evaluations that BI does not support inherently, including:
- Advanced regression models
- Clustering methods
- Time-series evaluations via R scripts
This significantly enhances analytical capabilities. Furthermore, R’s powerful visualization libraries, particularly ggplot2, enable the creation of custom visualizations that integrate seamlessly into R Power BI dashboards.
This adaptability encourages narrative construction with information and aids in a more profound comprehension of patterns and trends, essential for making informed choices.
Furthermore, the combination simplifies and automates information evaluation procedures, lessening manual labor and decreasing possible mistakes—a crucial element for operational effectiveness. A recent survey indicated that over 50% of data analysts leverage R for their data analysis needs, affirming its significance in the field. As Akshay Dabhi highlights, while R integration offers powerful capabilities, a solid understanding of the R programming language and its libraries is essential for optimal use.
Utilizing prescriptive analytics in R can also recommend actions that optimize decision-making and achieve desired business outcomes.
Additionally, the 3-Day Power BI Sprint allows organizations to quickly create professionally designed reports, enhancing the efficiency of the reporting process. The General Management App provides extensive management and intelligent evaluations, ensuring that insights are actionable and aligned with business objectives. A pertinent case study, ‘Focus on R for Statistical Work,’ demonstrates that R should be central for statisticians in analysis, providing all necessary tools for statistical work.
To enhance workflows in R for information synthesis, it is recommended to:
- Plan your workflow
- Utilize version control tools like Git
- Automate repetitive tasks
- Document scripts
- Test and validate connection steps
- Communicate effectively with visualizations
Ultimately, the combination of R Power BI and Business Intelligence, along with tailored AI solutions, equips organizations to make informed, data-driven decisions, fostering enhanced operational efficiency and success in business analytics for 2024.
Use Cases of R Power BI Integration: Real-World Applications
Organizations across various sectors are utilizing the strength of R Power BI and Python integration within business intelligence to enhance their analytics capabilities, effectively navigating the overwhelming AI landscape with customized solutions. However, many businesses struggle to extract meaningful insights from their information, which can leave them at a competitive disadvantage.
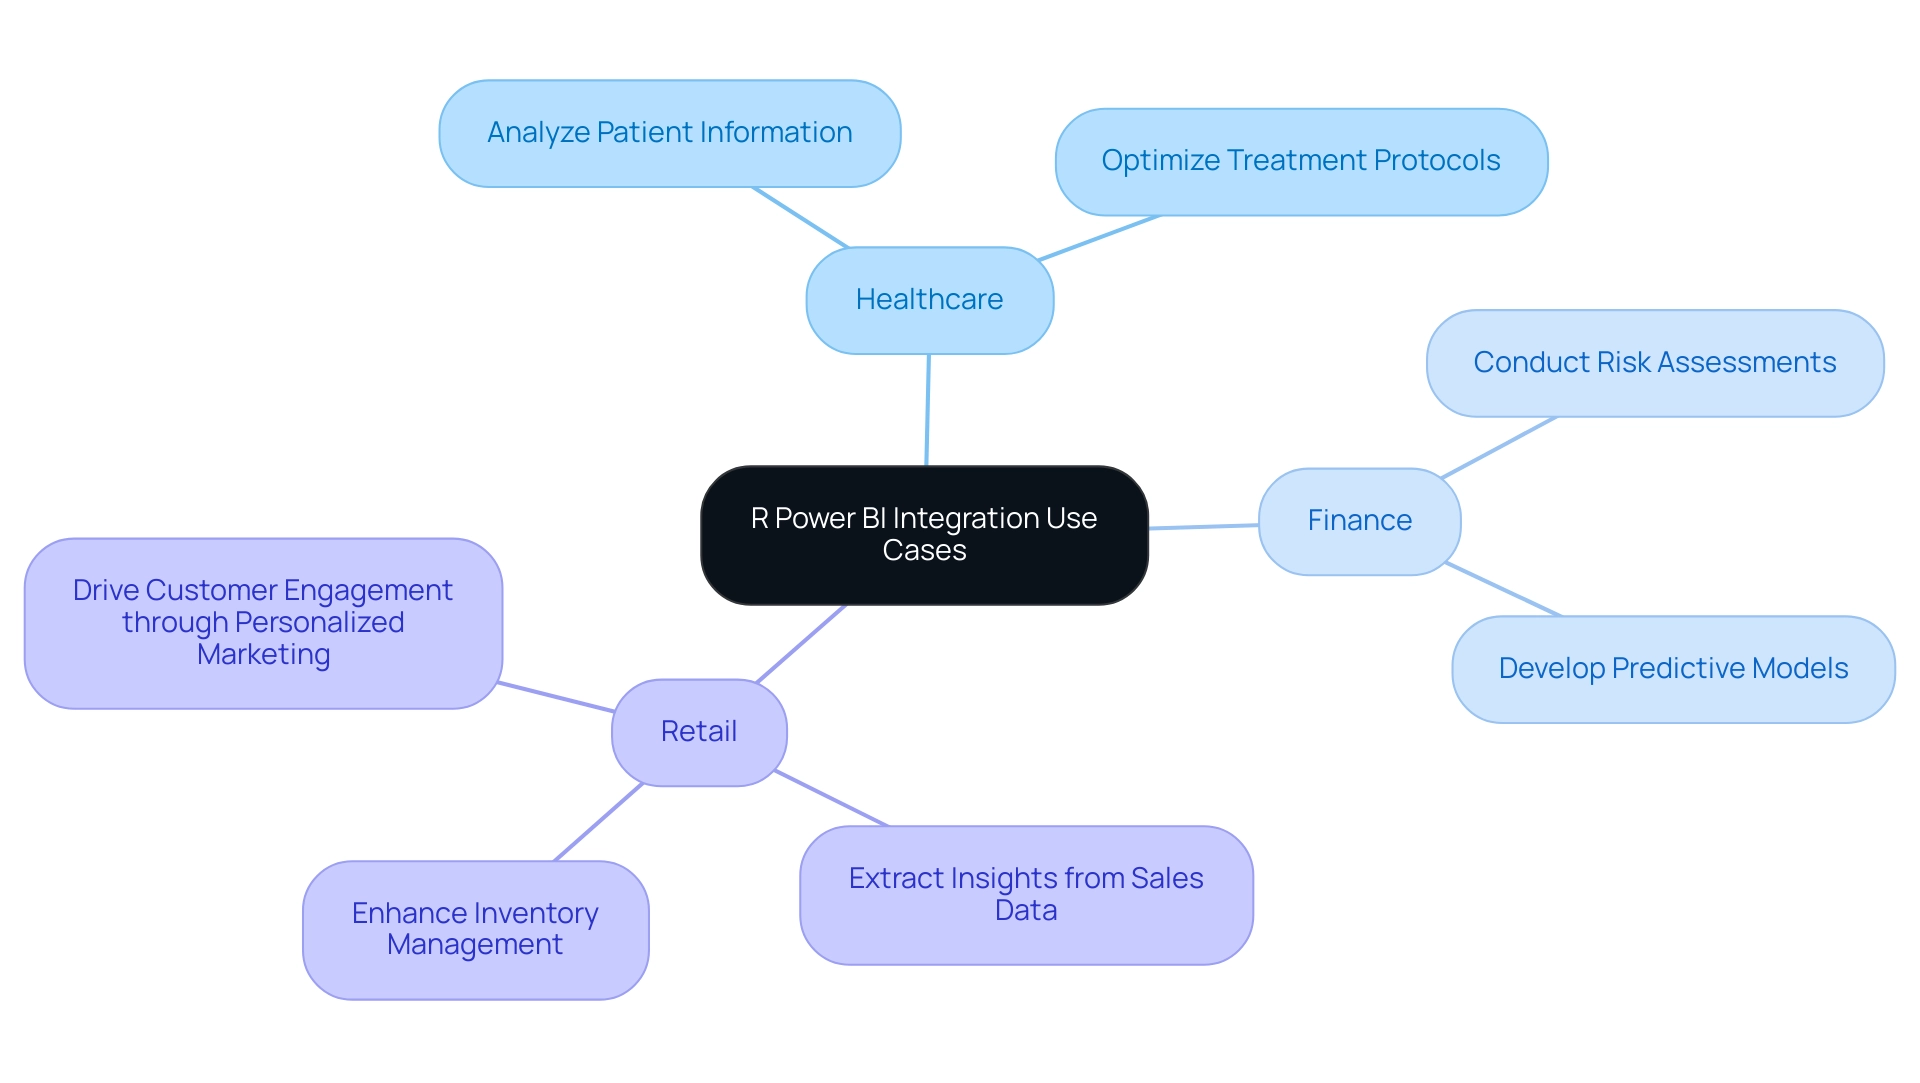
In the healthcare sector, for example, hospitals are utilizing R Power BI to meticulously analyze patient information, enabling them to identify trends in outcomes and optimize treatment protocols for improved patient care.
Similarly, in the finance sector, analysts are leveraging R scripts within R Power BI and Business Intelligence tools to conduct comprehensive risk assessments and develop predictive models that inform strategic investment decisions. Retailers are also using R Power BI to extract valuable insights from sales data, which enhances inventory management and enables personalized marketing efforts that drive customer engagement. Furthermore, the ability to derive actionable insights from Customer Lifetime Value (CLV) analysis is proving crucial for developing effective customer retention strategies.
With Microsoft BI commanding an impressive 15.67% market share in 2024, its popularity underscores its relevance in the industry. As Hemendra Singh, Director and Co-founder of The NineHertz, aptly states, “Being an entrepreneur in the field of the IT sector, it becomes my responsibility to aid my audience with the knowledge of the latest trends in the market.” These real-world applications demonstrate the remarkable versatility of R Power BI integration in addressing specific business challenges and fostering data-driven decision-making, ultimately driving operational efficiency and growth.
By utilizing tailored AI solutions, businesses can cut through the noise and effectively leverage their information to gain a competitive edge.
Challenges and Considerations in R Power BI Integration
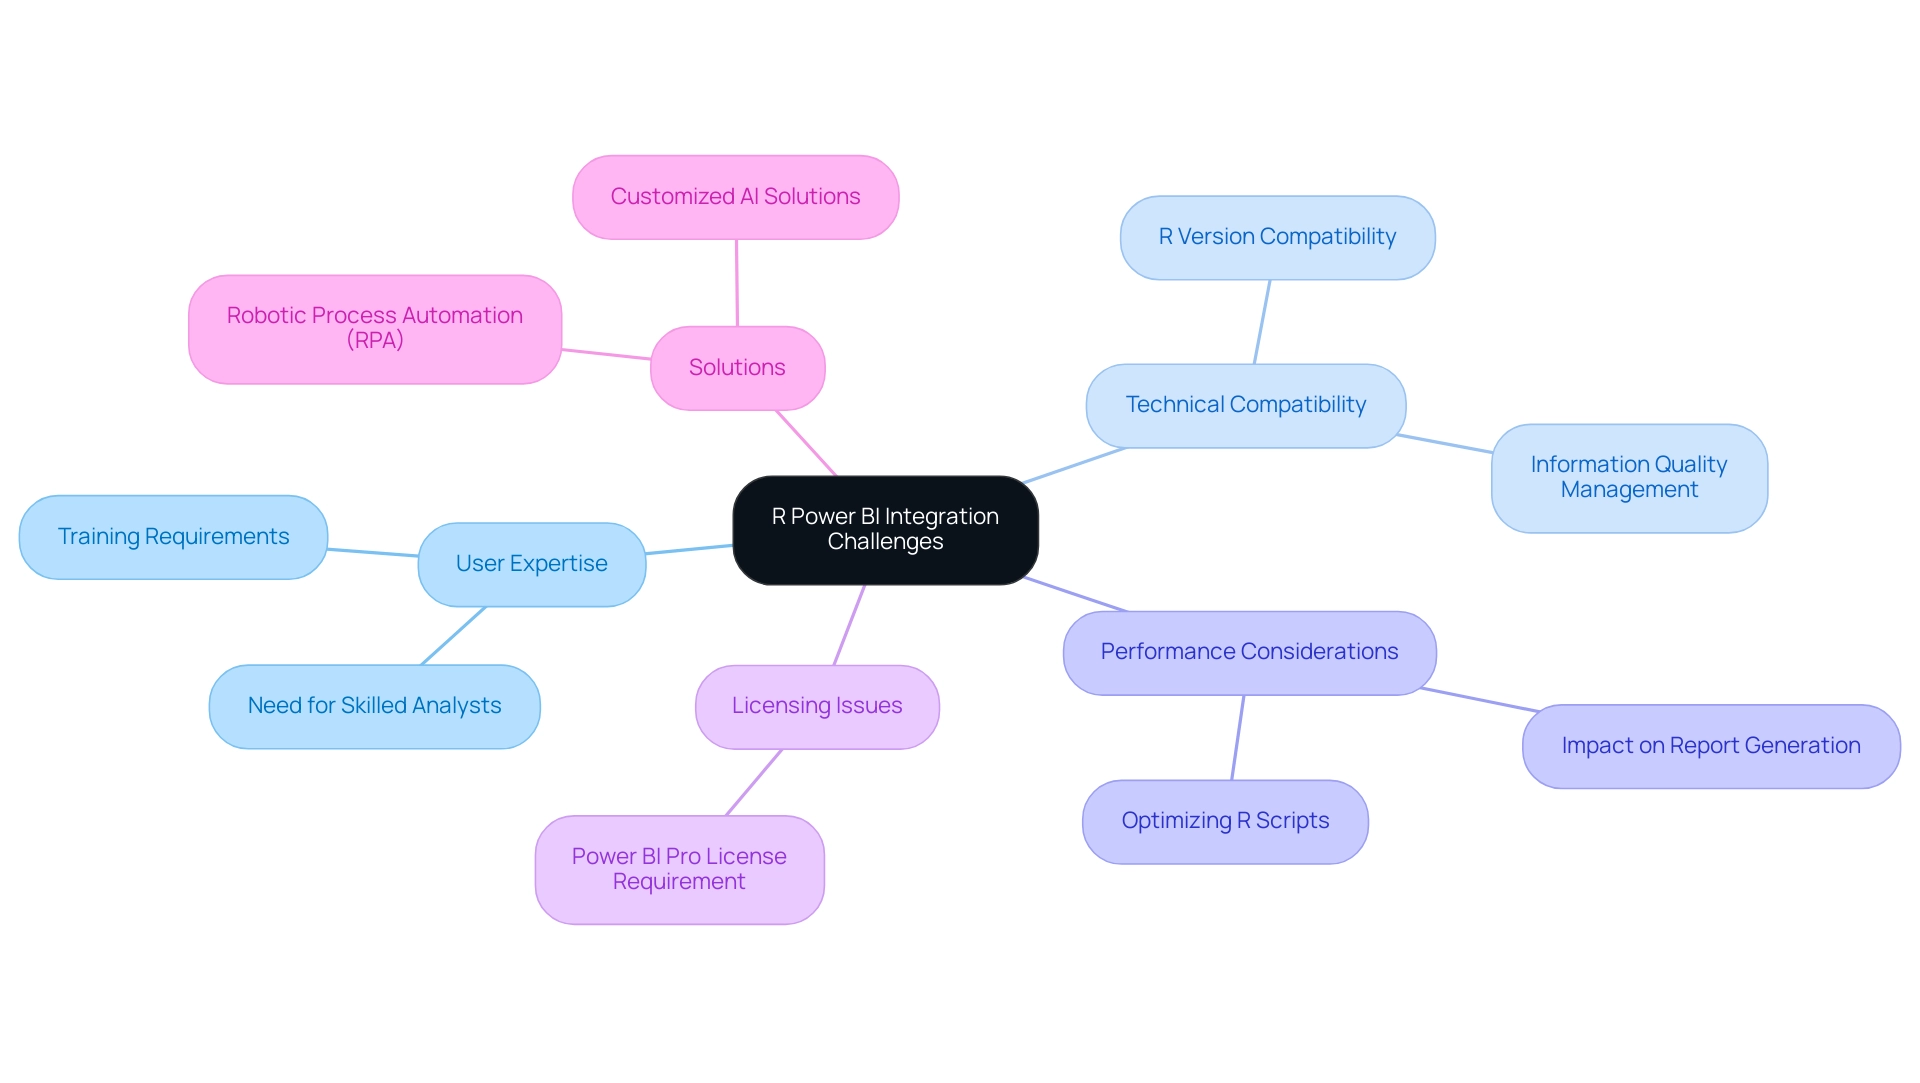
Incorporating R with BI offers organizations remarkable opportunities for advanced analysis, yet it is not without its challenges. A prevalent issue is the critical requirement for users to possess a solid foundation in R programming to fully exploit its capabilities. Without this expertise, organizations may find themselves needing to invest in comprehensive training programs or bring in skilled analysts who are proficient in R. As Janey from the Community Support Team notes,
Logically speaking, if the R script is successfully installed, it should be automatically generated.
This highlights the technical challenges organizations face, particularly regarding the compatibility of R versions with BI. Moreover, ensuring information quality and consistency between R and BI can prove complex, demanding robust management practices to maintain accuracy and reliability. Performance considerations are equally crucial; poorly optimized R scripts have the potential to slow down report generation, impacting user experience.
A key factor to consider is that users typically require a BI Pro license to access shared reports, which can influence the deployment of R-integrated solutions. To overcome these technology implementation challenges, organizations can leverage Robotic Process Automation (RPA) to streamline workflows, enhancing efficiency by reducing manual tasks and errors, ultimately improving report generation times. Furthermore, customized AI solutions can assist in navigating the complexities of the changing information landscape, aligning technologies with specific business objectives.
The BI Dev Dash Competition illustrates how users can successfully navigate these challenges; contestants like Angelica and Allison showcased their skills in cleaning datasets and building interactive reports, emphasizing the importance of both technical prowess and design. Failing to effectively leverage Business Intelligence can leave organizations at a competitive disadvantage, as they may miss out on critical insights that drive innovation and growth. By proactively tackling these challenges and investing in training for R Power BI within BI, organizations can unlock the full potential of their insights capabilities, thereby driving growth and informed decision-making.
For further insights on RPA and AI solutions, organizations are encouraged to explore available resources and training opportunities.
Future Trends in R Power BI Integration
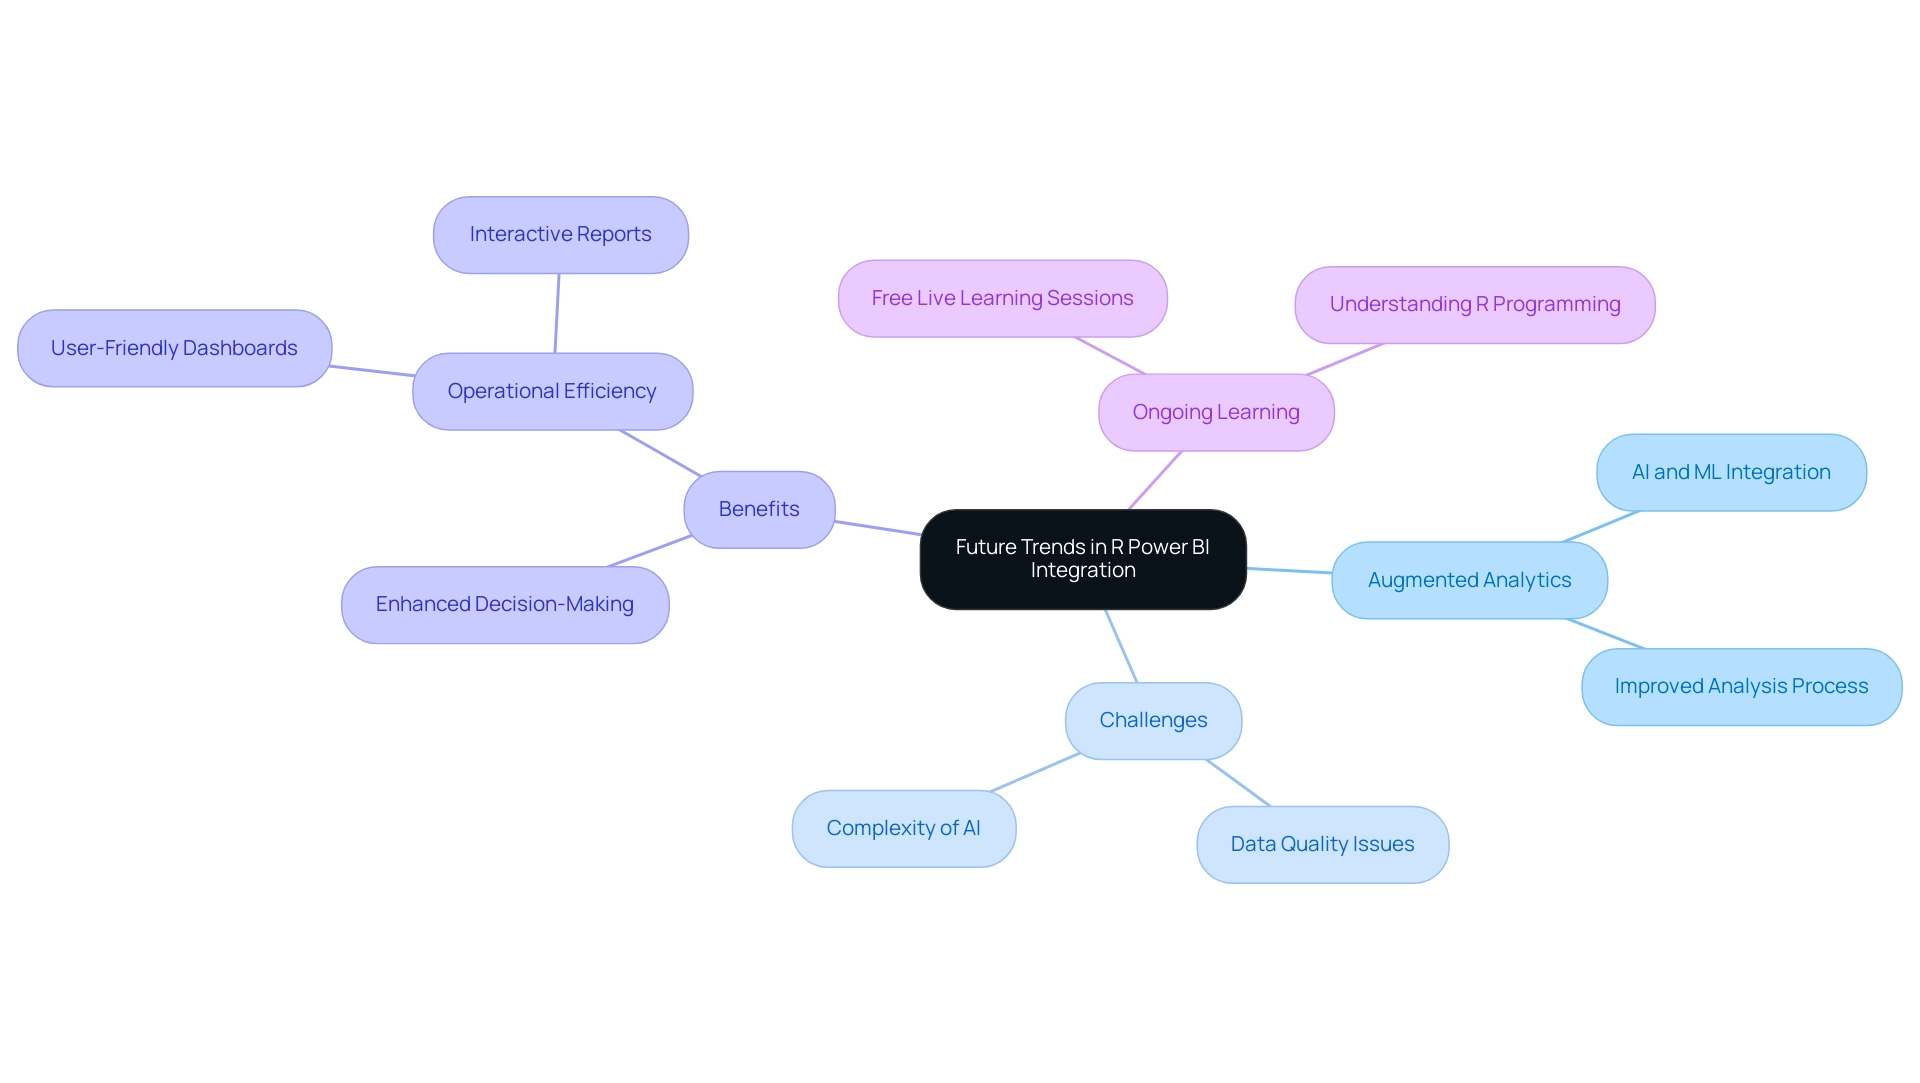
The future of integrating R with Business Intelligence is increasingly bright as organizations recognize the critical role of data-driven decision-making. One significant trend is augmented analytics, where artificial intelligence and machine learning improve the analysis process. This change is anticipated to transform how R is used within Business Intelligence, tackling frequent issues such as inadequate master information quality and the hesitance to embrace AI because of views on complexity, expense, and the notion that AI initiatives are time-consuming.
As companies produce substantial quantities of data, the need for sophisticated analytical abilities will increase, further promoting improvements in R’s compatibility with BI.
According to Akshay Dabhi, “It’s important to note that while R incorporation provides powerful capabilities, it might require some understanding of the R programming language and its libraries.” Organizations that proactively embrace these trends and invest in ongoing learning, such as participating in free live learning sessions, will be well-equipped to utilize R analytics, fostering innovation and maintaining a competitive edge.
Moreover, companies like Digixvalley exemplify how effective use of R in Business Intelligence can significantly enhance operational efficiency through intuitive dashboards. By utilizing their knowledge as a BI consulting partner, they illustrate how R connection can result in enhanced decision-making and efficient operations.
Furthermore, the recent update permitting BI Mobile applications to support folders in workspaces demonstrates practical advancements that improve R compatibility, allowing users to navigate organized items efficiently. As we look toward 2024, the trajectory of R Power BI integration will likely focus on refining augmented analytics and leveraging AI to elevate decision-making capabilities, helping organizations overcome challenges in the daunting AI landscape and addressing common apprehensions about AI accessibility.
Conclusion
The integration of R programming with Microsoft Power BI offers a powerful synergy that revolutionizes data analysis and visualization capabilities. By harnessing R’s advanced statistical techniques within the user-friendly Power BI environment, organizations can perform complex analyses and create compelling visual narratives that drive informed decision-making. This combination not only enhances reporting efficiency but also empowers businesses across various sectors, from healthcare to finance, to extract deeper insights and elevate their operational efficiency.
While the advantages of R Power BI integration are significant, organizations must also consider the challenges that come with it. A solid understanding of R programming is essential for users to fully leverage its potential, necessitating investments in training and data management practices. Additionally, addressing performance and compatibility issues is crucial for ensuring that analytics processes run smoothly and effectively. By proactively tackling these challenges with tailored solutions, such as Robotic Process Automation and ongoing learning opportunities, businesses can unlock the full potential of their data analytics capabilities.
Looking ahead, the future of R Power BI integration is promising, driven by trends such as augmented analytics and the increasing demand for advanced analytical capabilities. Organizations that embrace these developments and invest in continuous improvement will be well-positioned to navigate the evolving landscape of business intelligence. As the capabilities of R and Power BI continue to expand, businesses can expect to achieve greater operational success and maintain a competitive edge in their respective markets.

