Overview
Mastering DAX SUM with filters is crucial for professionals seeking to elevate their data analysis skills. This capability enables precise calculations tailored to specific criteria through the CALCULATE function. Various practical applications of DAX SUM with filters, such as:
- Sales performance analysis
- Year-over-year comparisons
illustrate its significance. These techniques not only drive informed decision-making but also enhance operational efficiency, underscoring their value in a competitive landscape.
Introduction
In the realm of data analysis, the DAX SUM function stands as a cornerstone for professionals seeking to derive meaningful insights from their datasets. As organizations increasingly rely on data-driven decision-making, understanding how to effectively utilize this powerful aggregation tool becomes paramount. With its straightforward syntax and crucial role in platforms like Power BI, mastering the DAX SUM function not only streamlines report creation but also enhances the accuracy of business intelligence efforts.
This article delves into the intricacies of DAX SUM, exploring its applications, the importance of filters, and practical strategies for overcoming common challenges. Ultimately, it equips data analysts with the knowledge to transform raw data into actionable insights.
Understanding DAX SUM: The Foundation of Data Analysis
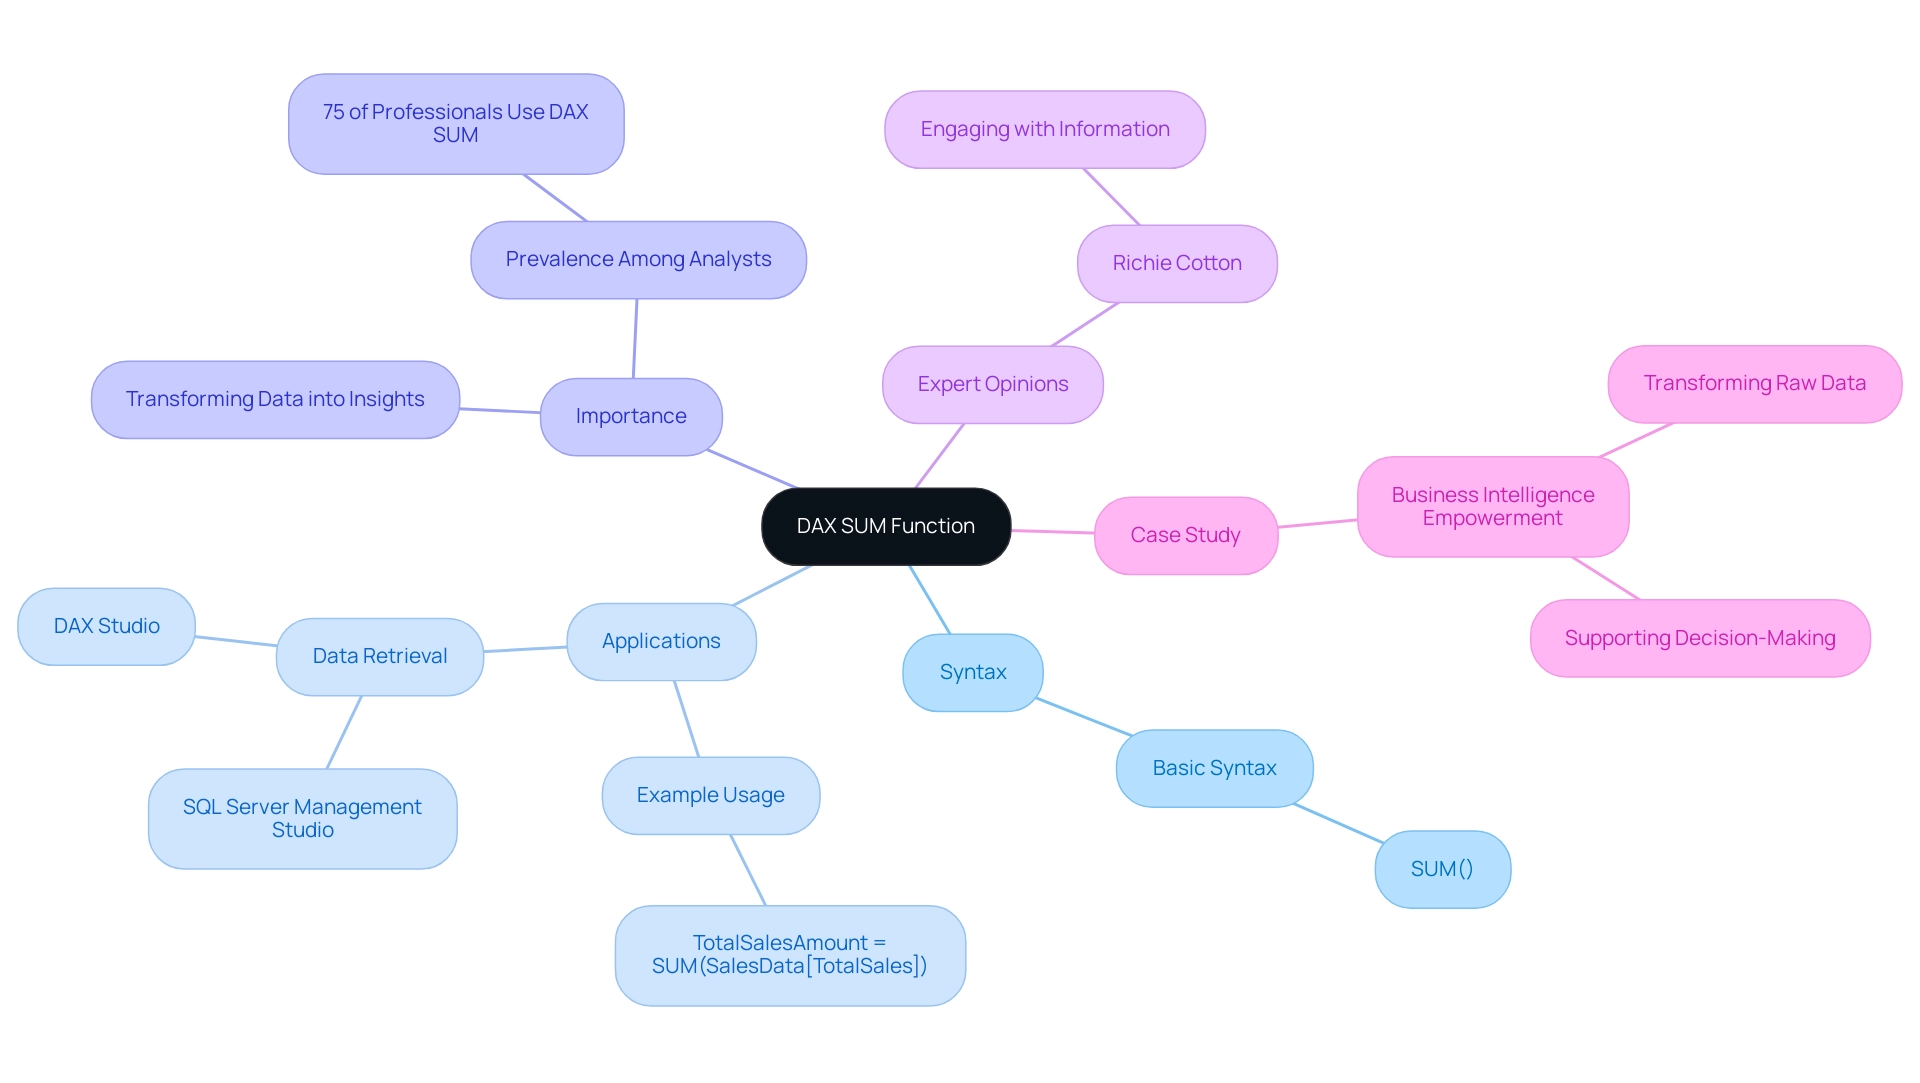
The DAX SUM formula serves as a fundamental tool for aggregating numerical data within a specified column, characterized by its straightforward syntax: SUM(<Column Name>). For example, to calculate total sales from a column named ‘Sales’, the formula SUM(Sales) is employed. This feature is essential for executing basic aggregations in Power BI, enabling users to effectively summarize information for insightful reports and dashboards. Addressing challenges such as time-consuming report creation and inconsistencies is critical in today’s data-driven environment.
As we look to 2025, the prevalence of the DAX SUM function among analysts remains significant, with approximately 75% of professionals relying on it for aggregation tasks. This underscores its importance in the realm of Business Intelligence, where transforming raw data into actionable insights is vital for informed decision-making and fostering growth. The ability to generate and execute DAX queries in applications like SQL Server Management Studio and DAX Studio further enhances its utility, facilitating effortless data retrieval and manipulation.
Mastering the effective use of DAX SUM with filters is crucial for those aiming to excel in DAX analysis. A pertinent case study, ‘Business Intelligence Empowerment’, illustrates how organizations leveraged DAX SUM with filters to convert raw sales data into actionable insights, significantly enhancing informed decision-making and supporting growth. This case study exemplifies the direct impact of the DAX SUM operation on business outcomes, aligning with the operational efficiency goals pursued by RPA solutions such as EMMA RPA from Creatum GmbH.
Expert opinions consistently highlight the significance of performing a DAX SUM with filter operation in Power BI, especially for information aggregation. Noted analytics expert Richie Cotton asserts, “Engaging with information is crucial for deriving meaningful insights.” This perspective reinforces the role of the DAX SUM with filter formula in streamlining the aggregation process, thereby enhancing the overall analytical capabilities of Power BI users.
Real-world applications of the DAX SUM capability in Power BI showcase its versatility. For instance, if you have a table named ‘SalesData’ with a column ‘TotalSales’, calculating the total sales amount can be accomplished with:
TotalSalesAmount = SUM(SalesData[TotalSales])
This straightforward implementation exemplifies how the DAX SUM function can be utilized to provide quick and accurate data summaries, solidifying its status as a cornerstone of effective data analysis. Furthermore, mastering DAX is best achieved through software designed for information modeling, ensuring users fully comprehend the nuances of these powerful capabilities. To explore how Creatum GmbH’s solutions can enhance your information analysis capabilities, book a free consultation today.
The Role of Filters in DAX SUM: Enhancing Data Accuracy
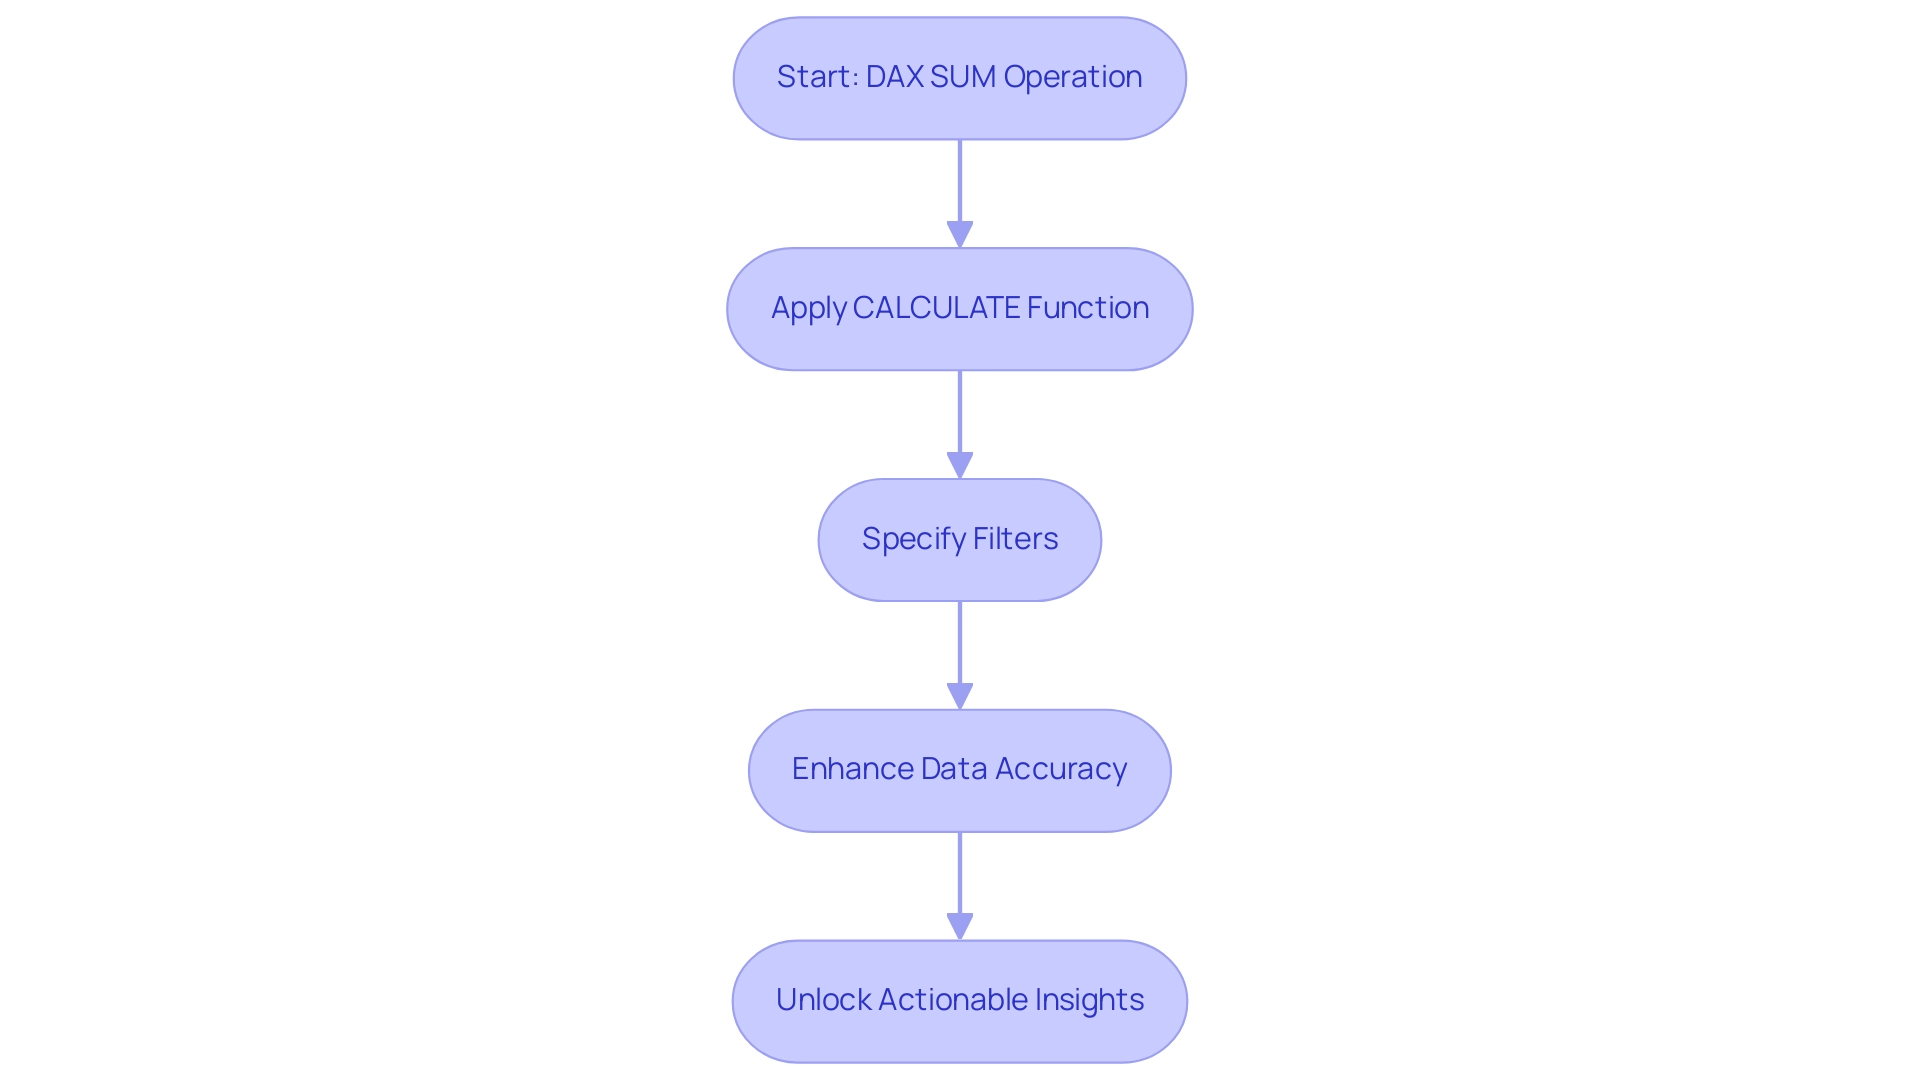
The DAX sum with filter is essential for refining the information processed by the SUM operation, enabling precise calculations tailored to specific criteria. By leveraging the CALCULATE function, users can effectively apply DAX sum with filter within their DAX formulas. For instance:
TotalSalesWest = CALCULATE(SUM(SalesData[TotalSales]), SalesData[Region] = "West")
This formula computes the total sales for the ‘West’ region, illustrating how targeted filtering enhances data accuracy. In 2025, the impact of filters on DAX calculations is underscored by the fact that well-structured filters significantly improve the reliability of insights obtained from analysis, which is crucial for driving business growth through informed decision-making.
Current trends in information filtering methods emphasize the importance of understanding filter context, as highlighted in a recent case study titled ‘Optimization Techniques for Filter Context in Power BI.’ This study reveals that employing strategies such as simplifying DAX calculations and utilizing tools like ALL, REMOVEFILTERS, and KEEPFILTERS can lead to substantial performance improvements in Power BI reports. By mastering these techniques, users can unlock actionable insights that drive informed decision-making, addressing challenges like time-consuming report creation and information inconsistencies.
Moreover, expert opinions in 2025 suggest that the CALCULATE function remains a cornerstone of effective DAX usage, particularly in scenarios requiring nuanced information analysis. The ability to manipulate filter context not only enhances calculation accuracy but also empowers professionals to derive meaningful insights from complex datasets. As Rutuja Dinde aptly notes, “With the right approach, filter context becomes a powerful tool for unlocking actionable insights.”
Incorporating the DAX sum with filter through slicers in Power BI visuals or directly within DAX formulas allows for focused analysis, ensuring that the information examined is relevant and actionable. This strategic use of filters is essential for optimizing information accuracy and enhancing overall operational efficiency, critical in today’s information-rich environment. Furthermore, for those eager to expand their knowledge, the forthcoming FabCon Vegas event from March 31 to April 2 offers a $400 discount with code FABINSIDER for conference registration, presenting a fantastic opportunity to learn more about DAX and analysis techniques.
Additionally, Creatum GmbH’s RPA solutions can enhance these DAX functions by automating repetitive tasks, thus improving efficiency and addressing staffing shortages, ultimately supporting better information management and insight generation.
Practical Applications: Using DAX SUM with Filters in Real Scenarios
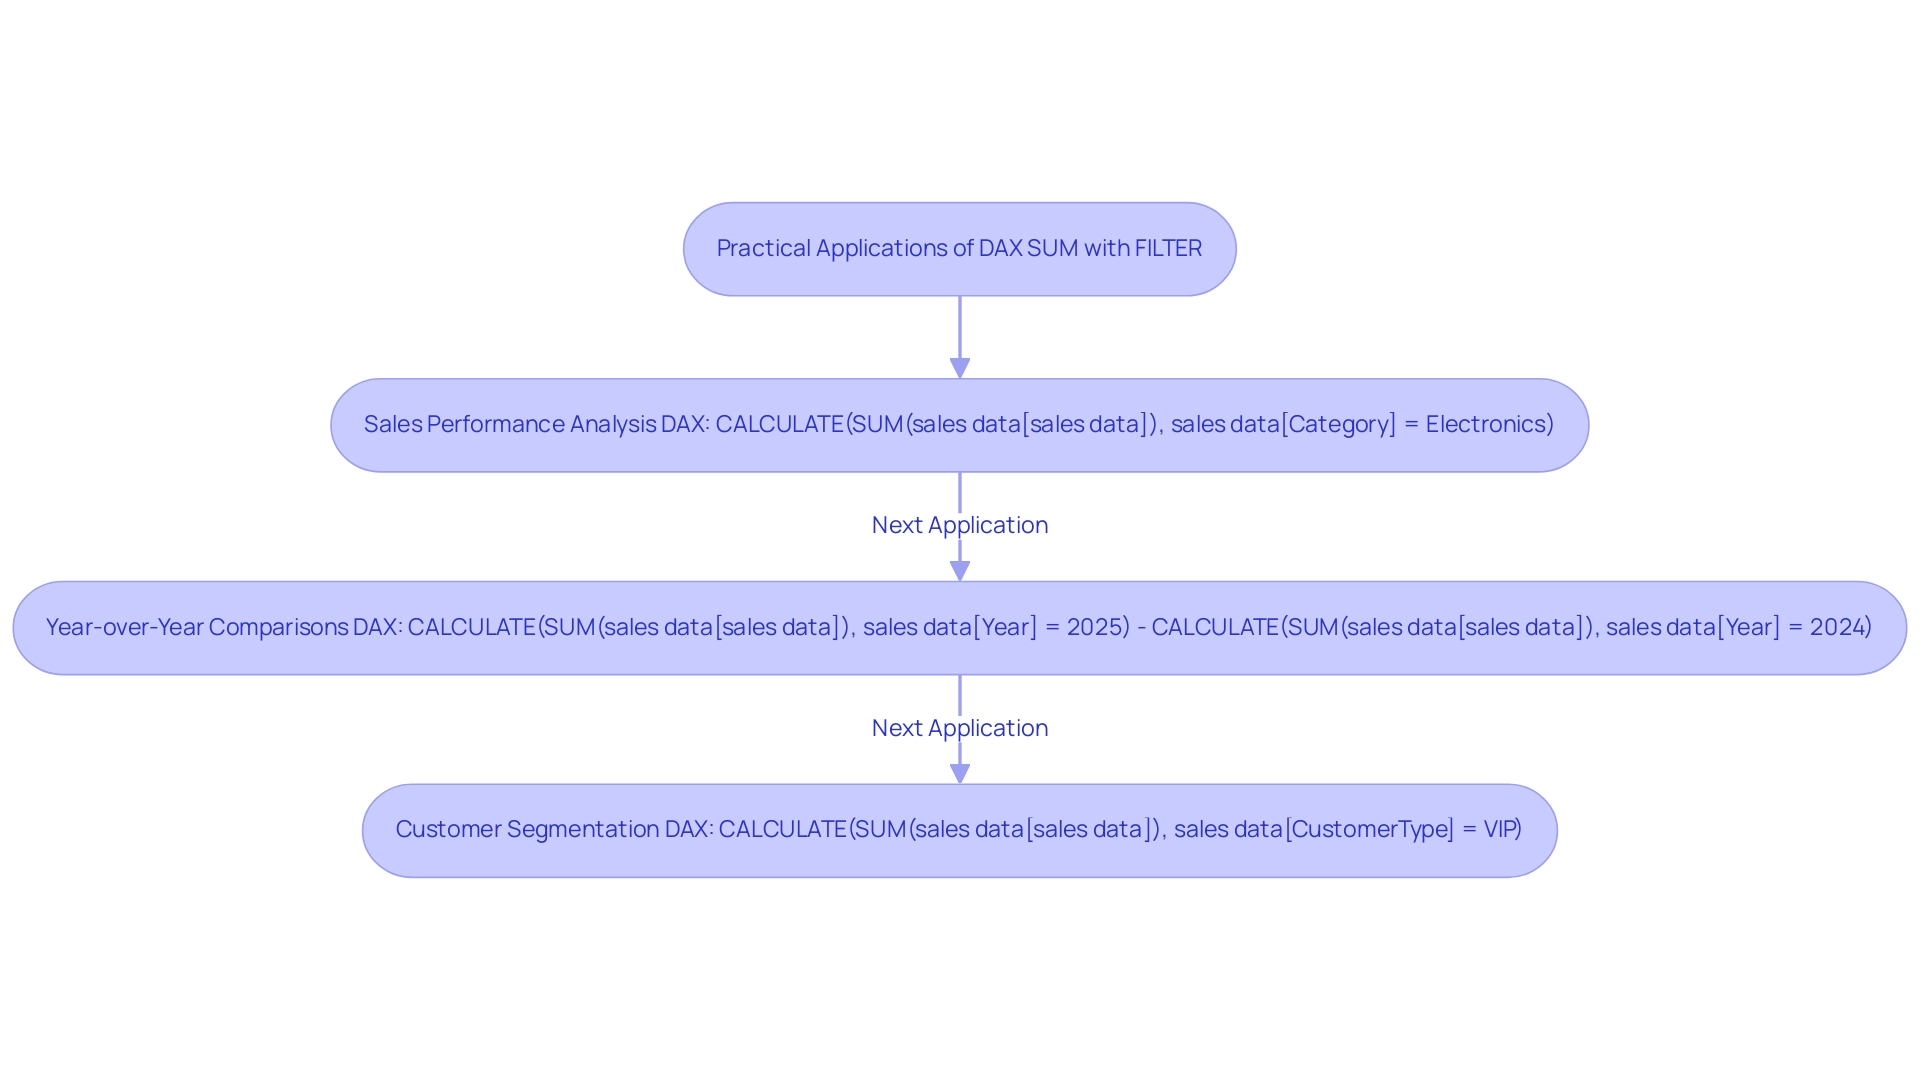
Utilizing DAX SUM with FILTER significantly enhances analytical capabilities, providing precise insights into sales performance and growth trends. In today’s data-rich environment, where extracting meaningful insights is crucial for maintaining a competitive edge, several practical applications emerge:
-
Sales Performance Analysis: Calculating total sales for specific products or categories allows businesses to focus on their most profitable segments. For instance:
total electronics sales = CALCULATE(SUM(sales data[sales data]), sales data[Category] = "Electronics")This formula enables analysts to isolate sales data for electronics, facilitating targeted marketing strategies and effective inventory management. Custom visual files in Power BI prove especially beneficial when prepackaged visuals fall short of business requirements, enabling tailored insights that address inaccuracies and enhance operational efficiency.
-
Year-over-Year Comparisons: Understanding sales growth is essential for strategic planning. By comparing current year sales to previous years, organizations can assess their performance trajectory:
sales growth = CALCULATE(SUM(sales data[sales data]), sales data[Year] = 2025) - CALCULATE(SUM(sales data[sales data]), sales data[Year] = 2024)This calculation provides a clear view of year-over-year growth, crucial for evaluating business health and forecasting future sales. Notably, the Y-axis of the graph illustrates the switchable measure, either Profit or Sales, highlighting the versatility of DAX SUM in performance analysis and the importance of actionable guidance in decision-making.
-
Customer Segmentation: Analyzing sales performance across different customer segments reveals valuable insights into purchasing behaviors. For example:
total sales vip = CALCULATE(SUM(sales data[sales data]), sales data[CustomerType] = "VIP")This measure aids businesses in understanding the contribution of VIP customers to overall sales, guiding loyalty programs and personalized marketing efforts. A Data Analyst with seven years of experience, who transitioned to an Associate Data Engineer role, found success through a Certification course, underscoring the importance of enhancing analytical skills to overcome challenges in leveraging insights.
Beyond these DAX applications, integrating RPA solutions like EMMA RPA and Power Automate significantly enhances operational efficiency. By automating repetitive information preparation tasks, organizations can free up valuable time for analysts to concentrate on deriving insights from their findings. These RPA tools optimize workflows and ensure information consistency, ultimately resulting in more precise and prompt decision-making.
These examples illustrate how DAX SUM with FILTER can effectively extract actionable insights from data, driving informed decision-making and enhancing operational efficiency. In 2025, organizations leveraging these techniques are expected to see significant improvements in year-over-year sales growth, reinforcing the importance of data-driven strategies in today’s competitive landscape. As professionals such as Business Analysts, Business Owners, and Business Developers increasingly utilize Power BI, mastering DAX functions alongside RPA solutions becomes essential for success.
Common Challenges in Implementing DAX SUM with Filters
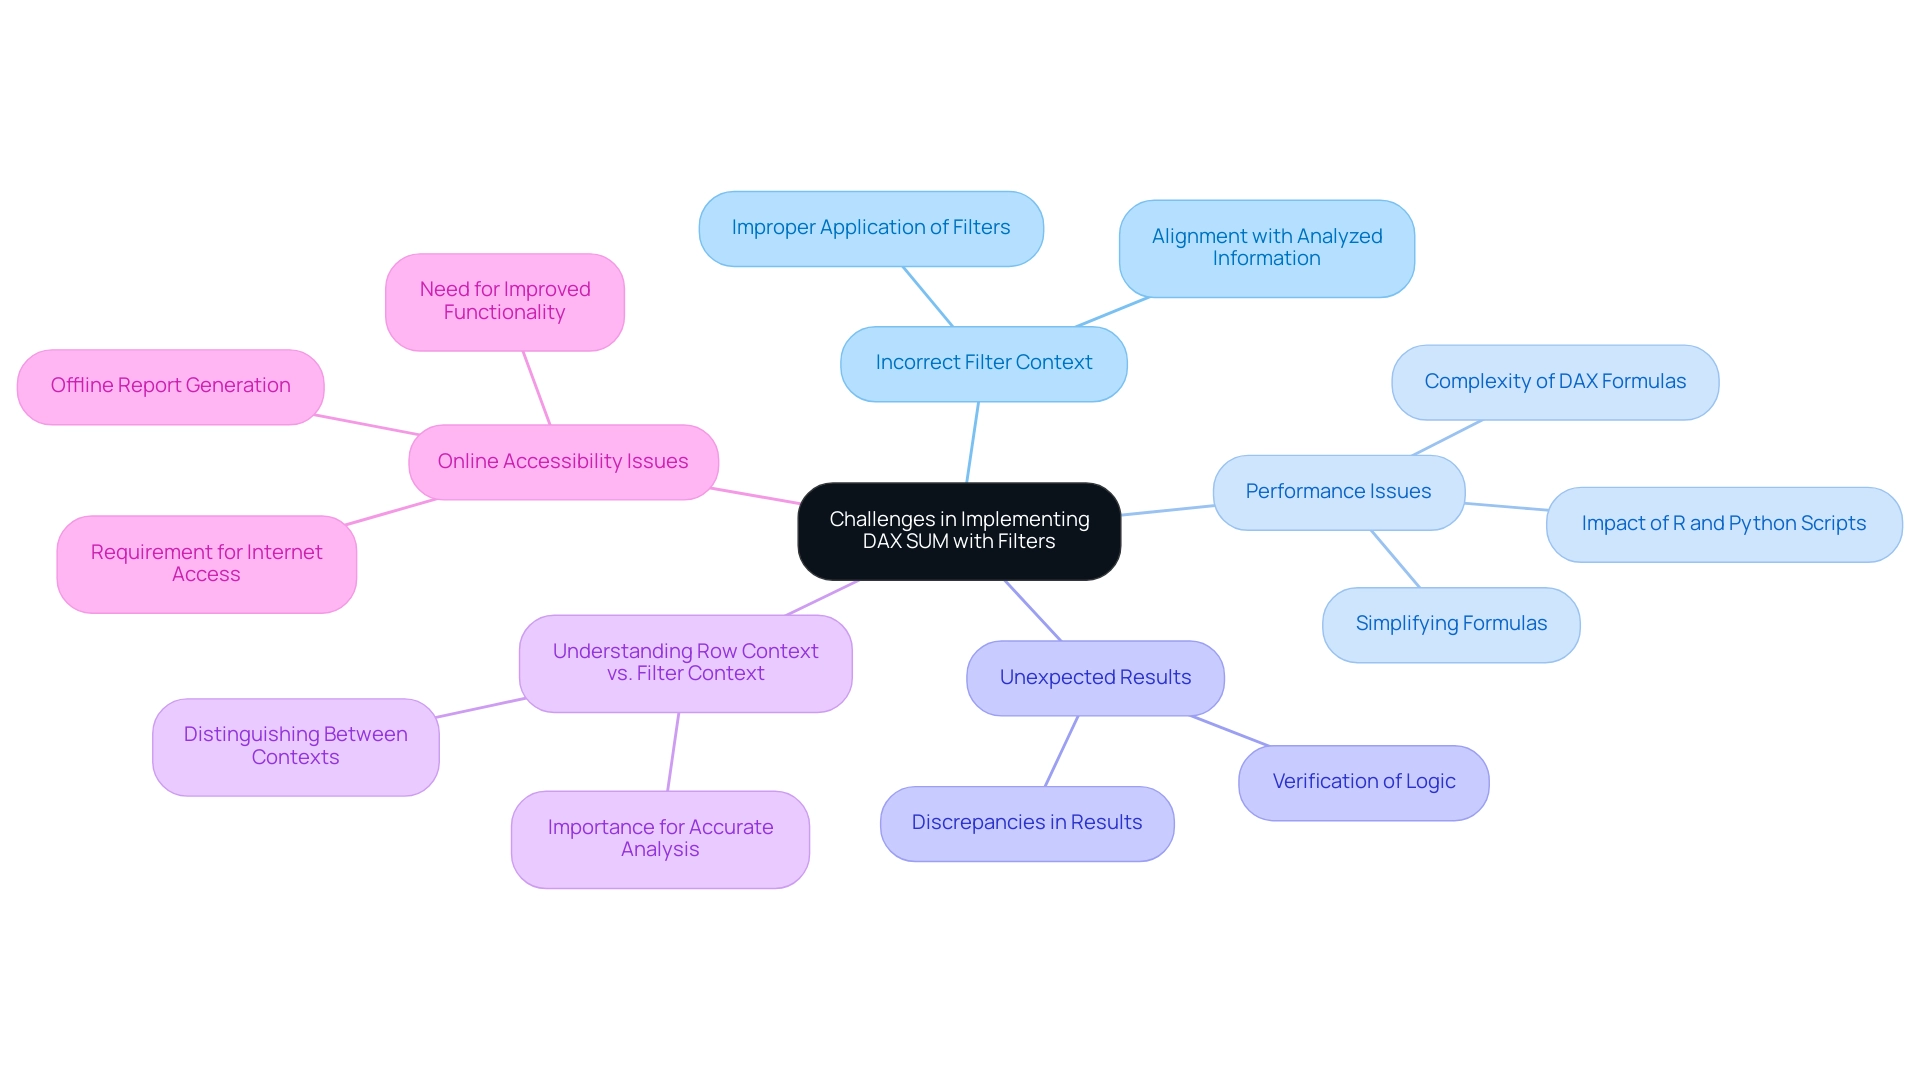
Utilizing DAX SUM in conjunction with filters can significantly enhance your data analysis capabilities. However, it is essential to be aware of several prevalent challenges:
-
Incorrect Filter Context: One of the most common pitfalls is the improper application of filters. If the filter context is not accurately established, the filters may yield unexpected results. To maintain accuracy in your calculations, ensure that your filters align with the specific information being analyzed for the DAX SUM with filter.
-
Performance Issues: The complexity of DAX formulas, particularly those incorporating multiple filters, can lead to performance degradation. Statistics indicate that intricate calculations can significantly slow down processing times. Additionally, running R and Python scripts in Power BI can further impact performance due to their resource-intensive nature. To mitigate this, consider simplifying your formulas or utilizing variables to streamline calculations. This approach aligns with the principles of Robotic Process Automation (RPA), which aims to boost operational efficiency by reducing manual, repetitive tasks.
-
Unexpected Results: Analysts often encounter discrepancies between expected and actual results, frequently due to overlapping filters or flawed logic within the DAX formula. It is advisable to rigorously verify your logic and conduct tests with sample datasets to ensure that your calculations produce the intended outcomes. This verification process is essential, particularly in the context of utilizing Business Intelligence tools to derive actionable insights from information.
-
Understanding Row Context vs. Filter Context: A common source of confusion lies in distinguishing between row context and filter context. Misunderstanding how DAX evaluates expressions in these different contexts can lead to calculation errors. Gaining a solid grasp of these concepts is vital for accurate information analysis and avoiding common mistakes, particularly when dealing with poor master quality that can hinder effective decision-making.
-
Online Accessibility Issues: As highlighted in a case study, Power BI requires internet access for its service, which can be problematic for users needing offline access or those with poor connectivity. This limitation can affect the implementation of DAX SUM with filter, leading users to generate reports in PDF or PPT format for offline sharing. Addressing these accessibility challenges is essential for ensuring that your analysis remains robust and reliable.
Utpal Kar noted, “This is one of the major Power BI drawbacks as Microsoft has designed Power BI in a very complex manner.” This complexity can worsen the challenges encountered by analysts when utilizing DAX operations. By tackling these challenges proactively, professionals can improve their proficiency in implementing DAX SUM with filter, leading to more reliable and insightful analysis that ultimately supports informed decision-making in their organizations.
Additionally, tailored AI solutions can play a crucial role in overcoming these challenges by providing targeted technologies that align with specific business goals. Organizations often face hurdles in adopting AI due to concerns about integration and resource allocation. By utilizing AI, companies can optimize their information processes, enhance information quality, and improve the overall efficiency of DAX operations in Power BI.
Best Practices for Mastering DAX SUM with Filters
To effectively master DAX sum with filter, consider the following best practices:
-
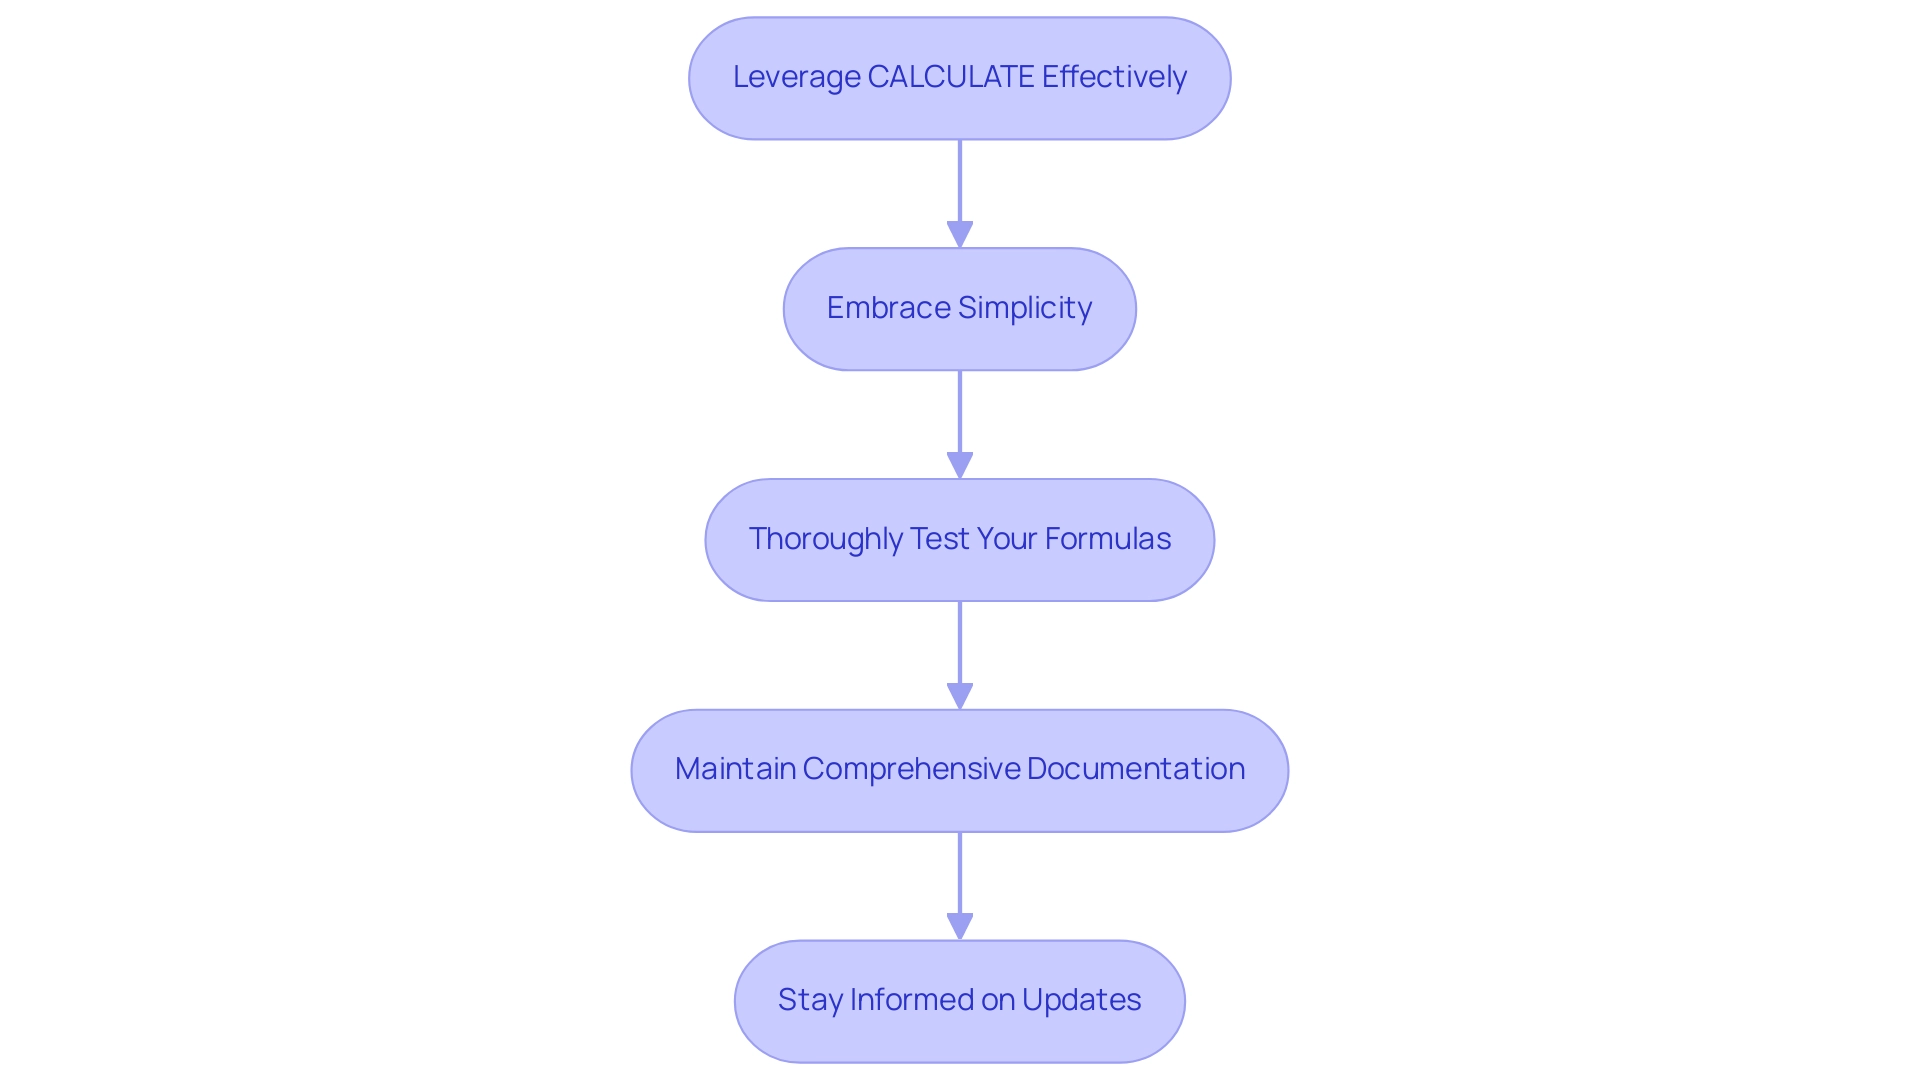
Leverage CALCULATE Effectively: Always encapsulate your SUM operation within CALCULATE when applying filters. This ensures the correct context is applied, allowing for accurate calculations that reflect the intended data scope.
-
Embrace Simplicity: Begin with straightforward calculations, progressively introducing complexity as your confidence with DAX grows. This approach fosters a solid foundation and reduces the likelihood of errors.
-
Thoroughly Test Your Formulas: Utilize sample datasets to rigorously test your DAX formulas prior to deploying them on larger datasets. This practice not only helps identify potential errors early but also enhances overall performance. For instance, utilizing the DIVIDE method prevents Division by Zero Errors and enhances performance compared to the traditional division operator.
-
Maintain Comprehensive Documentation: Keep detailed notes on your DAX formulas and the underlying logic. This documentation serves as a valuable reference for both you and your colleagues, facilitating better understanding and collaboration in future projects.
-
Stay Informed on Updates: DAX is an evolving language, with new functions and features regularly introduced. Staying informed about these changes can significantly improve your analysis capabilities, enabling you to leverage the latest advancements in AI-driven insights and analytics. As mentioned in recent conversations, AI capabilities allow real-time insights and improve decision-making by delivering precise and prompt information for strategic outcomes.
By following these best practices, you can enhance your DAX skills and ensure that your analysis is both effective and efficient, ultimately driving better decision-making and strategic outcomes. Additionally, leveraging Robotic Process Automation (RPA) from Creatum GmbH can streamline your workflows, reduce errors, and free up your team for more strategic tasks, further enhancing operational efficiency. As Praveen, a Digital Marketing Specialist, emphasizes, mastering these skills is crucial for professionals looking to excel in data-driven environments. Furthermore, addressing challenges in utilizing insights from Power BI dashboards, such as time-consuming report creation and inconsistencies, is essential for maximizing the effectiveness of your analysis efforts.
Comparative Analysis: DAX SUM vs. Other DAX Functions
In Power BI, a nuanced comprehension of DAX operations is essential for effective analysis, particularly in a landscape where utilizing Business Intelligence can convert raw information into actionable insights. Here’s a comparative analysis of key DAX operations:
-
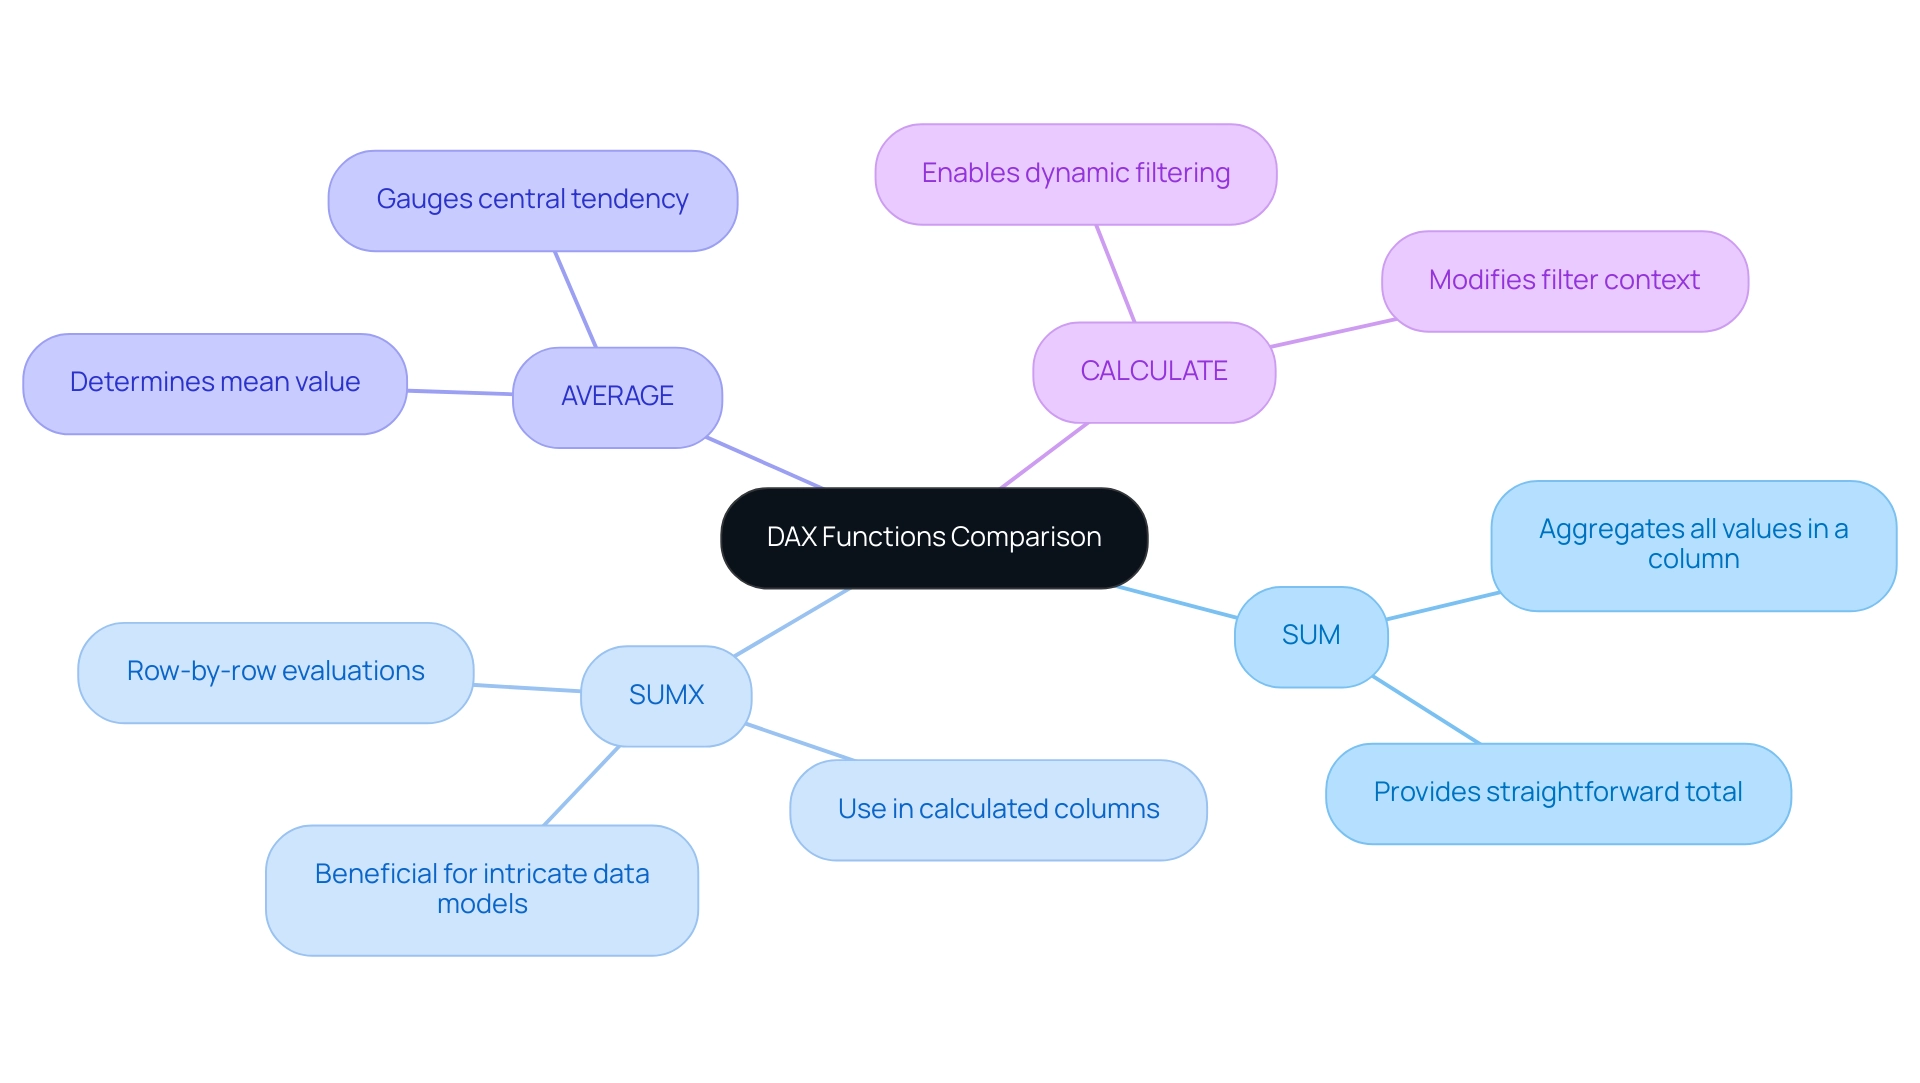
SUM vs. SUMX: The SUM operation aggregates all values in a specified column, providing a straightforward total. In contrast, SUMX performs row-by-row evaluations of an expression before summing the results. This makes SUMX especially beneficial for situations needing row-level calculations, like when handling calculated columns or intricate data models.
-
SUM vs. AVERAGE: While SUM provides the total of a column, the AVERAGE calculation determines the mean value. Utilizing AVERAGE is essential when you aim to gauge the central tendency of your dataset, offering insights into typical values rather than just totals.
-
SUM vs. CALCULATE: The CALCULATE operation is powerful for modifying the filter context of calculations. When utilizing DAX SUM with a filter, it allows for dynamic filtering, enabling users to apply specific conditions to their summation, which can significantly enhance the relevance of the results.
Understanding these distinctions is vital for selecting the most appropriate method for your analysis. By leveraging the appropriate DAX functions, you can enhance the accuracy and relevance of your insights, ultimately driving better decision-making in your organization.
Moreover, in today’s information-rich environment, challenges such as time-consuming report creation and inconsistencies can hinder effective analysis. Power BI enables users to tailor their workspace by organizing tools and panels to fit their workflow preferences, which can improve the efficiency of analysis. Best practices in modeling information, such as using the Power Query Editor for preparation and defining relationships between tables, are essential for structuring and organizing content effectively.
A case study on information modeling highlights that effective practices ensure accurate, efficient, and understandable structures, enabling better insights and decision-making.
As Paul Turley, a Microsoft Data Platform MVP, notes, ‘The term ‘architecture’ is more commonly used in the realm of engineering and warehouse project work, but the concept applies to BI and analytic reporting projects of all sizes.’ This highlights the significance of a well-organized method for analysis, particularly when employing DAX capabilities, to address the common challenges of report creation and to offer clear, actionable guidance for stakeholders.
Moreover, incorporating Robotic Process Automation (RPA) solutions, such as EMMA RPA, can further boost operational efficiency by automating repetitive tasks and enabling teams to concentrate on strategic analysis instead of time-consuming report generation. Failing to extract meaningful insights from your information can place your organization at a competitive disadvantage. To learn more about how RPA can complement your BI efforts, consider booking a consultation with Creatum GmbH.
Continuous Learning: Staying Ahead in DAX Function Mastery
To excel in mastering DAX functions and overcoming common challenges in leveraging insights from Power BI dashboards, professionals should adopt the following strategies:
-
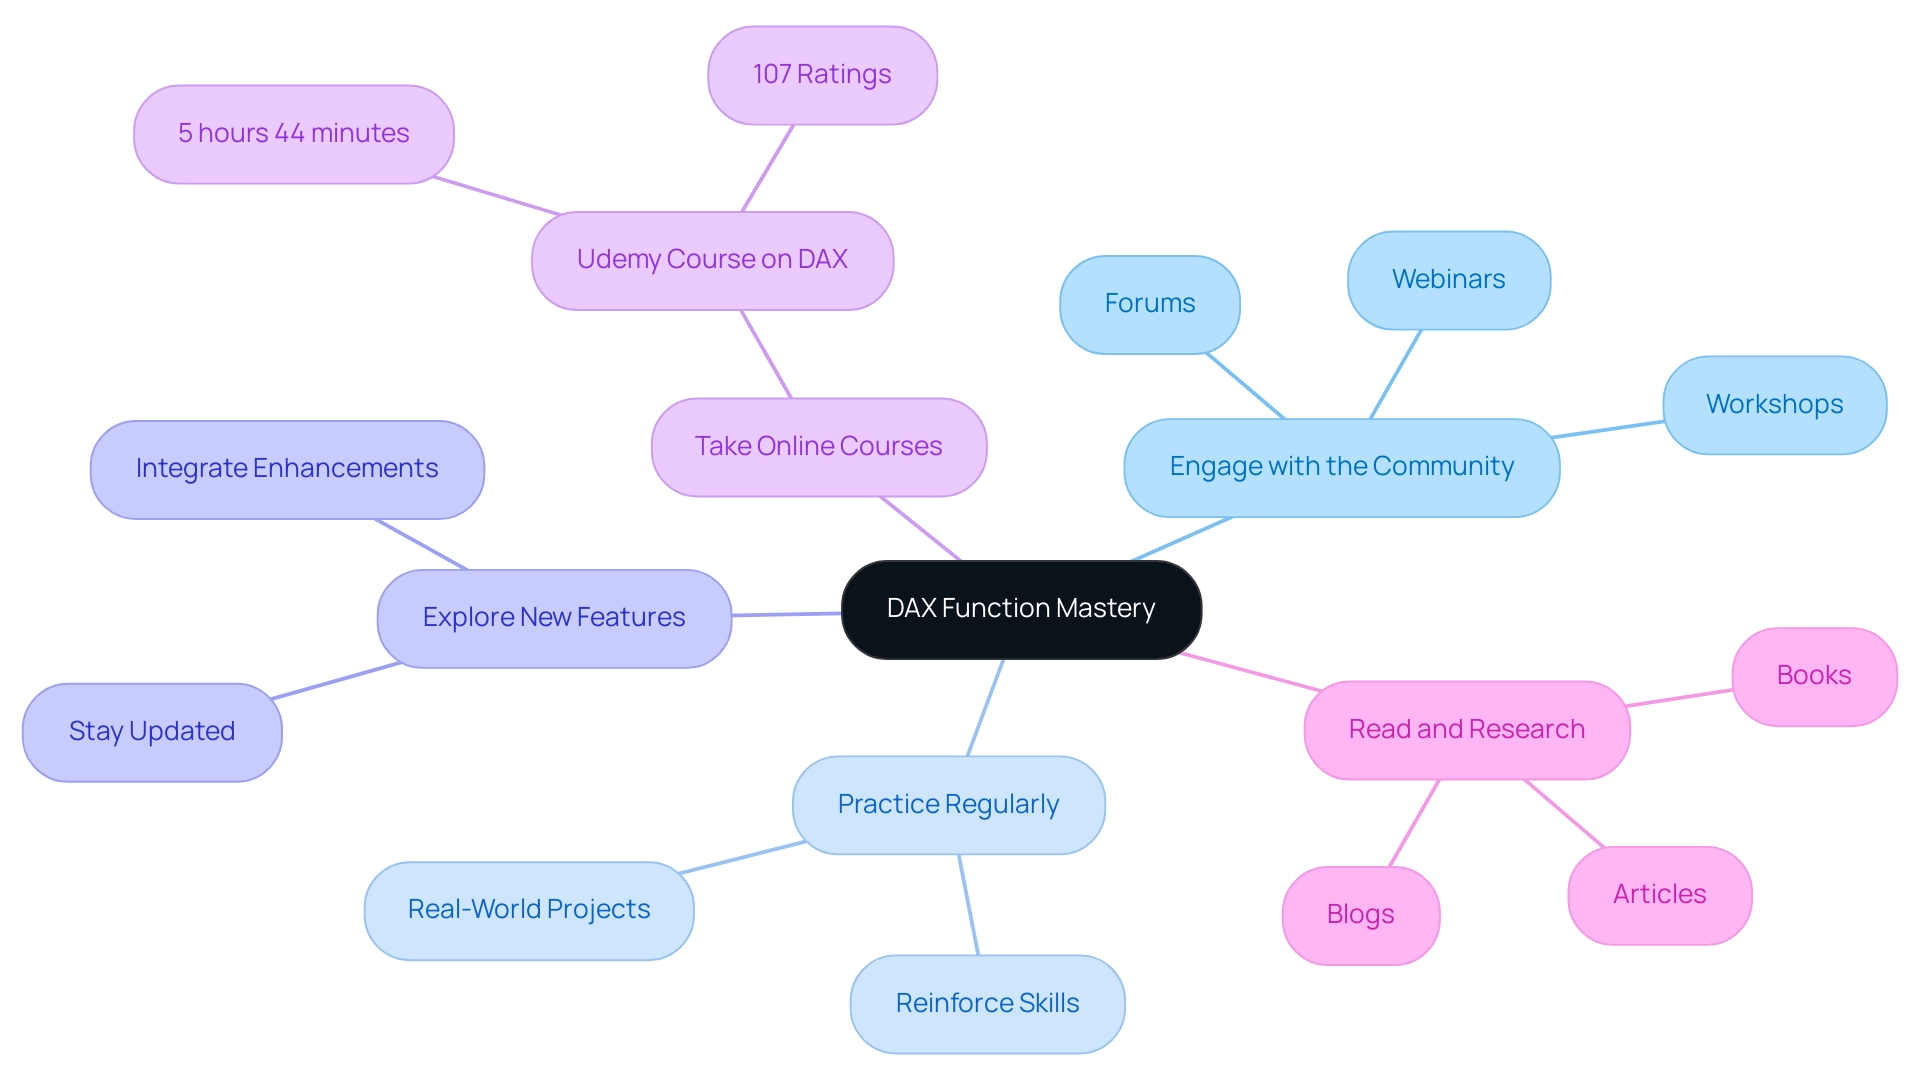
Engage with the Community: Actively participating in forums, webinars, and workshops fosters a collaborative learning environment. Interacting with colleagues boosts understanding and offers opportunities to exchange insights and effective methods, assisting in addressing issues such as inconsistencies while enhancing the clarity of actionable guidance.
-
Practice Regularly: Mastery of DAX is achieved through consistent practice. Tackling real-world projects allows individuals to apply theoretical knowledge, reinforcing their skills and understanding while addressing the time-consuming nature of report creation.
-
Explore New Features: Staying updated on the latest enhancements in Power BI and DAX is crucial. New functions can significantly enhance analytical capabilities, making it essential to integrate these advancements into daily workflows to streamline reporting processes and improve governance.
-
Take Online Courses: Investing in online courses, such as the comprehensive 5-hour 44-minute course on optimizing DAX code available on platforms like Udemy, can deepen understanding and skills. With over 107 ratings, such courses are designed to enhance performance and maintainability in DAX, making them a valuable resource for professionals seeking to improve their DAX skills and address the lack of actionable insights in their reports.
-
Read and Research: Continuous learning is vital. Consistently reading articles, blogs, and books on DAX and analysis helps professionals stay updated on the latest trends and techniques, broadening their knowledge base and allowing them to produce more effective reports.
Furthermore, implementing a robust governance strategy is essential to tackle inconsistencies, ensuring that all reports are accurate and reliable. Statistics indicate that organizations with active community engagement in DAX learning see a marked improvement in their analytical capabilities. For instance, dashboards and reports viewed in the past 90 days reflect the growing interest and utilization of DAX across various sectors.
As Bruno, a data consultant, aptly puts it, “Well there you have it, 5 years later and even more reasons to deep dive into DAX.” Case studies demonstrate that DAX not only enhances reporting and analytics but also empowers professionals, including business analysts and finance experts, to unlock the full potential of Power BI. The case study titled “DAX in Power BI” illustrates how DAX enhances reporting and analytics capabilities, reinforcing the practical benefits of mastering DAX for various professionals.
By embracing these strategies, individuals can ensure they remain at the forefront of DAX mastery, supported by the expertise of Creatum GmbH.
Conclusion
Mastering the DAX SUM function is essential for any data analyst aiming to derive meaningful insights from their datasets. This article has explored the foundational role of the SUM function in Power BI, emphasizing its straightforward syntax and significance in effective data aggregation. The inclusion of filters, particularly through the CALCULATE function, enhances calculation accuracy and allows for nuanced data analysis. By employing practical applications, such as sales performance analysis and year-over-year comparisons, analysts can leverage DAX SUM to drive informed decision-making and foster business growth.
However, challenges such as incorrect filter context, performance issues, and the distinctions between row and filter context can hinder effective implementation. By adhering to best practices—such as leveraging CALCULATE appropriately and maintaining thorough documentation—data professionals can overcome these obstacles and enhance their analytical capabilities. Continuous learning through community engagement and online courses further empowers analysts to stay ahead in the ever-evolving landscape of data analysis.
In conclusion, the DAX SUM function, when utilized effectively alongside filters, serves as a powerful tool for transforming raw data into actionable insights. As businesses increasingly rely on data-driven strategies, mastering DAX functions becomes not just beneficial but essential for achieving operational efficiency and fostering strategic growth. Embracing these techniques will undoubtedly place organizations on a path toward success in today’s competitive environment.
Frequently Asked Questions
What is the DAX SUM formula used for?
The DAX SUM formula is used for aggregating numerical data within a specified column, allowing users to perform basic aggregations in Power BI.
What is the syntax for the DAX SUM formula?
The syntax for the DAX SUM formula is SUM(<Column Name>). For example, to calculate total sales from a column named ‘Sales’, the formula would be SUM(Sales).
How prevalent is the DAX SUM function among analysts as of 2025?
Approximately 75% of professionals rely on the DAX SUM function for aggregation tasks, highlighting its significance in Business Intelligence.
How can DAX SUM be enhanced with filters?
DAX SUM can be enhanced with filters using the CALCULATE function, which allows for precise calculations tailored to specific criteria. For example, TotalSalesWest = CALCULATE(SUM(SalesData[TotalSales]), SalesData[Region] = "West") calculates total sales for the ‘West’ region.
Why is mastering DAX SUM with filters important?
Mastering DAX SUM with filters is crucial for effective DAX analysis, as it helps refine the information processed and improves the reliability of insights obtained from analysis.
What techniques can improve the performance of DAX calculations?
Techniques such as simplifying DAX calculations and utilizing tools like ALL, REMOVEFILTERS, and KEEPFILTERS can lead to substantial performance improvements in Power BI reports.
What role does the CALCULATE function play in DAX?
The CALCULATE function is a cornerstone of effective DAX usage, particularly for nuanced information analysis, as it allows users to manipulate filter context and enhance calculation accuracy.
How can filters be applied in Power BI visuals?
Filters can be applied through slicers in Power BI visuals or directly within DAX formulas, allowing for focused analysis and ensuring the information examined is relevant and actionable.
What support does Creatum GmbH offer for DAX functions?
Creatum GmbH offers RPA solutions that can enhance DAX functions by automating repetitive tasks, improving efficiency, and supporting better information management and insight generation.
Overview
The article titled “Connecting Power BI Databricks: A Comprehensive Step-by-Step Guide” serves as an essential resource for integrating Power BI with Databricks, aiming to elevate business intelligence capabilities. It begins by outlining the necessary prerequisites, capturing the reader’s attention with the promise of enhanced data processing and visualization.
Following this, the guide presents detailed setup instructions, fostering interest by breaking down complex processes into manageable steps. Best practices for creating visualizations and managing data refreshes are also highlighted, generating desire for effective integration that can significantly improve operational efficiency within organizations.
In conclusion, this comprehensive guide not only equips professionals with actionable insights but also encourages them to reflect on their current practices, prompting immediate action towards optimizing their data strategies.
Introduction
In the dynamic landscape of data analytics, organizations are increasingly turning to powerful tools like Power BI and Databricks to unlock the full potential of their data. Power BI, renowned for its robust visualization capabilities and interactive dashboards, empowers users to derive insights and make informed decisions. Meanwhile, Databricks serves as a cutting-edge analytics platform that harnesses the power of big data and machine learning, enabling organizations to process vast datasets seamlessly. Together, these tools create a formidable synergy, enhancing data accessibility and performance while driving strategic growth in an ever-evolving digital marketplace. As businesses strive to remain competitive, understanding the integration of Power BI with Databricks is essential for transforming raw data into actionable insights that propel innovation and operational efficiency.
Understanding Power BI and Databricks: Key Features and Benefits
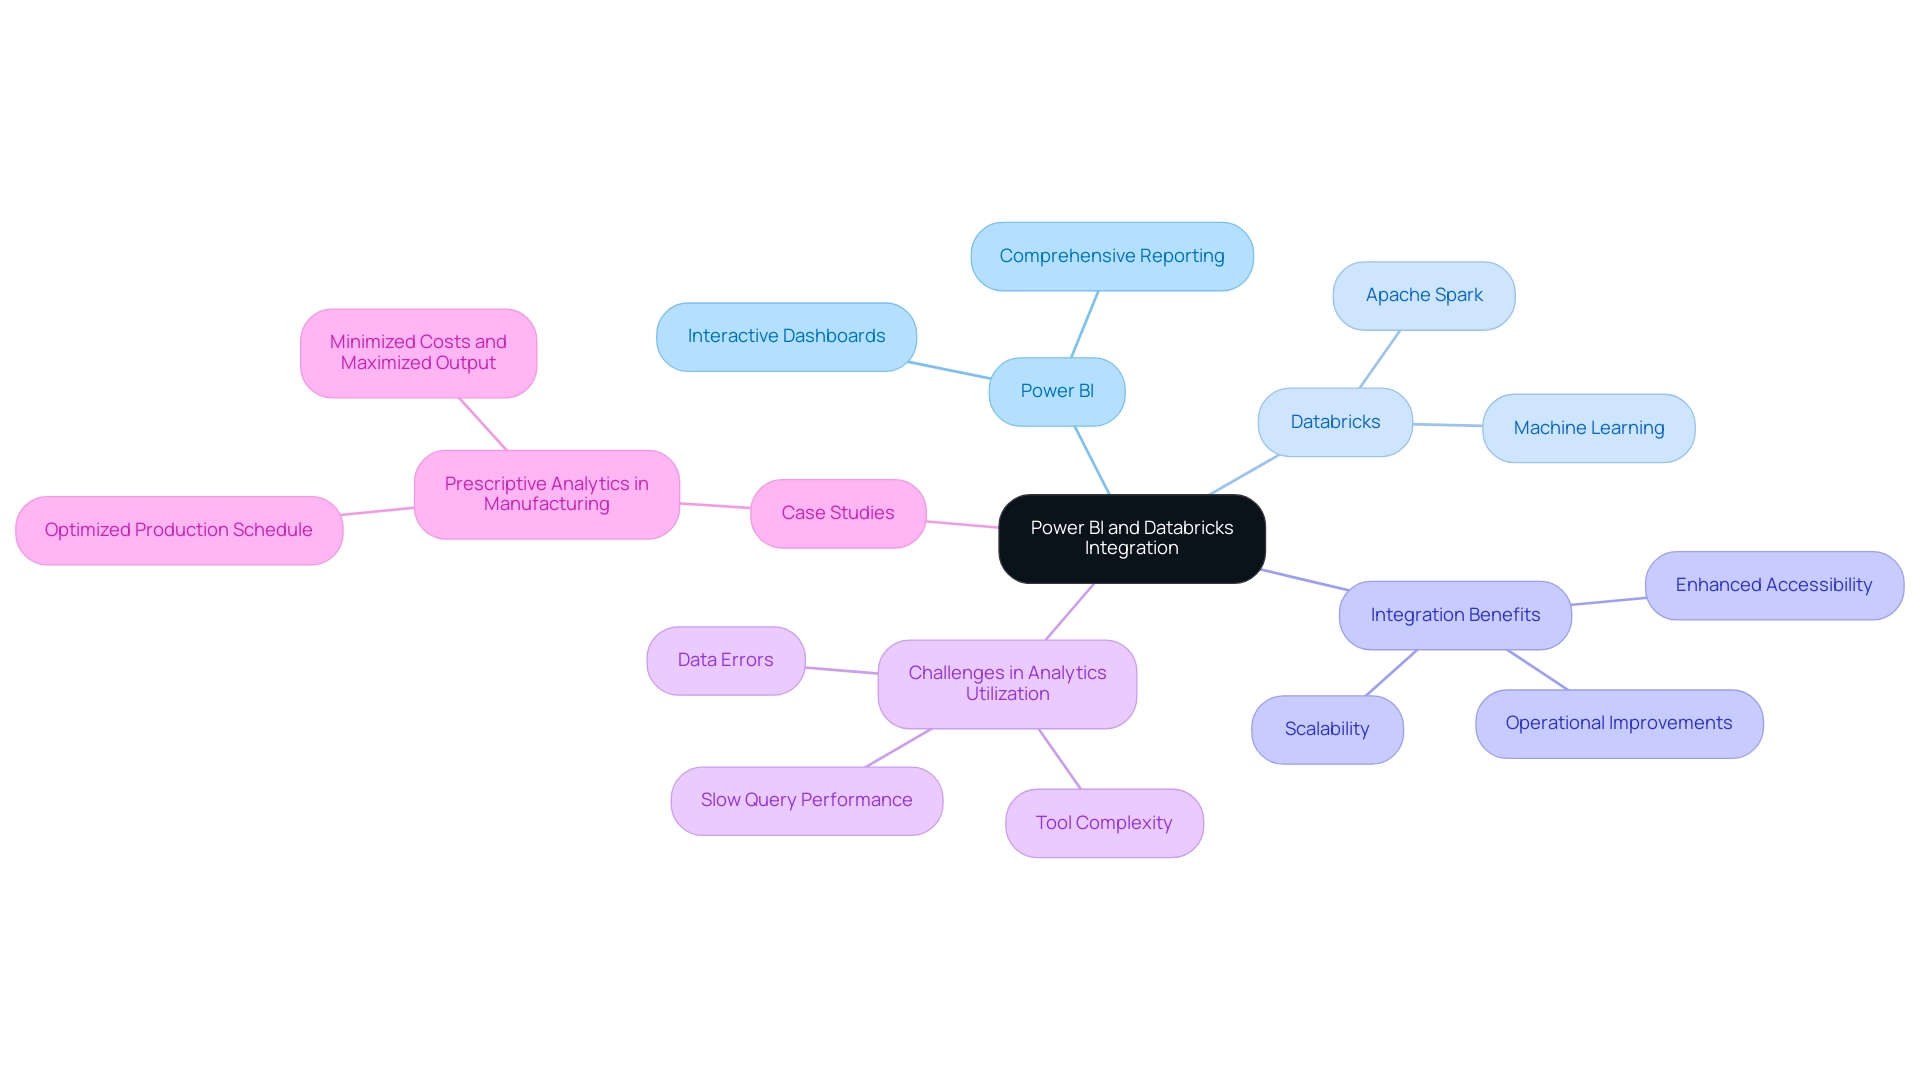
This tool distinguishes itself as a robust business analytics instrument, empowering users to visualize information and share insights across their organizations. With interactive dashboards and comprehensive reporting capabilities, BI facilitates informed decision-making. In contrast, this platform serves as an advanced analytics system tailored for large-scale information and machine learning, leveraging the capabilities of Apache Spark.
The integration of BI tools and analytics platforms allows organizations to effectively manage extensive datasets and create significant visual representations.
Incorporating BI with another platform significantly enhances accessibility, scalability, and performance. This synergy empowers users to extract deeper insights from their information, driving informed strategies and operational improvements. As the social business intelligence market is projected to reach approximately $25.9 billion by 2025, the adoption of tools like Power BI and Databricks is becoming increasingly essential for entities striving to remain competitive.
However, despite initiatives for self-service tools and modern information platforms, many companies encounter challenges in effectively utilizing analytics due to issues such as tool complexity, slow query performance, and errors. As Tajammul Pangarkar, CMO at Prudour Pvt Ltd, observes, “The effective use of analytics tools is essential for organizations to fully leverage their information assets.” This is where our BI services come into play, offering a 3-Day Sprint for rapid report creation and a General Management App for comprehensive management and smart reviews, ensuring efficient reporting and information consistency.
Recent updates to the Databricks analytics platform further enhance its capabilities, providing features that streamline data processing and analytics workflows. These enhancements, combined with the intuitive interface of Power BI and Databricks, create a powerful ecosystem for data-driven decision-making. Real-world applications illustrate that entities leveraging this integration can achieve significant operational efficiencies, as evidenced by case studies in sectors like manufacturing, where prescriptive analytics has optimized production schedules and minimized costs.
Ultimately, as companies navigate the complexities of analytics, the partnership between BI and another platform emerges as a strategic advantage, enabling organizations to harness the full potential of their assets and drive growth and innovation. Furthermore, utilizing AI through Small Language Models and GenAI Workshops can enhance information quality and training, while automation provides streamlined workflow management, ensuring a risk-free ROI evaluation and professional execution.
Prerequisites for Connecting Power BI with Databricks
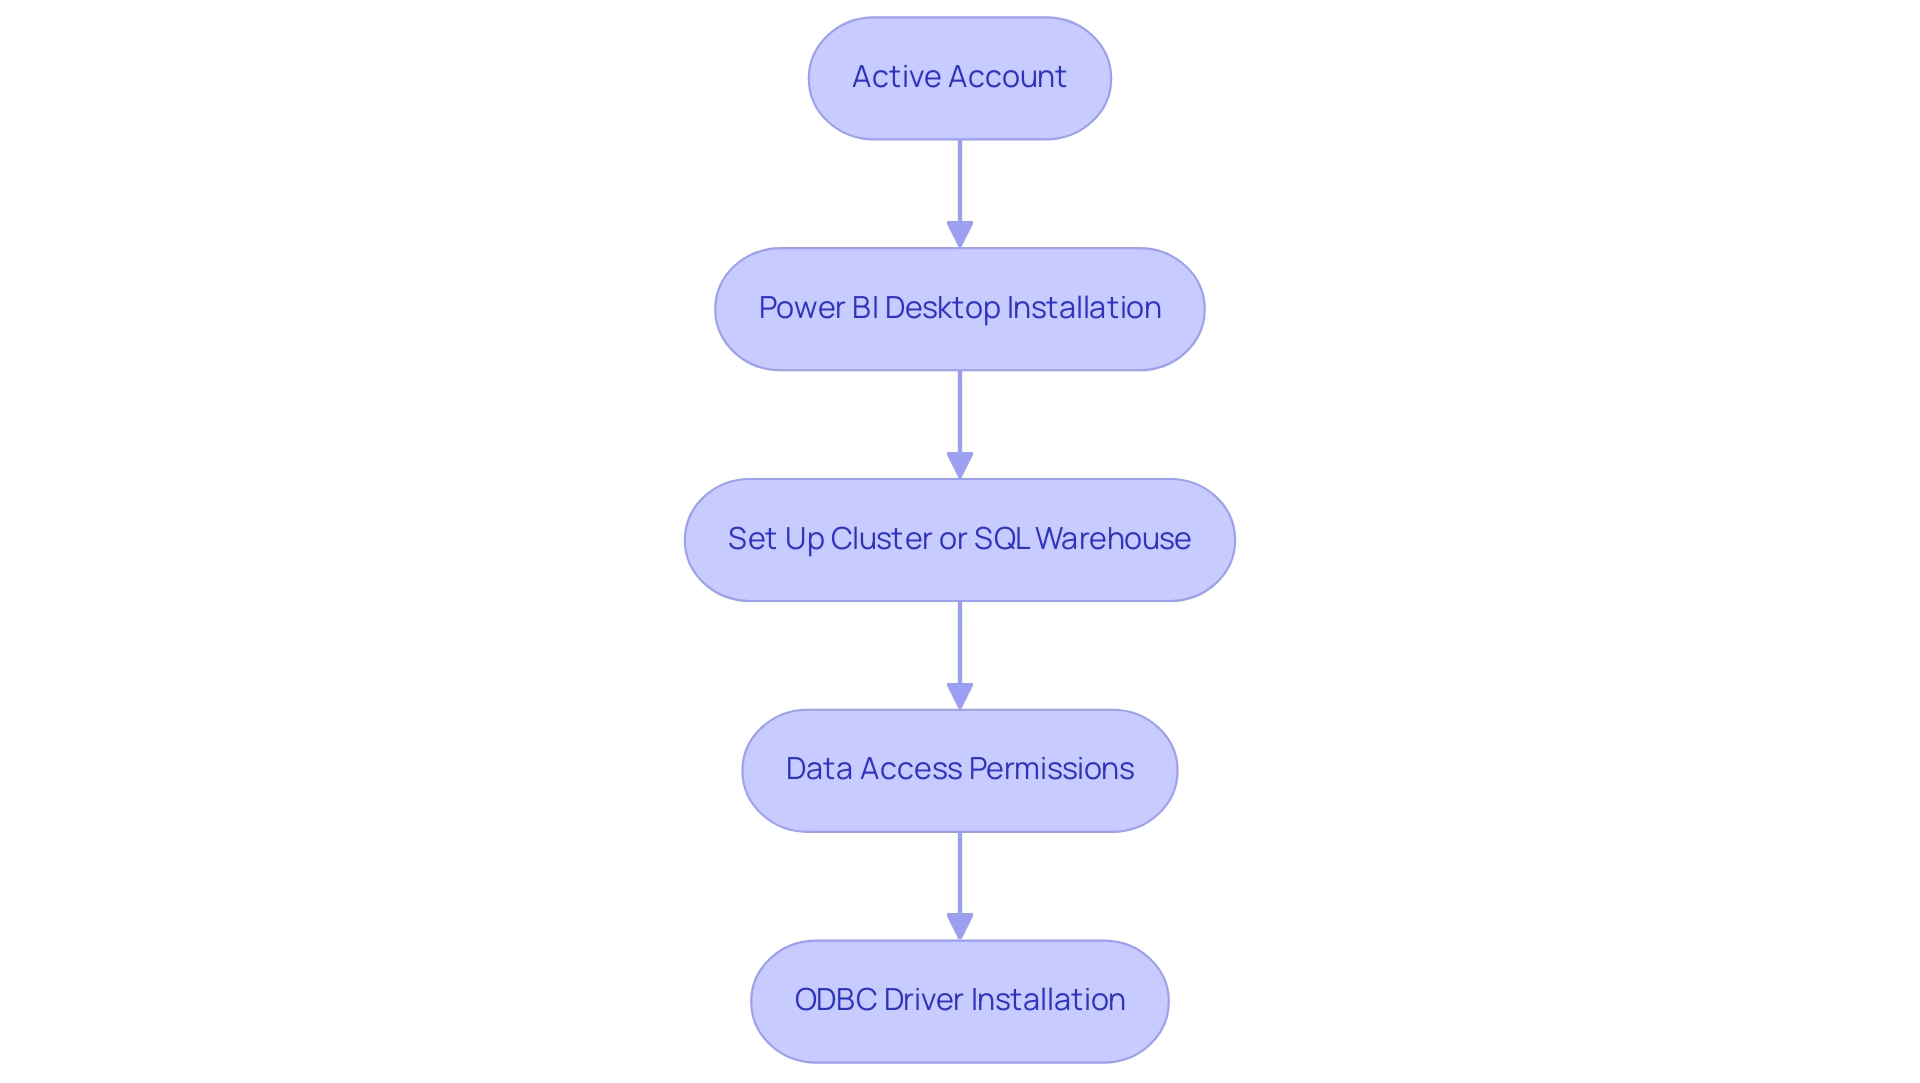
To successfully connect Power BI to Databricks, it is essential to meet the following prerequisites:
- Active account: Ensure you have a current account with access to a workspace, as this is essential for any information operations.
- Power BI Desktop: Install the latest version of Power BI Desktop on your machine to leverage its full capabilities for visualization and reporting.
- Set Up Cluster or SQL Warehouse: A properly set up cluster or SQL warehouse is essential to enable information processing and querying.
- Data Access Permissions: Confirm that you have the required authorizations to access the information stored in the platform, as this will facilitate smooth integration of the information.
- ODBC Driver: If you intend to use ODBC for the connection, ensure that the latest version of the ODBC driver is installed on your system.
In 2025, a significant percentage of organizations are utilizing Power BI Databricks, reflecting the growing trend towards integrated information solutions. Successful implementations have demonstrated that aligning the baseline table schema with the monitored table—excluding the timestamp column in time series or inference profiles—can enhance information accuracy and reporting efficiency.
As Pubudu Dewagama observed, “In today’s information-driven environment, businesses seek powerful solutions to harness the full potential of their resources.” By adhering to these prerequisites, organizations can streamline the connection process, thereby overcoming common challenges such as time-consuming report creation and inconsistencies. This enables them to convert raw information into actionable insights, driving informed decision-making and fostering innovation.
Additionally, integrating Robotic Process Automation (RPA) can further streamline the integration process, enhancing operational efficiency by automating repetitive tasks related to handling information. Customized AI solutions can also help in tackling particular challenges associated with information integration and reporting, ensuring that entities can effectively utilize their assets. The case study titled “Business Intelligence Empowerment” illustrates how the organization enables businesses to extract meaningful insights, further linking the connection process to the broader goal of informed decision-making and innovation.
Setting Up Databricks Community Edition: A Step-by-Step Guide
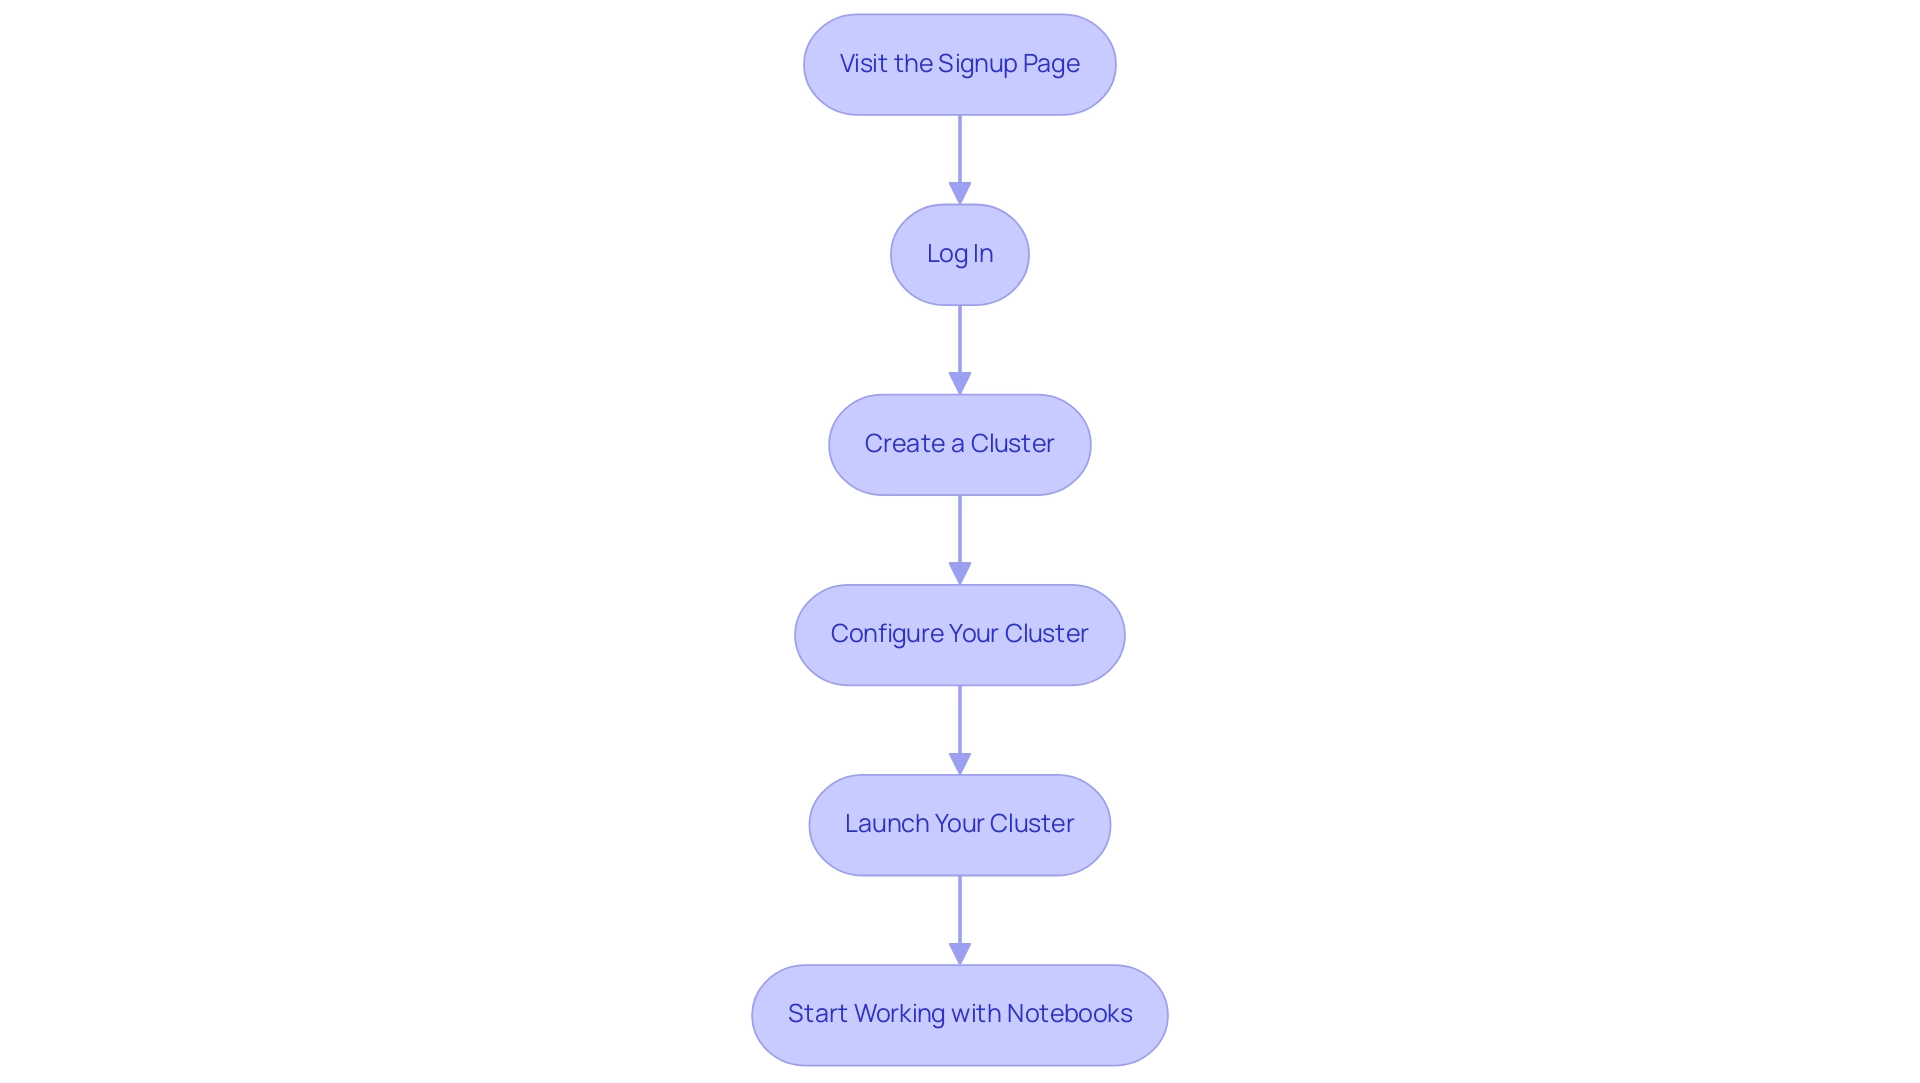
Setting up the Community Edition is a straightforward process that can significantly enhance your data analytics capabilities using Power BI Databricks. Follow these steps to get started:
- Visit the Signup Page: Go to the Community Edition signup page and create your account. This initial step is crucial for accessing the platform’s features.
- Log In: Once registered, log in to your Databricks workspace to begin your journey.
- Create a Cluster: Navigate to the ‘Compute’ section in the sidebar and click on ‘Create Compute’. This is where you will configure the environment for your processing tasks.
- Configure Your Cluster: Name your cluster and select the default settings, typically optimized for Community Edition. This ensures that you are leveraging the best configurations for your needs.
- Launch Your Cluster: Click ‘Create Compute’ to launch your cluster. This step initiates the resources necessary for executing your tasks.
- Start Working with Notebooks: After your cluster is operational, you can begin creating notebooks and importing information. Notebooks are essential for interactive coding and documentation, allowing you to visualize and analyze your information effectively.
As of 2025, the growth rate of Community Edition users has been impressive, reflecting its increasing popularity among analytics professionals. Notably, Delta Cache ensures faster read speeds for processing remote storage data, enhancing the efficiency of your analytics tasks in Power BI Databricks.
Core concepts of the platform, such as clusters for executing code, jobs for automating tasks, and notebooks for interactive coding and documentation, can be effectively utilized with Power BI Databricks. Understanding these elements is crucial for maximizing your use of the platform.
Additionally, Spark metric charts available in the compute metrics UI provide insights into server load distribution, active tasks, and overall cluster performance, which are vital for monitoring your resources effectively.
Real-world examples, such as Airbnb’s implementation of advanced analytics infrastructure using StarRocks, showcase the transformative potential of this technology in driving data-driven decision-making. As Allan Ouko states, “Discover how to utilize this SQL platform for effective analytics, querying, and business intelligence with practical examples and best practices.”
By following this setup guide, you can harness the potential of Community Edition to enhance your analytics capabilities.
Connecting Databricks to Power BI: Step-by-Step Instructions
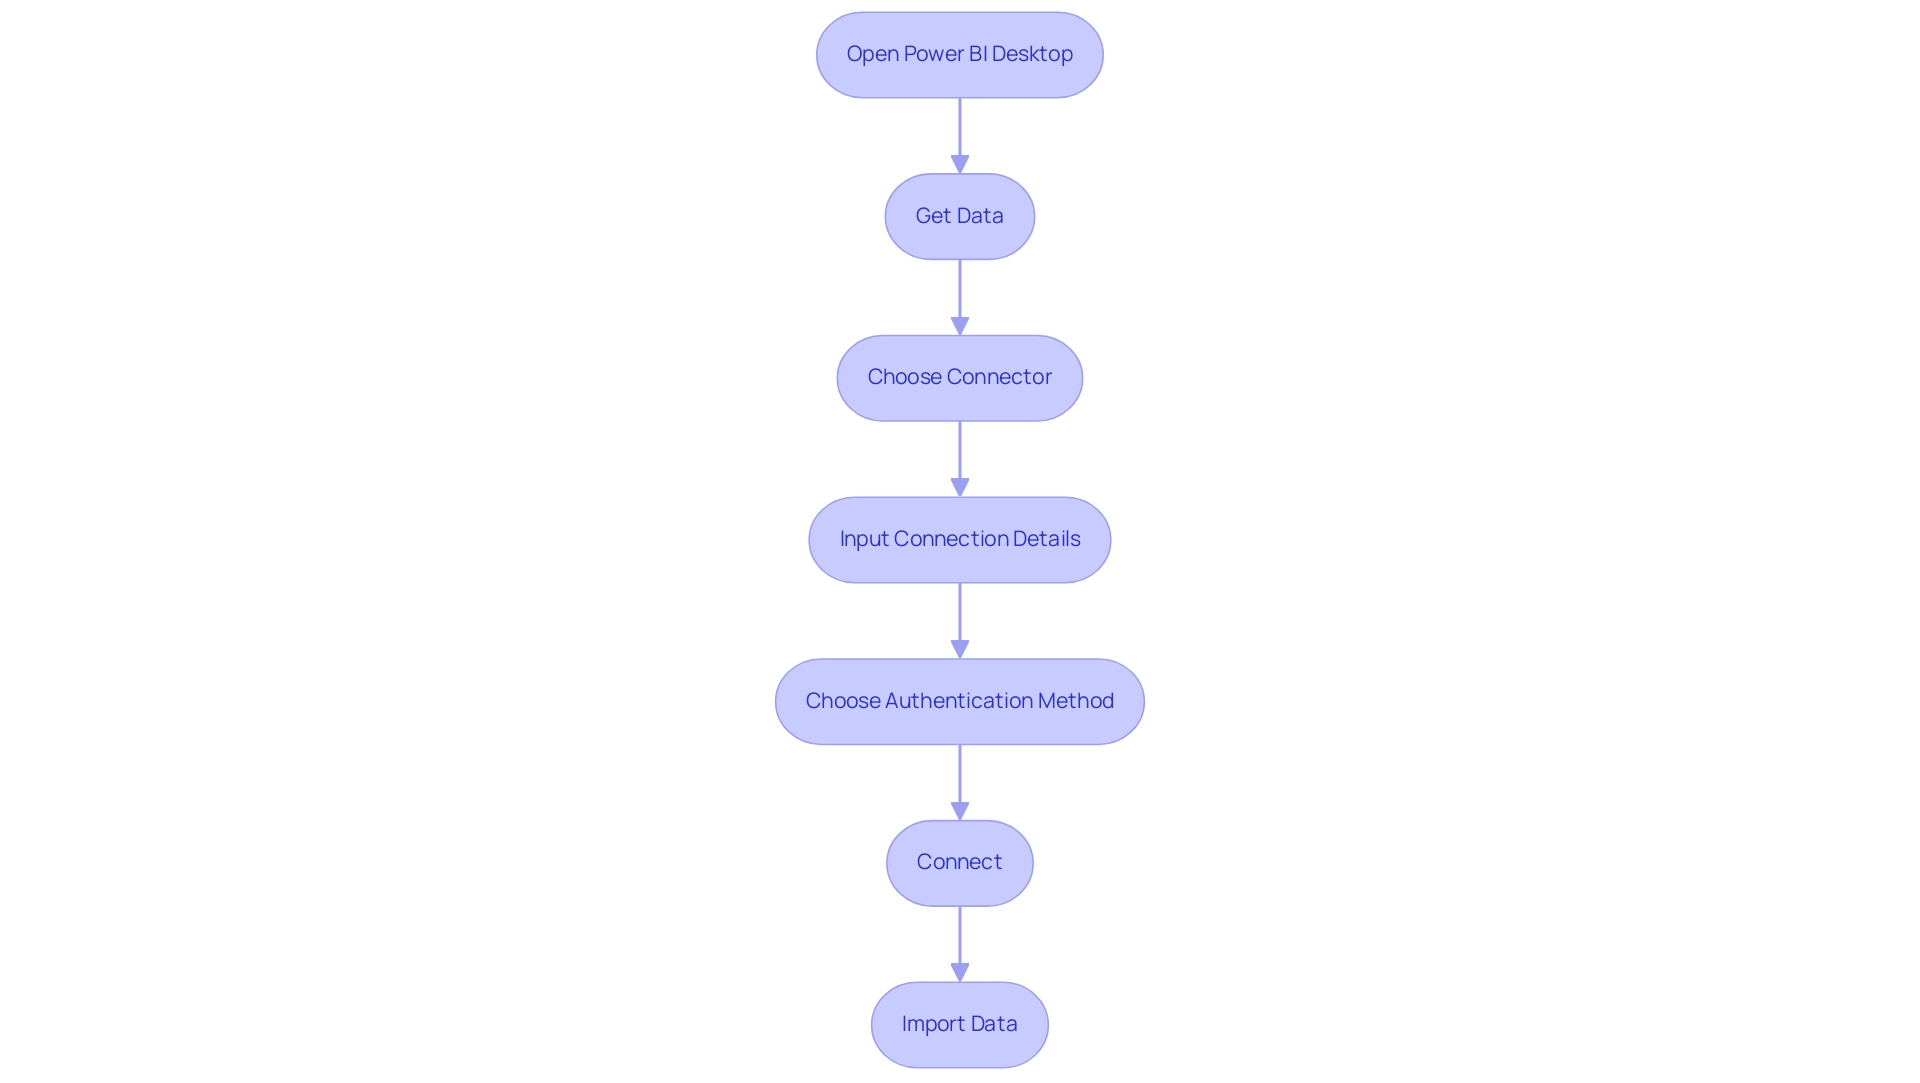
Linking the analytics platform to Business Intelligence is a straightforward process that can significantly enhance your data visualization capabilities and drive operational efficiency. Follow these detailed steps to establish a successful connection:
- Open Power BI Desktop: Launch the application and navigate to the main interface.
- Get Data: Click on the ‘Get Data’ option located in the Home ribbon.
- Choose Connector: In the ‘Get Data’ window, type ‘Databricks’ in the search bar and choose the connector from the list.
- Input Connection Details: Enter the Server Hostname and HTTP Path from your workspace. These details are crucial for establishing a secure connection.
- Choose Authentication Method: Select your preferred authentication method, such as Azure Active Directory or Personal Access Token, to ensure secure access to your data.
- Connect: Click ‘Connect’ to initiate the connection process.
- Import Data: Once connected, you will be presented with a list of tables and views available in your environment. Select the ones you wish to import into BI.
Recent updates in 2025 have improved the Power BI Databricks connector, significantly enhancing performance and user experience. For instance, performance metrics indicate that querying a dataset of 2.4 terabytes organized into 200 partitions averages just 2.12 seconds for visual generation, showcasing the efficiency of the lakehouse architecture. However, challenges persist, such as time-consuming report creation and inconsistencies, which can hinder actionable insights.
Real-world examples demonstrate the effectiveness of this integration. A notable case study involved creating a Delta table with sample student information in the platform, illustrating how users can efficiently store and query structured information. This capability not only simplifies information management but also improves analytical processes, tackling the common challenges encountered in utilizing insights from BI dashboards.
To ensure a seamless connection, consider best practices from data integration specialists, such as verifying your connection settings and regularly updating your BI and analytics environments to leverage the latest features and improvements. As Sravan Voona noted, “We strongly believe that the Engine might be encountering issues in parsing the large query (with numerous OR clauses) and generating the execution plan,” which is crucial for users troubleshooting connections. By following these steps and recommendations, you can effectively link the platform to Business Intelligence using Power BI Databricks, unlocking powerful insights and driving data-driven decision-making.
Moreover, utilizing tailored RPA solutions such as EMMA RPA and Automate from Creatum GmbH can improve data quality and streamline the integration process, aligning with our dedication to fostering growth and innovation. Additionally, addressing the lack of data-driven insights through this integration is essential for informed decision-making.
Creating Visualizations in Power BI Using Databricks Data
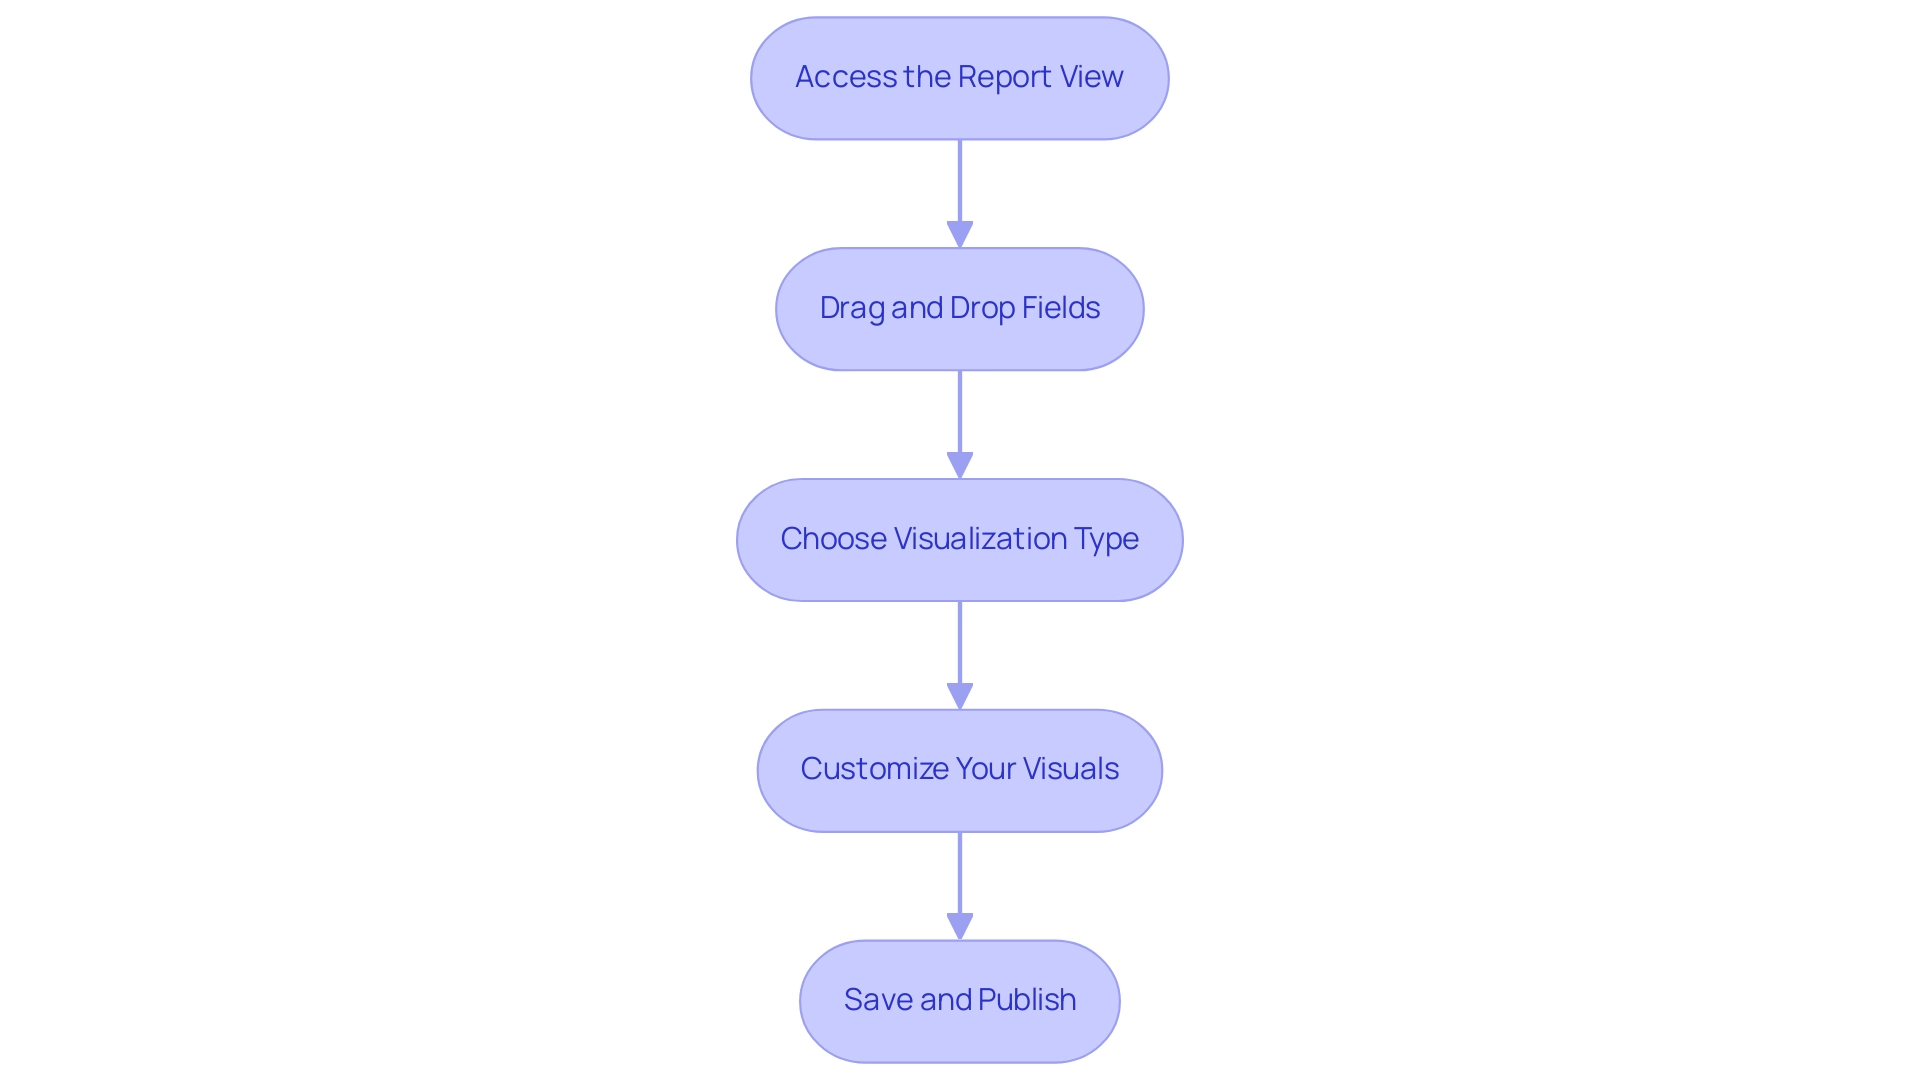
Once you have successfully established a connection between Databricks and Power BI, you can create impactful visualizations by following these streamlined steps:
- Access the Report View: Begin by navigating to the ‘Report’ view within Power BI, where you can design your visualizations effectively.
- Drag and Drop Fields: Select the relevant fields from the Power BI Databricks information model and drag them onto the report canvas. This intuitive action allows for swift visualization of your data, addressing the common challenge of time-consuming report creation.
- Choose Visualization Type: Utilize the visualization pane to select your desired chart or graph type, such as bar charts, line graphs, or advanced options like heatmaps and 3D maps. These can be enhanced using Mapbox and ArcGIS for customizable spatial analytics. Power BI offers two types of cards: Single numbers and Multi-row cards, providing versatile options for displaying key metrics.
- Customize Your Visuals in Power BI Databricks: Tailor your visualizations by adjusting formatting options in the visualization pane. This includes condition-based formatting, which significantly enhances the interpretability of your data. The Advanced Card visual in Power BI features condition-based formatting, support for prefixes and postfixes, and customizable content alignment, enriching your visualizations and ensuring consistency.
- Save and Publish: After finalizing your report, save your work and publish it to the Power BI service. This crucial step ensures that your insights are easily shareable with stakeholders, fostering improved communication and collaboration across teams.
In 2025, the emphasis on information visualization continues to rise, with statistics indicating that organizations utilizing visual tools experience a substantial enhancement in decision-making efficiency. Real-world examples illustrate that effective visualizations not only improve understanding but also drive business performance by aligning teams and reducing silos. For instance, the case study titled ‘Enhanced Communication through Visualization’ demonstrates how visualizing information fosters communication and collaboration between teams, thereby enhancing overall organizational efficiency.
By incorporating this information into Business Intelligence through Power BI Databricks, you can unlock the full potential of your data, transforming it into actionable insights that propel your organization forward. As Satyam Chaturvedi, Digital Marketing Manager, states, “By collaborating with Arka Softwares, you can confidently access the full functionalities of BI, unlocking the inherent value within your data and maximizing its potential.
Refreshing Data in Power BI: Best Practices for Databricks Integration
To ensure that Power BI Databricks delivers timely and pertinent insights, implementing effective refresh strategies from Databricks is essential.
-
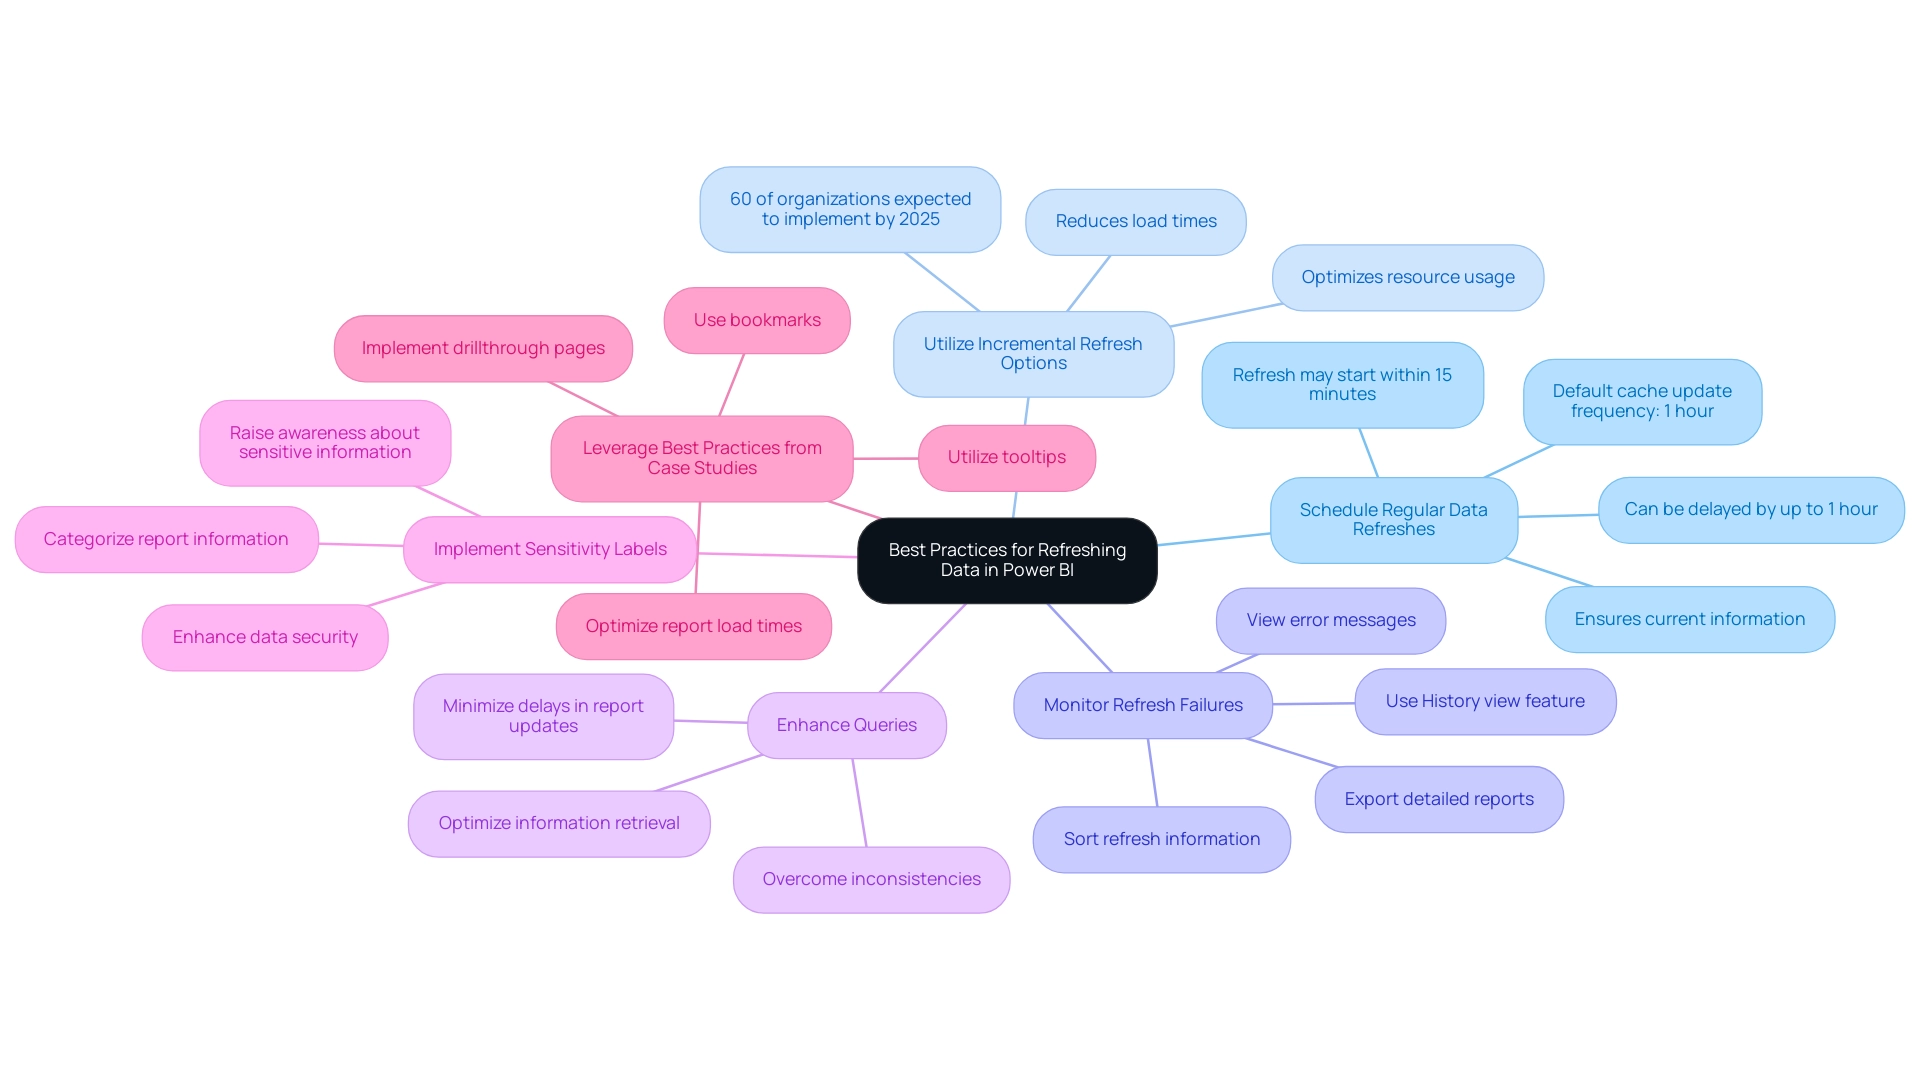
Schedule Regular Data Refreshes: Establish a routine for refreshing data in BI. This ensures that your reports consistently reflect the most current information, enhancing decision-making capabilities. Note that the Power BI cache update frequency is set to one hour by default; while the actual refresh might start within 15 minutes of the scheduled time, it can be delayed by up to one hour.
-
Utilize Incremental Refresh Options: For entities managing large datasets, leveraging incremental refresh can significantly enhance performance. This approach permits only the new or modified information to be loaded, reducing load times and optimizing resource usage. In 2025, around 60% of organizations are anticipated to implement incremental refresh strategies in BI, emphasizing its increasing significance in information management.
-
Monitor Refresh Failures: Regularly track the outcomes of scheduled refreshes using the History view feature in Power BI. This tool enables administrators to sort refresh information, view error messages, and export detailed reports, facilitating the prompt resolution of any issues that arise. Addressing these challenges is essential for leveraging insights effectively and avoiding time-consuming report creation.
-
Enhance Queries: Effective information retrieval is crucial during refresh operations. By optimizing queries in Power BI Databricks, organizations can ensure that information is fetched quickly and effectively, minimizing delays in report updates. This optimization is vital for overcoming inconsistencies that can hinder actionable guidance.
-
Implement Sensitivity Labels: Categorizing report information by business impact using sensitivity labels not only enhances security but also raises awareness among users about the importance of handling sensitive information appropriately.
-
Leverage Best Practices from Case Studies: For instance, strategies such as using bookmarks, drillthrough pages, and tooltips have been shown to optimize report load times, particularly on landing pages where quick access to information is critical. These practices can significantly enhance user experience and engagement with reports. The case study on optimizing report load times demonstrates how these strategies enhance page load speeds and improve user experience, making them vital for effective reporting.
By adhering to these best practices, organizations can maximize the efficiency of their refresh processes in BI tools, ensuring that insights obtained from cloud-based services are both timely and actionable. This integration of Business Intelligence and RPA, including tools like EMMA RPA and Automate from Creatum GmbH, drives operational efficiency and supports business growth by transforming raw data into meaningful insights.
Troubleshooting Common Issues in Power BI and Databricks Integration
Integrating Power BI with alternative platforms can present several challenges that may hinder operational efficiency. Here are some common issues and their solutions:
-
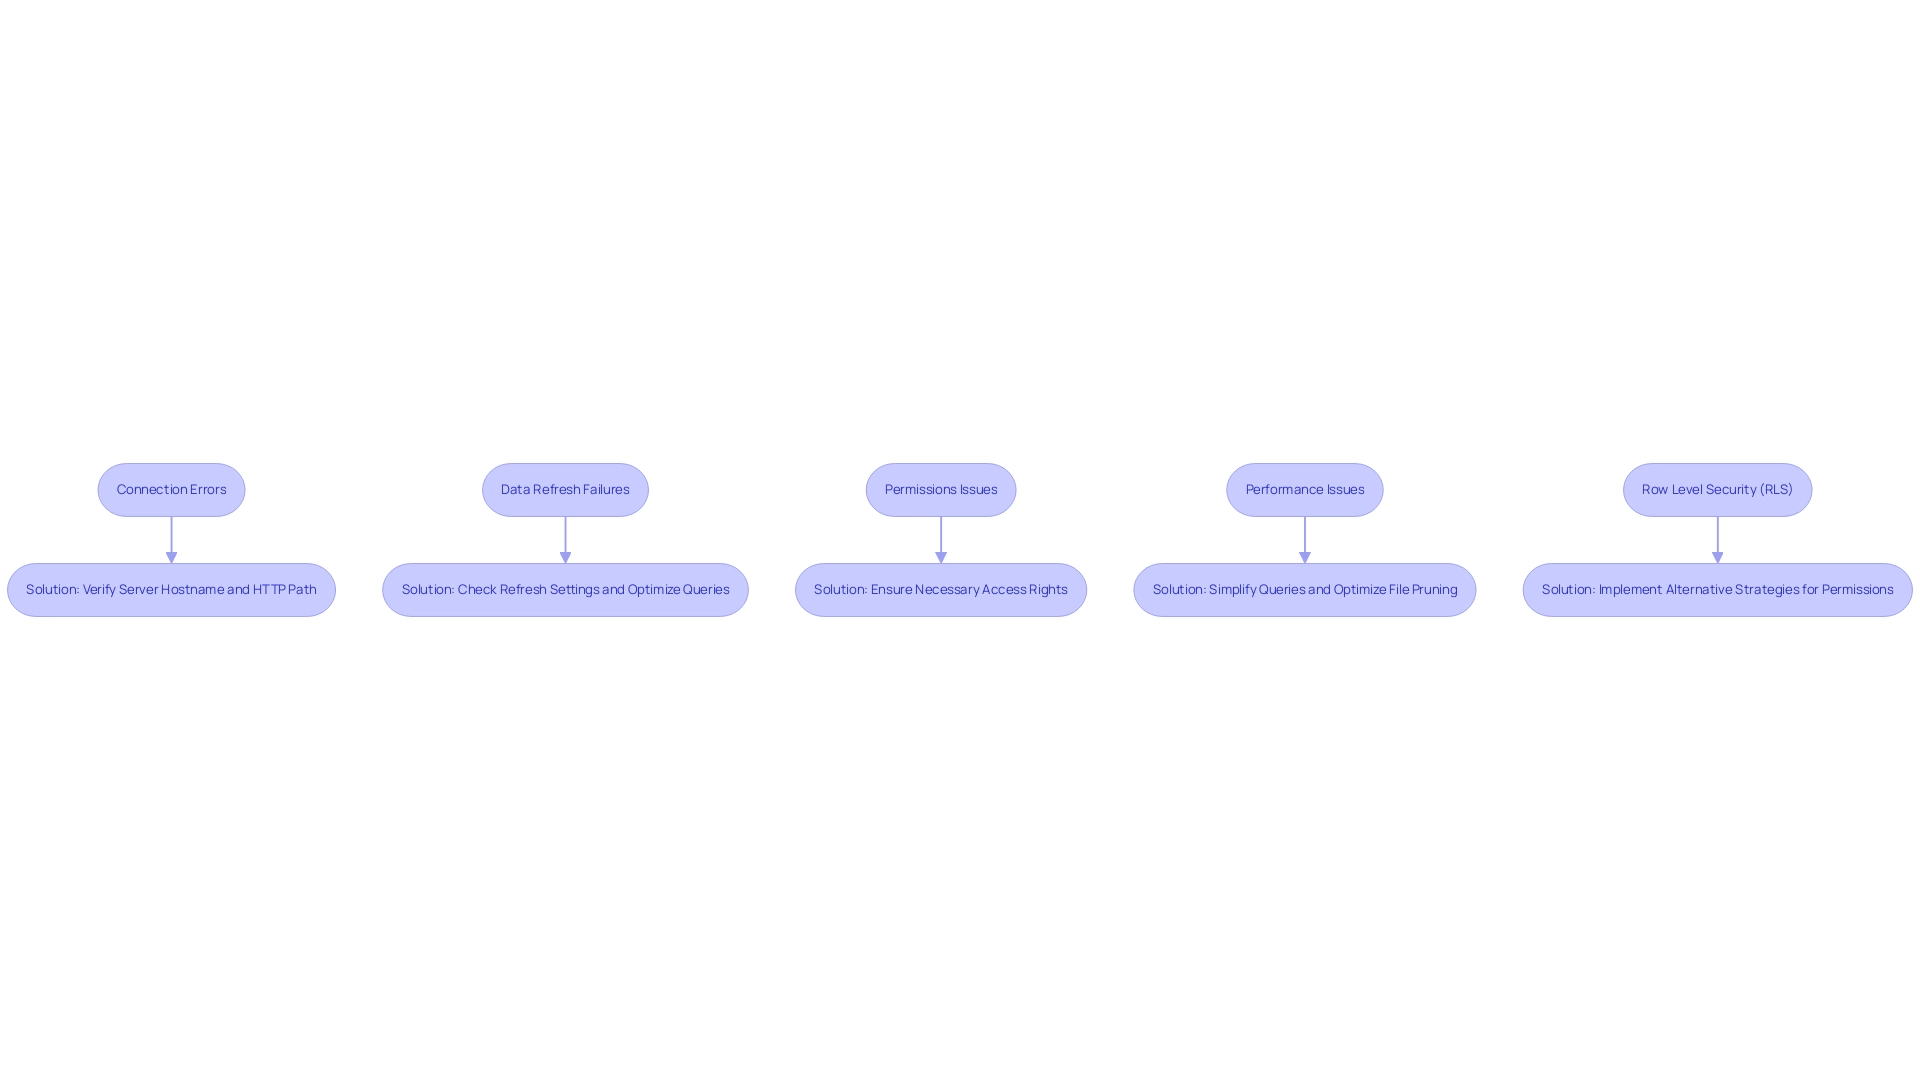
Connection Errors: A frequent issue arises when users encounter connection errors. To resolve this, ensure that your cluster is active and that you have entered the correct Server Hostname and HTTP Path. A significant percentage of users have reported experiencing connection errors, highlighting the importance of verifying these settings.
-
Data Refresh Failures: Data refresh failures can disrupt the flow of information. It’s crucial to check your refresh settings and optimize your queries. For large datasets, consider turning off background refresh in the PBIX file settings, as recommended by support teams. Monitoring CPU and memory usage can also help identify bottlenecks during refresh operations. Additionally, checking local file settings in the PBIX file can further enhance refresh performance.
-
Permissions Issues: Permissions can often be a roadblock. Ensure that you have the necessary access rights to the data stored in the platform. It’s crucial to recognize that Row Level Security (RLS) cannot be implemented using a token for BI connections to a cloud data platform. Without the correct permissions, even the most optimized queries will fail to execute.
-
Performance Issues: Performance can degrade significantly when Power BI generates overly complex queries, particularly those with numerous OR clauses. These queries can exceed 8,000 lines of code, leading to execution delays and cancellations before a plan is generated. As noted by Sravan Voona, the engine might encounter issues in parsing such large queries and generating the execution plan. To mitigate this, consider preprocessing data in the platform, using views, and optimizing file pruning to simplify queries. Users have faced execution times exceeding four minutes due to these complexities, underscoring the need for optimization. The case study titled “Power Bi Performance with Azure” highlights these challenges, illustrating the performance issues stemming from complex queries.
-
Row Level Security (RLS): It’s important to note that Row Level Security cannot be applied using a token for connections to the analytics platform. This limitation can complicate information governance and access control, necessitating alternative strategies for managing user permissions.
By tackling these frequent challenges with specific remedies, entities can improve their incorporation of Power BI Databricks alongside cloud platforms, ultimately converting unrefined information into practical insights for informed decision-making. This aligns with our mission at Creatum GmbH to address the challenges of manual, repetitive tasks that hinder operational efficiency, allowing teams to focus on more strategic, value-adding activities. Leveraging Robotic Process Automation (RPA) can further streamline these workflows, enhancing overall operational efficiency in a rapidly evolving AI landscape.
The Benefits of Integrating Power BI with Databricks for Enhanced Business Intelligence
Integrating Power BI with Databricks presents a multitude of advantages that significantly enhance business intelligence capabilities:
-
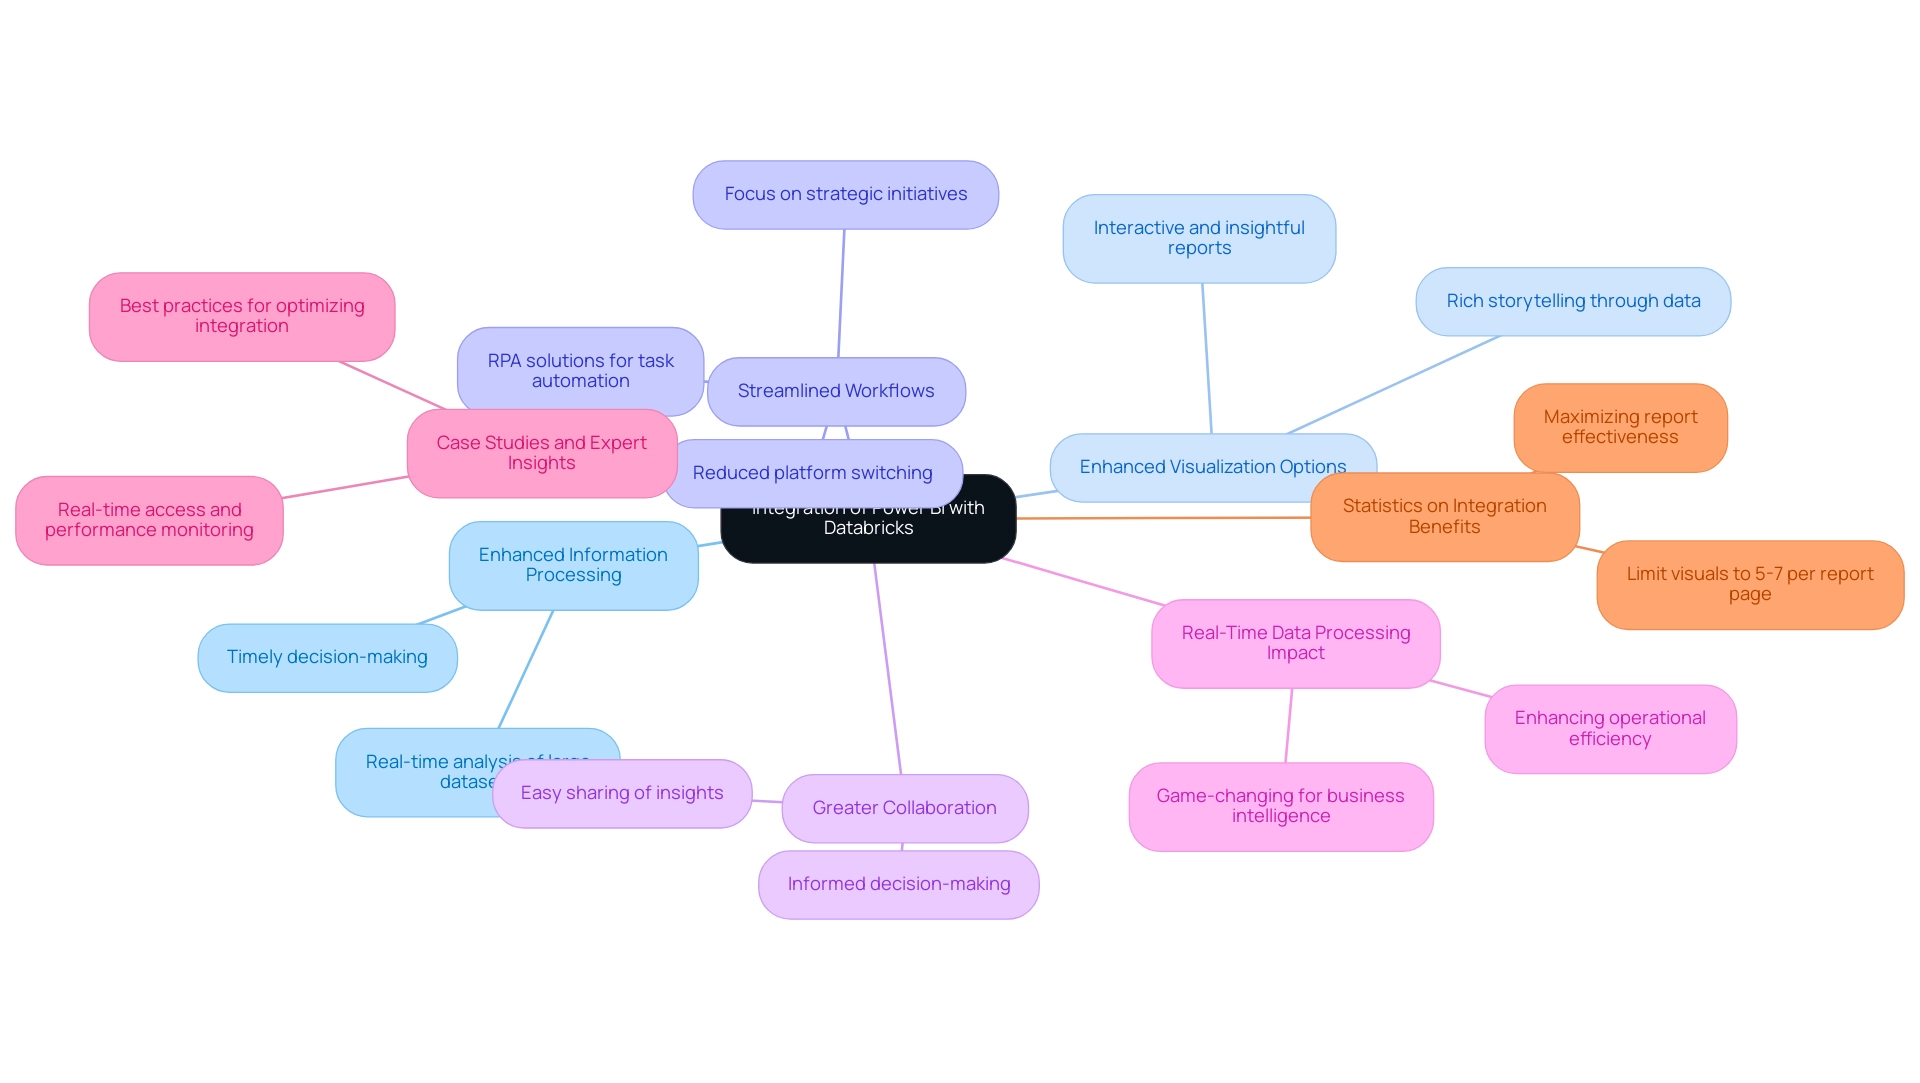
Enhanced Information Processing Capabilities: This integration enables the analysis of large datasets in real-time, allowing organizations to make timely decisions based on the most current information. In today’s fast-paced business environment, timely insights can lead to competitive advantages.
-
Enhanced Visualization Options: Users can generate interactive and insightful reports that not only showcase information but also narrate a story. The combination of a leading business intelligence tool’s strong visualization features with advanced analytical capabilities produces reports that are visually attractive and rich in insights, aiding improved comprehension and communication of data discoveries.
-
Streamlined Workflows: Leveraging Databricks’ powerful analytics features directly within Business Intelligence allows users to streamline their workflows. This integration reduces the need for switching between platforms, enhancing productivity and enabling teams to focus on strategic initiatives rather than repetitive tasks. Furthermore, Robotic Process Automation (RPA) solutions from Creatum GmbH can address task repetition fatigue, enhancing operational efficiency and boosting employee morale by automating manual workflows.
-
Greater Collaboration Across Teams: Power BI dashboards facilitate easy sharing of insights, fostering collaboration among teams. This collaborative environment ensures that all stakeholders have access to the same information and insights, promoting informed decision-making across the organization.
-
Real-Time Data Processing Impact: In 2025, the ability to process data in real-time will be a game-changer for business intelligence. Organizations harnessing this capability will not only improve operational efficiency but also enhance employee morale by reducing task repetition fatigue, enabling teams to focus on more value-adding activities. As Kyle Hale, Azure Solution Architect at the company, notes, ‘This is a really good article.’ It’s encouraging to see the positive impact of such integrations highlighted.
-
Power BI Databricks: Case studies and expert insights on best practices for optimizing the Power BI Databricks connector emphasize the significance of real-time access and performance monitoring. Implementing these practices can lead to enhanced analytical capabilities, driving growth and innovation. Experts in the field assert that integrating these tools is essential for entities aiming to stay ahead in a data-driven landscape.
-
Statistics on Integration Benefits: It is recommended to limit visuals to five to seven per report page to optimize performance, ensuring that reports remain clear and actionable. This statistic underscores the importance of careful information presentation in maximizing the effectiveness of business intelligence tools.
In summary, the integration of Power BI Databricks not only enhances analysis but also transforms how companies approach business intelligence, making it a vital strategy for success in 2025. Additionally, tailored AI solutions from Creatum GmbH can further support organizations in overcoming technology implementation challenges, ensuring they leverage the full potential of their data.
Conclusion
The integration of Power BI and Databricks signals a transformative shift in how organizations approach data analytics and business intelligence. By leveraging the robust visualization capabilities of Power BI alongside the powerful data processing features of Databricks, businesses can unlock deeper insights and drive strategic decision-making. This synergy enhances data accessibility and operational efficiency while fostering collaboration across teams, ensuring that all stakeholders are equipped with the same information to make informed choices.
Key benefits of this integration include:
- Improved data processing capabilities
- Enabling real-time analysis of large datasets
- A variety of visualization options that convert complex data into compelling narratives
As organizations strive to remain competitive in a rapidly evolving digital landscape, effectively leveraging these tools becomes crucial. Implementing best practices for data refresh, troubleshooting common issues, and optimizing queries can further enhance the overall experience and output of analytics initiatives.
Ultimately, the collaboration between Power BI and Databricks transcends mere technology; it empowers organizations to transform raw data into actionable insights that drive growth and innovation. As businesses navigate the complexities of data, embracing this integration will be essential for cultivating a data-driven culture that prioritizes informed decision-making and operational excellence.
Frequently Asked Questions
What is the primary function of the BI tool mentioned in the article?
The BI tool serves as a robust business analytics instrument that empowers users to visualize information and share insights across their organizations, facilitating informed decision-making through interactive dashboards and comprehensive reporting capabilities.
How does the platform differ from traditional BI tools?
The platform is an advanced analytics system tailored for large-scale information and machine learning, leveraging the capabilities of Apache Spark, which allows for more extensive data processing compared to traditional BI tools.
What benefits arise from integrating BI tools with analytics platforms?
Integrating BI tools with analytics platforms enhances accessibility, scalability, and performance, enabling organizations to manage extensive datasets and extract deeper insights, which drives informed strategies and operational improvements.
What challenges do companies face when utilizing analytics tools?
Companies often encounter challenges such as tool complexity, slow query performance, and errors, which hinder their ability to effectively utilize analytics.
What services does the article mention to help organizations with reporting and information consistency?
The article mentions BI services that include a 3-Day Sprint for rapid report creation and a General Management App for comprehensive management and smart reviews.
What recent updates have been made to the Databricks analytics platform?
Recent updates to the Databricks analytics platform enhance its capabilities by streamlining data processing and analytics workflows, contributing to a powerful ecosystem for data-driven decision-making.
What is the significance of the projected growth of the social business intelligence market?
The social business intelligence market is projected to reach approximately $25.9 billion by 2025, indicating the increasing importance of tools like Power BI and Databricks for organizations aiming to remain competitive.
What prerequisites are necessary to connect Power BI to Databricks?
The prerequisites include having an active account with access to a workspace, installing the latest version of Power BI Desktop, setting up a cluster or SQL warehouse, confirming data access permissions, and installing the latest ODBC driver if using ODBC for the connection.
How can organizations overcome common challenges in report creation and information integration?
By adhering to the prerequisites for connecting Power BI to Databricks, organizations can streamline the connection process, which helps overcome challenges like time-consuming report creation and inconsistencies.
What additional technologies can enhance the integration process?
Integrating Robotic Process Automation (RPA) can streamline the integration process by automating repetitive tasks, and customized AI solutions can address specific challenges associated with information integration and reporting.
Overview
Mastering custom sort order in Power BI is essential for presenting information in a meaningful sequence. By creating a dedicated sort table and effectively integrating it into your data model, you can significantly enhance data visualization clarity and operational efficiency. This practice not only improves the overall presentation of data but also addresses common challenges users encounter, such as data inconsistencies. Furthermore, it paves the way for advanced sorting techniques, including calculated columns. Are you ready to elevate your data presentation skills?
Introduction
In the dynamic realm of data visualization, Power BI emerges as a formidable tool, empowering users to customize their data presentations to fulfill specific analytical requirements. Custom sorting, a pivotal feature of Power BI, facilitates the organization of data beyond conventional alphabetical or numerical sequences, thereby ensuring that insights are communicated with clarity and impact.
As organizations increasingly depend on data-driven decision-making, mastering the nuances of custom sorting becomes imperative for developing reports that not only inform but also resonate with stakeholders. This article explores the critical role of custom sorting in Power BI, addressing common challenges users encounter, providing practical steps for establishing sort tables, and unveiling advanced techniques that can elevate data analysis to unprecedented levels.
By grasping these concepts, users can refine their data storytelling abilities, fostering enhanced decision-making and operational efficiency in a fiercely competitive landscape.
Understanding Custom Sorting in Power BI
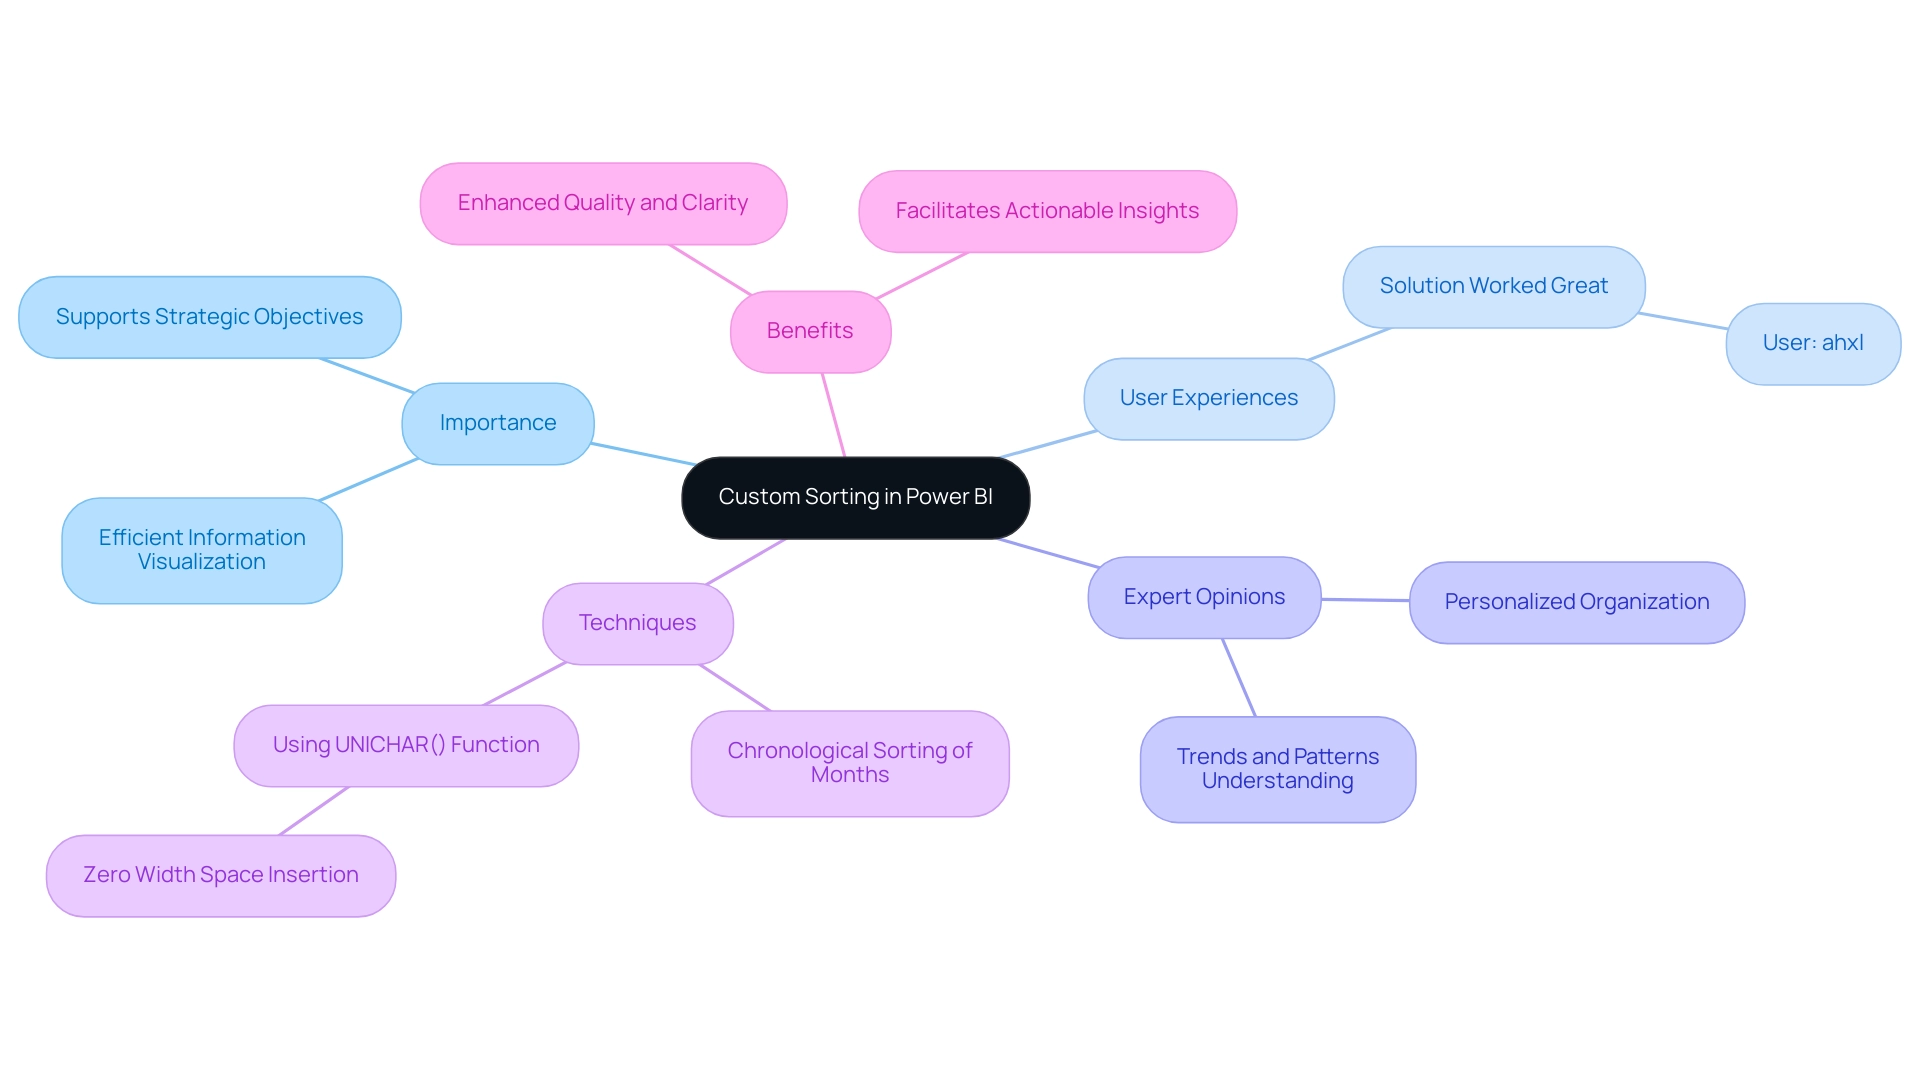
The Power BI custom sort order empowers users to dictate the arrangement of information in reports and dashboards, transcending the limitations of default alphabetical or numerical organization. This capability is crucial when the inherent order of information diverges from the desired presentation. For instance, employing Power BI custom sort order ensures that months are arranged chronologically rather than alphabetically. In 2025, the importance of custom arrangement has been underscored by numerous discussions, with one post attracting over 340,426 views as users sought solutions for organizational challenges, particularly with calculated columns.
This statistic highlights the growing recognition of customized organization’s role in efficient information visualization, aligning with the demand for personalized AI solutions that navigate the overwhelming choices present in the market.
Expert opinions affirm that effective personalized organization is essential for information visualization, enabling a more intuitive understanding of trends and patterns. A regular visitor, ahxl, remarked, “This solution worked great for a situation where I had months – August, September, and October not displaying in the correct order in my visual,” illustrating the practical challenges users encounter. A case study further demonstrated how the UNICHAR() function was utilized to establish a custom sort order in a table, successfully grouping ‘Bad’ and ‘Warning’ statuses while preserving a specific sequence.
By inserting a ‘Zero width space’ before text entries, the desired order was achieved without disrupting other visual elements.
The benefits of custom sorting extend to enhancing quality and clarity in visualizations, facilitating easier extraction of actionable insights for stakeholders. This is particularly vital in today’s information-rich environment, where organizations struggle to leverage insights from BI dashboards due to time-consuming report generation and information inconsistencies. Moreover, incorporating the Category field into the Legend can aid in visualizing how segments are categorized, thereby enhancing the clarity of presentations.
As organizations increasingly rely on information-driven decision-making, mastering custom sorting techniques in BI becomes essential for presenting narratives that resonate with audiences and support strategic objectives. This aligns with Creatum GmbH’s unique value in enhancing information quality and streamlining AI implementation, ultimately driving growth and innovation.
Common Challenges in Implementing Custom Sorts
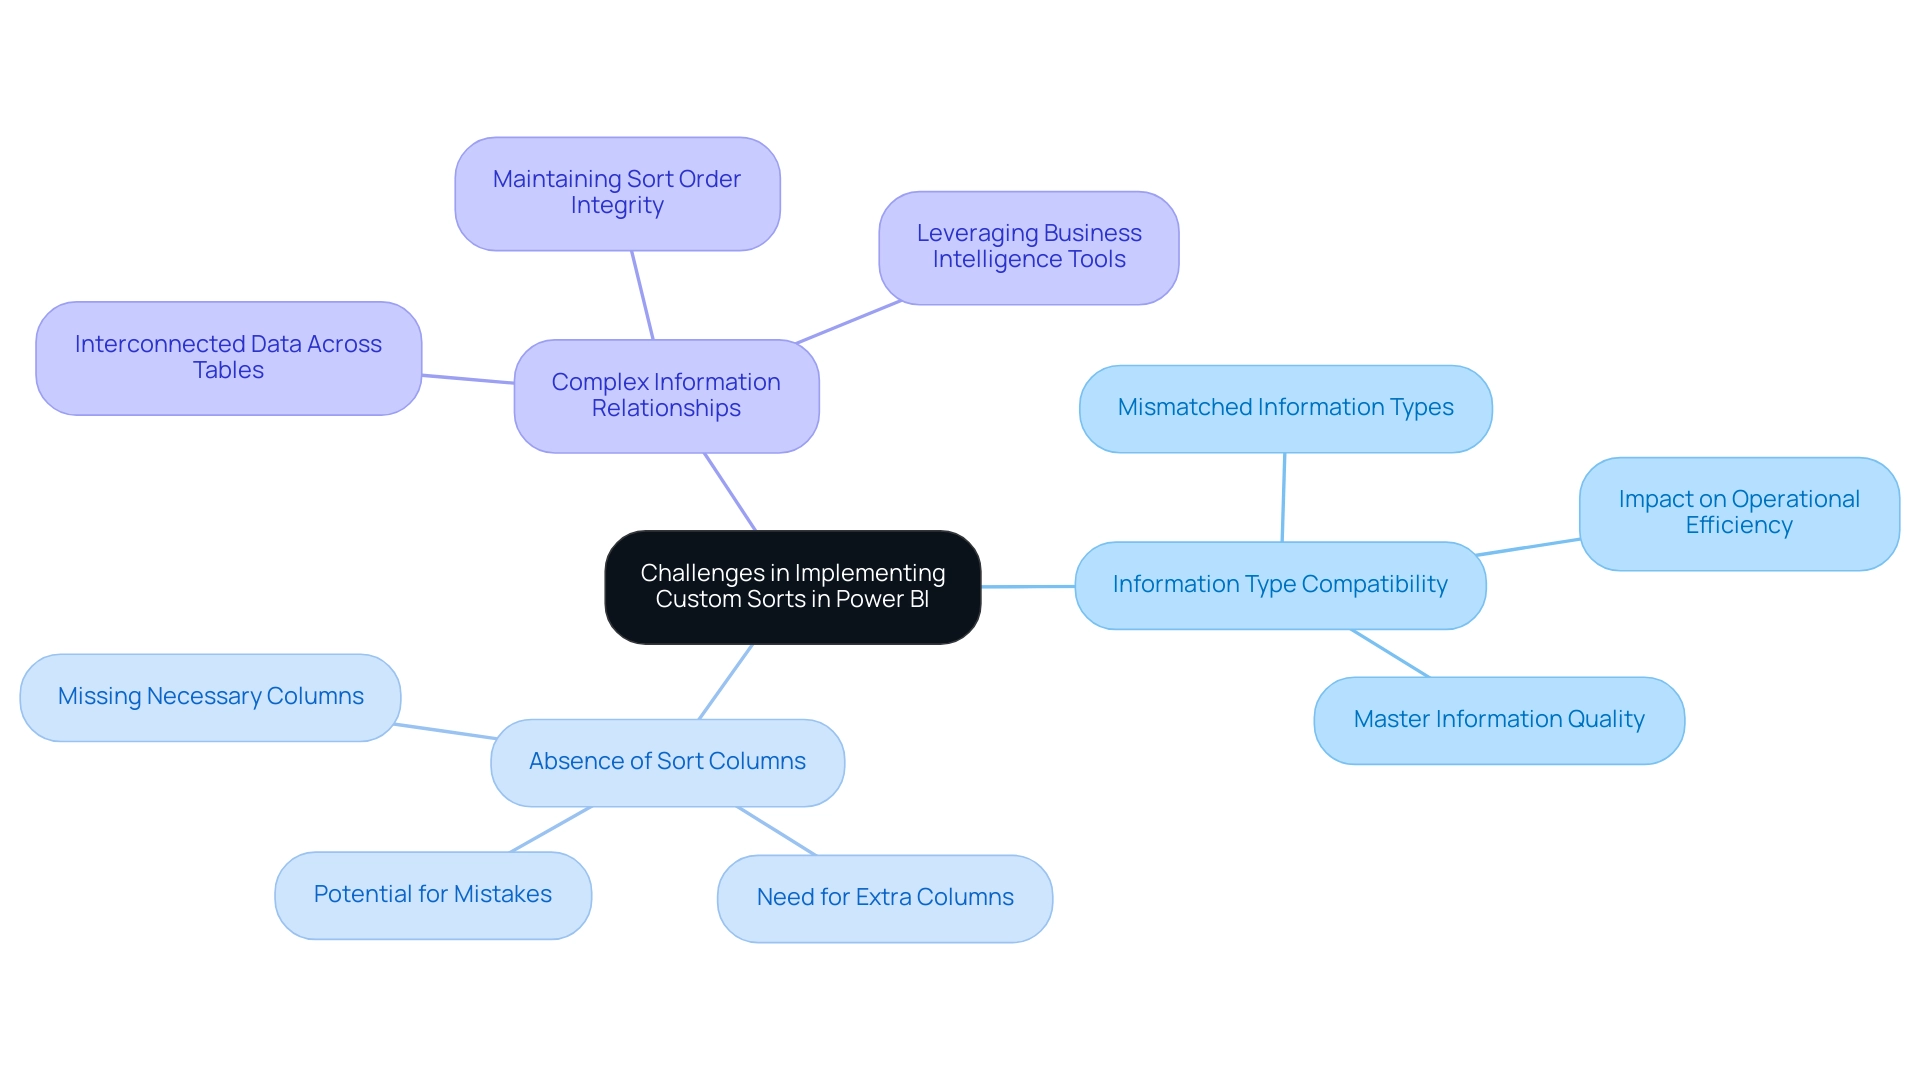
Implementing a custom sort order in Power BI presents several challenges that users must navigate to achieve effective analysis. Key issues include:
-
Information Type Compatibility: A significant hurdle is ensuring that the types of the columns being sorted are compatible. Organizing text fields necessitates careful attention to detail; mismatched information types can lead to unforeseen ordering outcomes. This issue is especially pressing in 2025, as organizations increasingly depend on various information sources that may not always align seamlessly. This reflects a broader challenge of poor master information quality, which can hinder operational efficiency and decision-making.
-
Absence of Sort Columns: Users often encounter situations where the necessary columns for sorting are missing from the dataset. This limitation may require the creation of extra columns to enable the desired arrangement, complicating the preparation process and raising the potential for mistakes. Such challenges can be exacerbated by apprehension surrounding AI adoption, as organizations may hesitate to integrate advanced technologies that could streamline these processes.
-
Complex Information Relationships: When information is interconnected across multiple tables, maintaining the integrity of sort orders becomes increasingly complex. Users must have a clear understanding of these relationships to ensure that sorting remains consistent and accurate across the entire dataset. This complexity underscores the importance of leveraging business intelligence tools effectively to transform raw data into actionable insights, enabling informed decision-making that drives growth and innovation.
Addressing these challenges is crucial for utilizing Power BI’s custom sort order to its full potential. Microsoft offers a 60-day trial phase of BI Pro, allowing users facing organizational challenges to explore its features. As Brian, an Enterprise DNA Expert, noted, “I hope you found it useful. I really enjoyed this challenge and learned an enormous amount from the experience, which I wanted to document in detail here for my own purposes as well.” This perspective highlights the significance of comprehending categorization challenges in BI.
Furthermore, a case study contrasting BI with Tableau emphasizes BI’s strengths in usability, which can indirectly aid discussions on organizational challenges by showcasing the tool’s overall benefits. The BI community also shares valuable experiences, tutorials, and tips for visual representation, encouraging users to seek additional resources and assistance for overcoming organizational challenges. By recognizing and tackling these common issues, users can enhance their data visualization efforts and drive more informed decision-making.
Setting Up a Sort Table for Custom Sorting
To effectively set up a sort table for custom sorting in Power BI, follow these detailed steps while keeping in mind the common challenges faced in leveraging insights from Power BI dashboards:
-
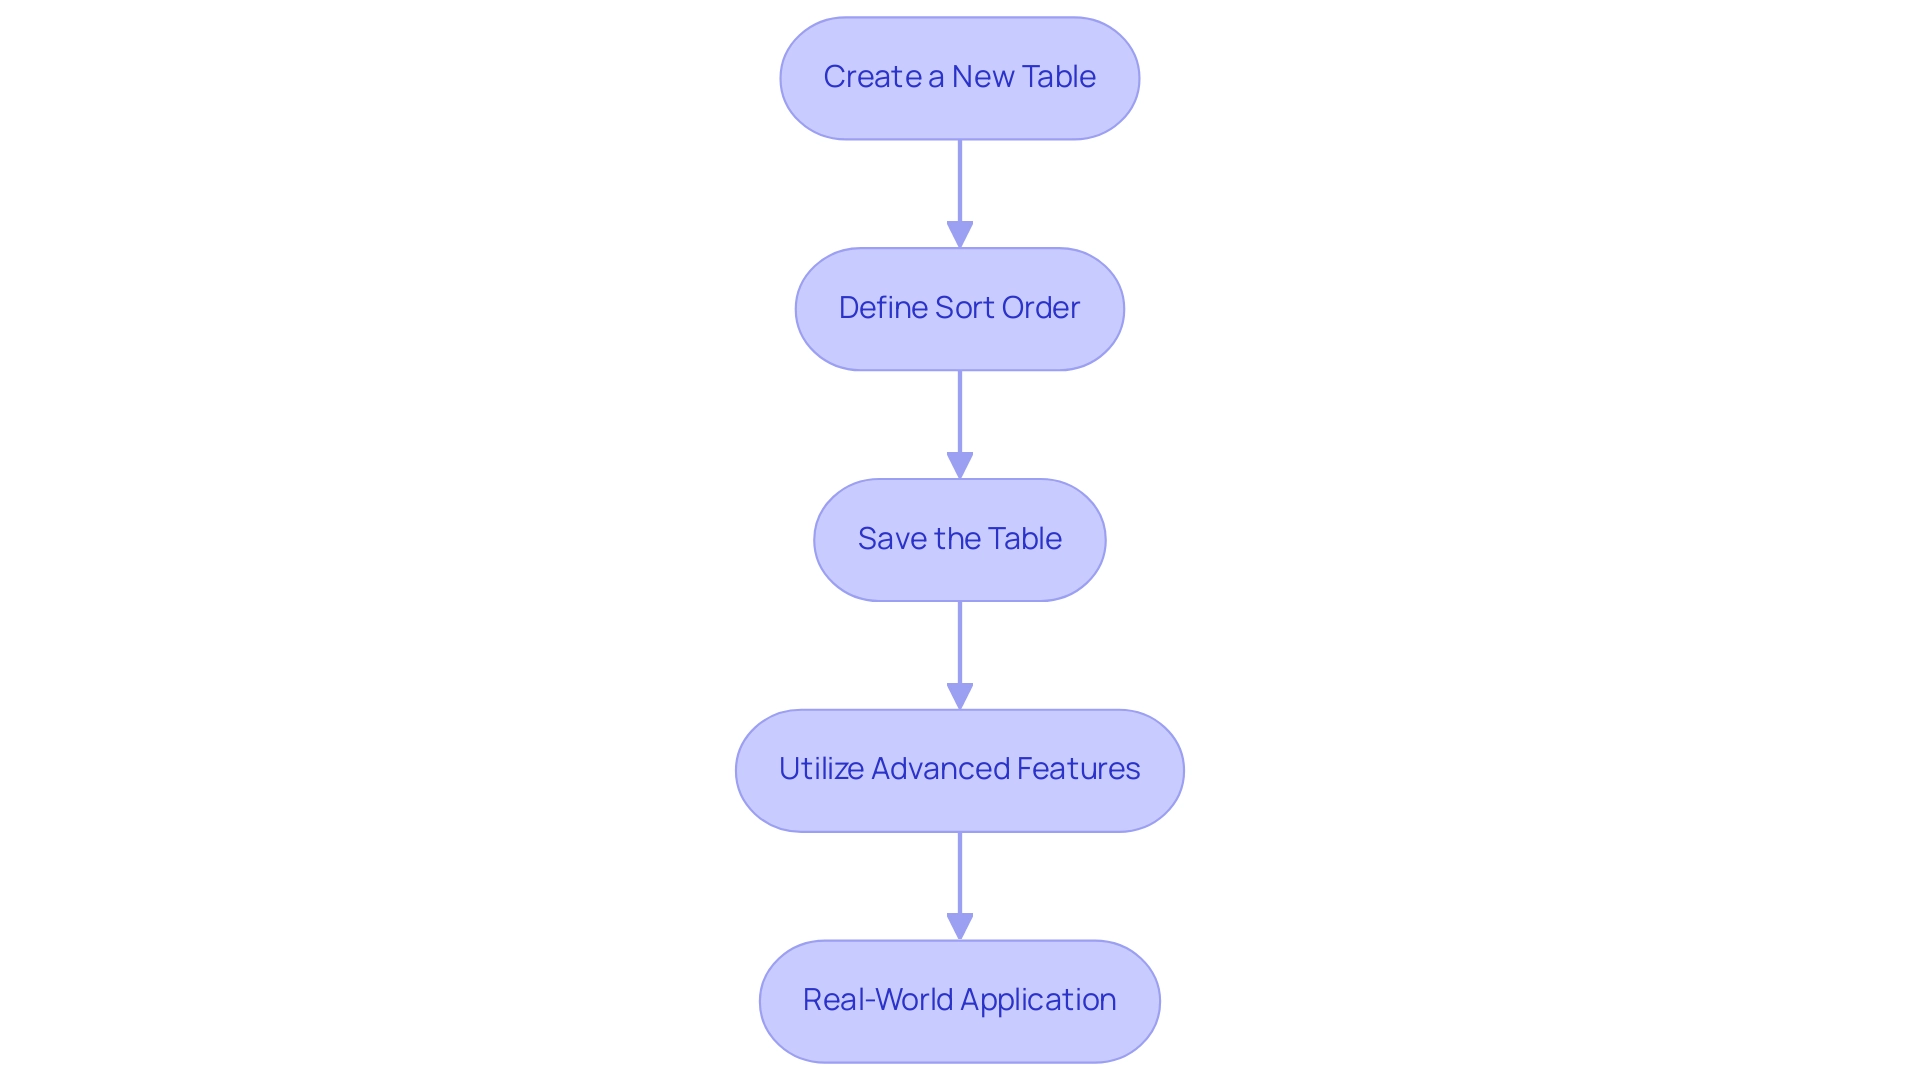
Create a New Table: Start by navigating to the ‘Home’ tab in Power BI and selecting ‘Enter Data’. This allows you to create a new table specifically for sorting purposes. Ensure this table contains two essential columns: one for the values you wish to arrange and another for the Power BI custom sort order. This step is crucial to avoid the time-consuming report creation that often detracts from data analysis.
-
Define Sort Order: In the sort order column, input numeric values that reflect the desired sequence. For example, when arranging months, assign January the value of 1, February the value of 2, and continue this pattern through December. This custom arrangement logic can also classify items into groups, such as Rural, Urban, Mix, and Youth, enhancing the clarity of your presentation and addressing potential inconsistencies that may arise from a lack of governance strategy, utilizing a Power BI custom sort order.
-
Save the Table: After populating your sort table, save it and ensure it is properly connected to your main information table. This connection is essential for effective sorting and will enable seamless analysis. Note that if you wish to share your report, it must be saved in Premium capacity to enable sharing, thus ensuring that stakeholders have access to consistent and reliable information.
-
Utilize Advanced Features: Leverage Power BI’s capabilities, such as conditional formatting, to enhance your visualizations. This feature allows you to apply color gradients and icons based on numerical values, making your information more intuitive and engaging. As Keren Aharon observes, “This solution demonstrates how advanced DAX measures and nested sorting can be utilized in BI to enhance visualization and analysis,” offering practical guidance that is frequently absent in conventional reports. These advanced features specifically address the challenges of report creation and inconsistencies by allowing for more dynamic and insightful presentations of information.
-
Real-World Application: Consider the case study of creating a new table named ‘Key’ in Business Intelligence, which serves as a foundation for future calculations. This approach not only organizes information effectively but also prepares it for advanced analysis, showcasing the importance of a well-structured sort table in driving insights and operational efficiency for business growth.
By following these steps, you can establish a robust sorting mechanism in Business Intelligence using Power BI custom sort order that enhances information visualization and analysis, ultimately driving better decision-making and addressing the challenges of report creation and information governance. At Creatum GmbH, we stress the significance of these strategies in enhancing your information processes.
Integrating the Sort Table into Your Data Model
Incorporating an organized table into your Power BI information model is essential for efficient analysis, especially in today’s information-rich environment where leveraging Business Intelligence (BI) and Robotic Process Automation (RPA) is crucial for driving growth and innovation. Follow these steps to ensure seamless integration:
-
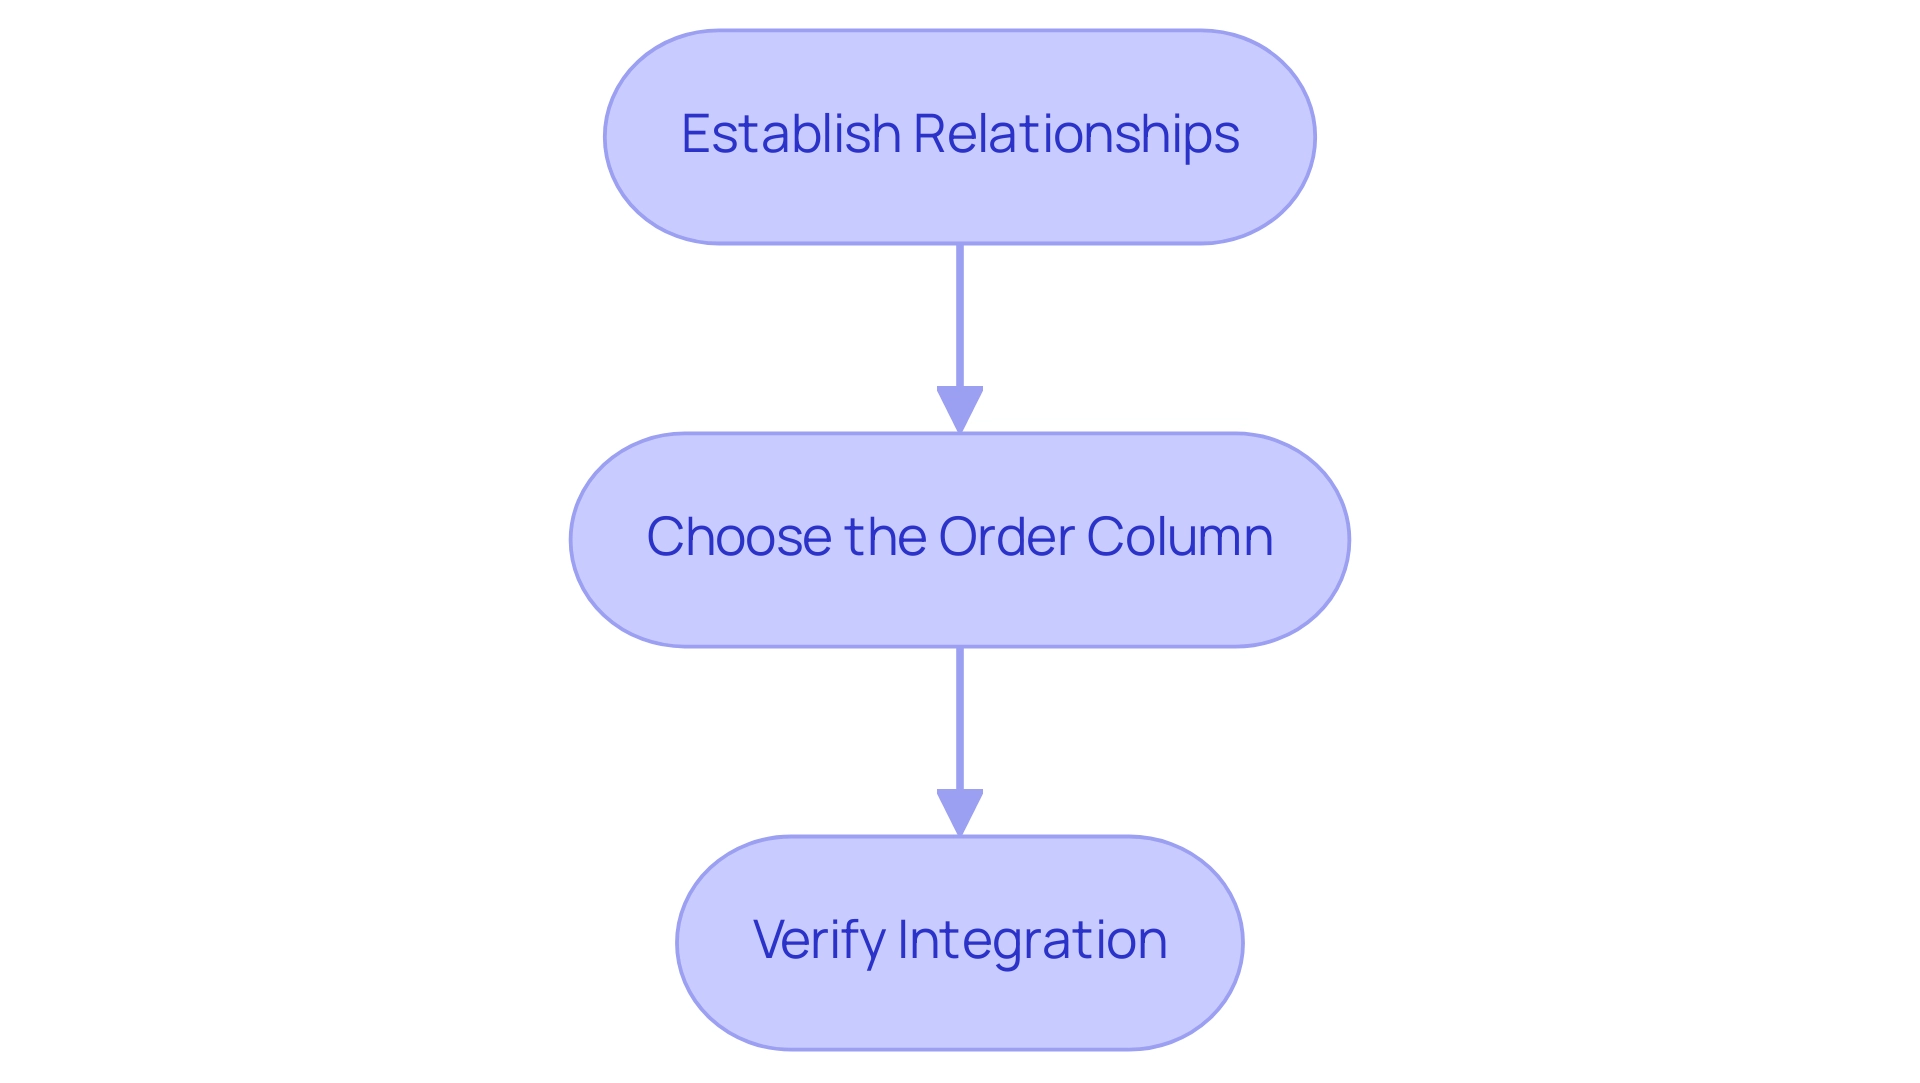
Establish Relationships: Start by navigating to the ‘Model’ view. Here, create a connection between your main information table and the sort table. This relationship should link the value column in your main table to the corresponding value in the sort table, which is vital for implementing the Power BI custom sort order for precise representation. Establishing these relationships not only enhances information integrity but also optimizes the performance of your reports. The star schema methodology, which categorizes tables effectively for analytical querying, supports this approach. As Hayley Hodges emphasizes, ‘The star schema is a well-established modeling technique commonly used in relational warehouses.’
-
Choose the Order Column: In your primary information table, identify the column you wish to arrange. Navigate to the ‘Column tools’ tab and select ‘Sort by Column’. From your sort table, choose the appropriate sort order column. This step is critical for ensuring that your information is presented in a meaningful sequence, achieved by applying a Power BI custom sort order that aligns with your analytical goals. Additionally, consider utilizing Power BI’s conditional formatting options, such as color gradients and icons, to visually represent data values in tables, thereby enhancing the overall data visualization experience.
-
Verify Integration: After applying the arrangement order, it is essential to confirm that the integration has been successful. Check your visualizations to ensure that the custom arrangement is functioning as intended. This verification process is crucial, as it impacts the overall effectiveness of your analysis and decision-making.
In 2025, incorporating sort tables in BI models has grown increasingly important, with experts underscoring the necessity for robust relationships between tables to enable Power BI custom sort order. Statistics indicate that organizations leveraging these techniques experience enhanced clarity and operational efficiency. For instance, Shashanka Shekhar’s post on March 10, 2024, garnered 102 interactions, highlighting the relevance and engagement of the topic within the community.
Real-world examples illustrate that effective relationship management in BI enhances sorting capabilities, particularly with the use of Power BI custom sort order, driving better insights and leading to more informed business decisions. Furthermore, employing a star schema can optimize analytical querying and improve the performance and maintainability of BI reports, addressing common challenges such as time-consuming report creation and data inconsistencies. By integrating RPA solutions like EMMA RPA and Automate, businesses can further streamline their processes, reduce manual effort, and enhance operational efficiency.
Finalizing Your Custom Sort Settings
To effectively finalize your custom sort settings in Power BI, follow these structured steps:
-
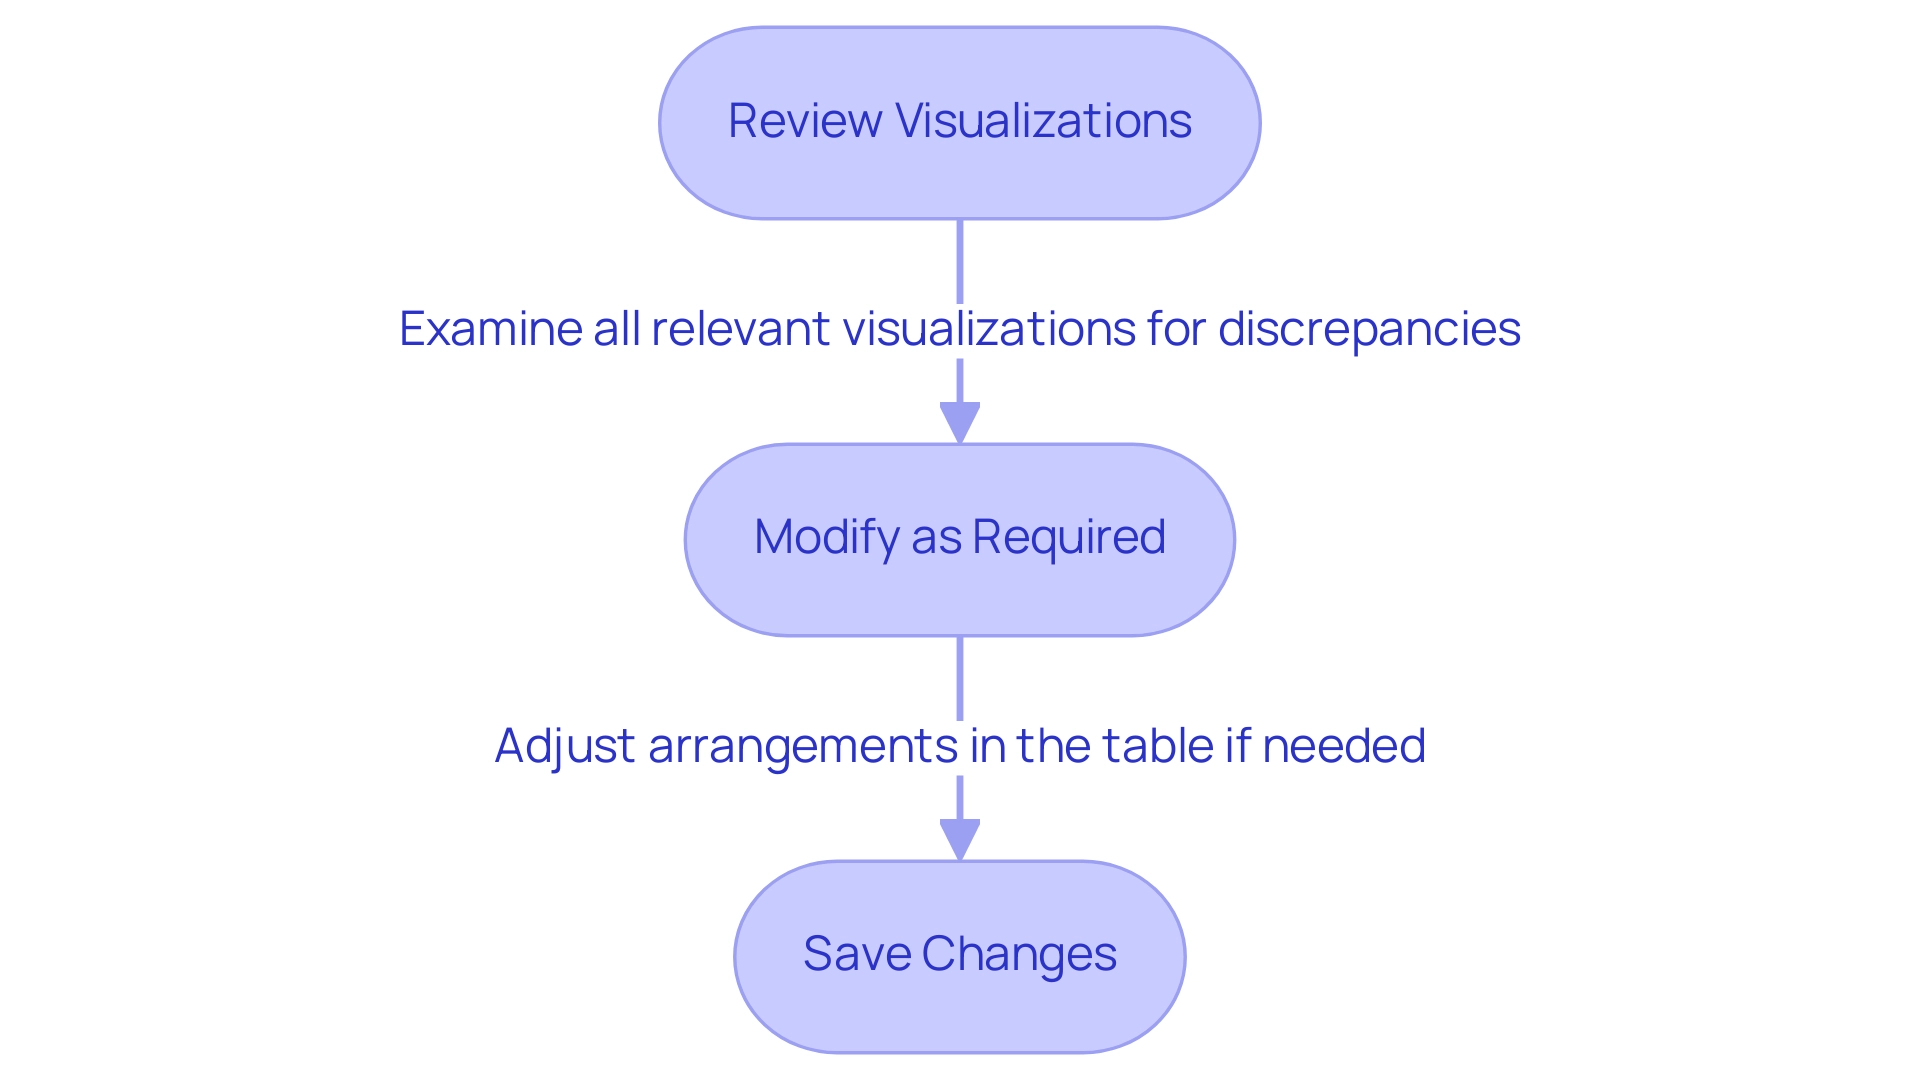
Review Visualizations: Begin by thoroughly examining all relevant visualizations to confirm that the custom arrangement is accurately applied. Pay close attention to any discrepancies in how information is presented, as this can significantly impact analysis outcomes and hinder your ability to leverage actionable insights from your dashboards.
-
Modify as Required: If you notice any visual representations that do not display the desired arrangement, review the arrangement table and the connections within your information model. Making these adjustments is crucial for ensuring consistency across your reports. BI administrators can enable or disable data model editing in the service for specific security groups, which is essential for maintaining data integrity and addressing challenges like data inconsistencies.
-
Save Changes: After confirming that your custom sort settings meet your expectations, save your Power BI report. This action preserves your adjustments, ensuring that your custom sorting remains intact for future analyses, thus streamlining the report creation process.
In 2025, the significance of examining visualizations cannot be overstated, as it directly affects the effectiveness of analysis. Organizations utilizing advanced analytics tools, such as Inforiver Analytics+, can leverage over 100 chart types to visualize information effectively, supporting use cases with more than 30,000 points. This capability highlights the necessity of meticulous review processes to enhance information clarity and usability, ultimately driving business growth through informed decision-making.
Real-world examples, such as the CleanMac Dashboard developed by Outcrowd, illustrate how thoughtful information architecture can aid users in navigating complex data without feeling overwhelmed. Additionally, adding the Category field to the Legend helps visualize how segments are categorized, further enhancing the clarity of your reports. As Patrick LeBlanc, Principal Program Manager, emphasizes, “We highly value your feedback, so please share your thoughts using the feedback forum.”
By adopting these practices, you can guarantee that your BI visualizations not only demonstrate precise arrangement but also support informed decision-making, utilizing the full potential of Business Intelligence and RPA for operational efficiency.
Advanced Techniques: Using Calculated Columns for Sorting
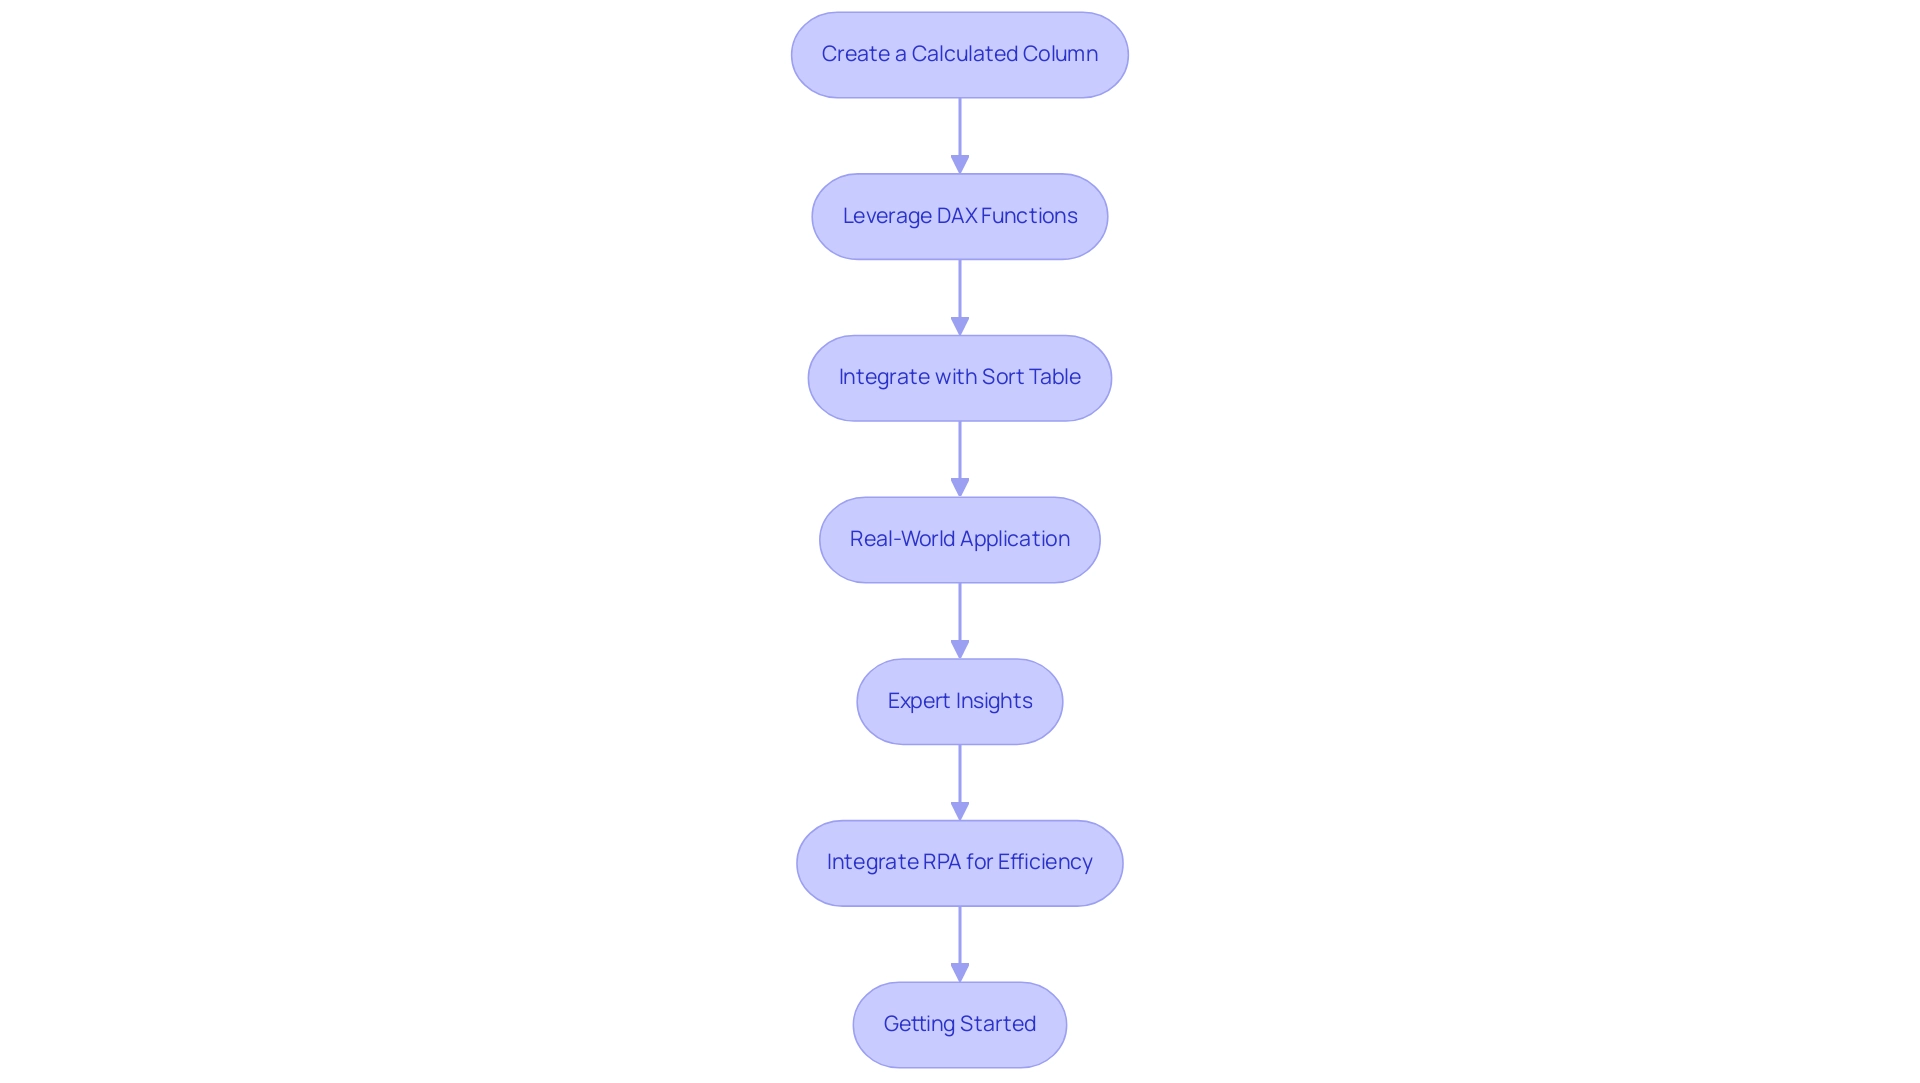
Advanced users can significantly elevate their custom sorting capabilities in Power BI custom sort order by effectively utilizing calculated columns. Here’s a detailed approach to mastering this technique, while also addressing the challenges of time-consuming report creation and data inconsistencies that often hinder effective data analysis:
-
Create a Calculated Column: Begin by adding a calculated column to your main table. This column should establish the arrangement based on specific criteria pertinent to your analysis. For instance, if you aim to sort products by sales figures, your calculated column could reflect the total sales for each product, thus enhancing the actionable insights derived from your data.
-
Leverage DAX Functions: Utilize DAX (Data Analysis Expressions) functions to establish dynamic ordering logic. This approach enables you to implement more intricate sorting scenarios, such as sorting by multiple criteria simultaneously. For example, you could arrange products first by category and then by sales within each category, enhancing the clarity of your visualizations and addressing the common issue of lack of actionable guidance in Power BI dashboards.
-
Integrate with Sort Table: It is crucial to ensure that your calculated column is seamlessly integrated with your sort table. This integration maintains consistency in arrangement across all visualizations, allowing for a cohesive data presentation. By doing so, you can avoid discrepancies that may arise from manual organization methods, thus improving operational efficiency.
-
Real-World Application: A case study on nested arrangement in Power BI Bar charts illustrates the effectiveness of using calculated fields. This study highlights the limitations of traditional sorting methods, such as the Shift + Click technique, and demonstrates how calculated columns can facilitate hierarchical sorting. By utilizing calculated fields or ranking measures, users can ensure that visualizations accurately reflect the desired organization, overcoming the challenges posed by conventional methods and enhancing the overall information-driven decision-making process.
-
Expert Insights: Industry specialists, including Devin Knight, highlight the significance of mastering X-axis customization techniques for creating more meaningful visuals in BI. Knight states, “Driving adoption of technology through learning is essential for operational efficiency.” By adopting calculated columns for sorting, users can utilize a Power BI custom sort order to enhance their storytelling capabilities, ultimately driving better decision-making and leveraging the full potential of Business Intelligence.
-
Integrate RPA for Efficiency: To further streamline the report creation process, consider integrating Robotic Process Automation (RPA) tools like EMMA RPA or Automate. These tools can automate repetitive tasks involved in data preparation and report generation, significantly reducing the time spent on manual processes and minimizing data inconsistencies. This integration not only enhances operational efficiency but also allows users to focus on deriving actionable insights from their BI reports.
-
Getting Started: Users can create a BI report by opening BI Desktop and clicking ‘Get Data’ in the ‘Home’ tab, providing a practical starting point for their analysis.
By implementing these advanced techniques and integrating RPA, users can transform their BI reports into effective tools for data analysis, ensuring that insights are not only accurate but also presented in a visually compelling manner. Mastering X-axis customization techniques is crucial for achieving meaningful visuals in BI, thereby reinforcing the significance of BI and RPA in driving business growth.
Key Takeaways for Mastering Custom Sort Order
To effectively master Power BI custom sort order, consider the following essential points.
-
Understand the Basics: Grasping the fundamentals of custom arrangement is crucial for effective information visualization. Custom organization enables a more intuitive arrangement of information, enhancing clarity and insight, which is essential in overcoming challenges related to poor master information quality.
-
Anticipate Challenges: Recognizing potential difficulties in arranging is vital. With 330,215 views for user reporting sorting issues, common problems may arise from types or relationships within your model. Being ready to address these proactively can save time and enhance results, especially in an environment where inconsistencies can obstruct effective decision-making.
-
Set Up and Integrate: Establish a dedicated sort table and ensure it is seamlessly integrated into your data model. This integration is key to achieving the desired arrangement effect across your visualizations, aligning with the need for tailored solutions that enhance operational efficiency.
-
Utilize Advanced Techniques: Leverage advanced sorting methods, such as creating calculated columns. For example, utilizing a DimDate table to assign numerical values to days of the week enables a more structured presentation of time-related information. This approach is demonstrated in case studies where users successfully sorted abbreviated day names. Additionally, adding the Category field to the Legend helps visualize how segments are categorized, providing clarity in your reports and addressing the challenges of time-consuming report creation.
-
Review and Finalize: Conduct thorough reviews of your visualizations. Finalizing your settings is essential to ensure that the information is presented accurately and effectively, which is particularly important in an information-rich environment where clarity is paramount. As noted by theblackknight, when calculating percentages for each category after arranging, you will need to adjust your formula to aggregate based on the new column created in the original table.
By mastering these techniques, you can significantly enhance your data presentation capabilities in Power BI, ensuring that your insights are not only accurate but also easily interpretable. Understanding the nuances of Power BI custom sort order will empower you to create more impactful visualizations that resonate with your audience, ultimately driving growth and innovation.
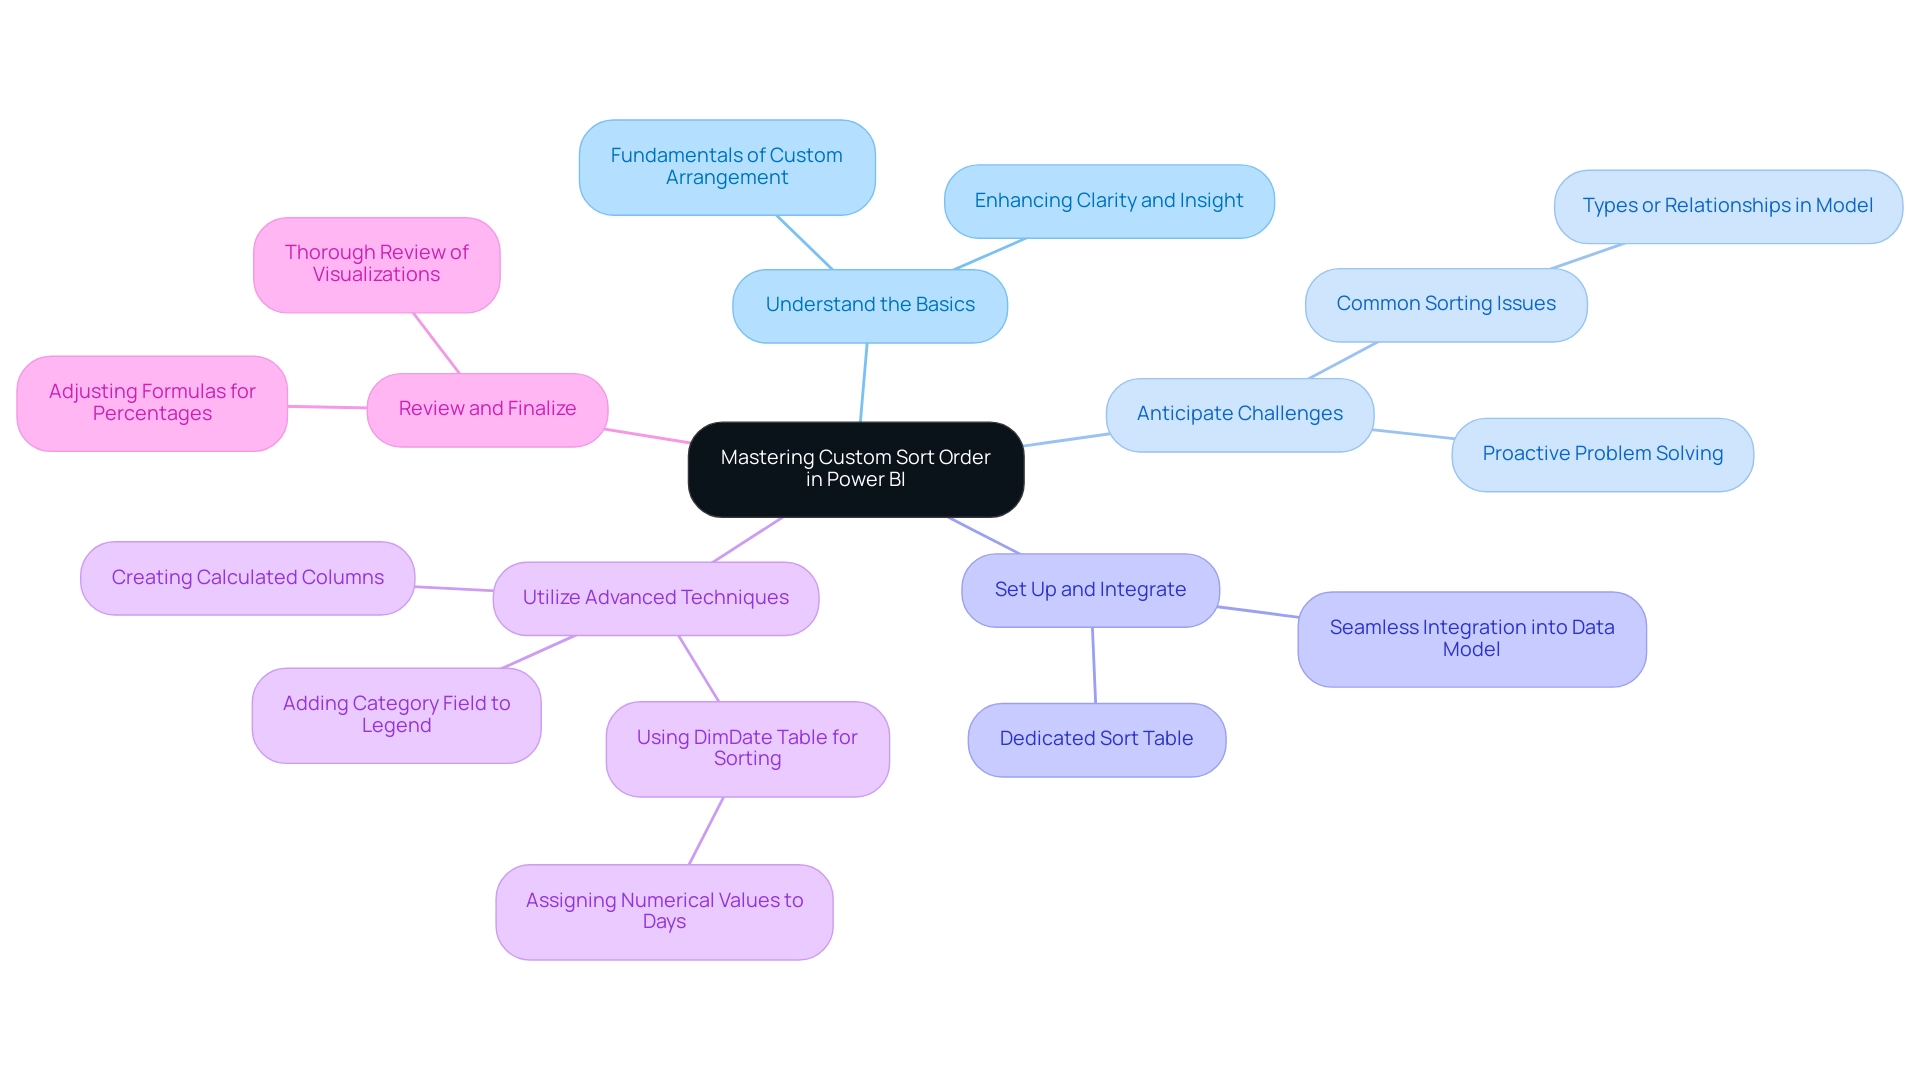
Conclusion
Custom sorting in Power BI is not just a skill—it’s a game changer for data visualization and decision-making. By transcending traditional sorting methods, users can customize their reports to align precisely with their analytical objectives. Understanding the intricacies of implementing custom sorts, including data type compatibility and establishing proper relationships within data models, is essential for overcoming common challenges and ensuring clarity in data representation.
The outlined steps for setting up sort tables, integrating them into data models, and finalizing custom sort settings offer practical guidance that users can readily apply. Highlighting the importance of calculated columns and advanced techniques further emphasizes Power BI’s potential as a robust tool for data analysis. By leveraging these strategies, users not only streamline report creation but also enhance the overall quality of insights derived from their data.
Mastering custom sorting in Power BI empowers users to craft compelling narratives from their data, fostering informed decision-making and operational efficiency in a competitive landscape. By prioritizing these techniques, organizations can transform their approach to data visualization, ensuring that insights resonate with stakeholders and drive growth and innovation.
Frequently Asked Questions
What is the purpose of custom sort order in Power BI?
Custom sort order in Power BI allows users to dictate the arrangement of information in reports and dashboards, enabling a more intuitive presentation that can differ from default alphabetical or numerical organization.
Why is custom sorting important in 2025?
In 2025, the importance of custom sorting has been highlighted by many discussions, as users seek solutions for organizational challenges, particularly with calculated columns, which enhances the efficiency of information visualization.
How does custom sorting improve data visualization?
Custom sorting enhances the quality and clarity of visualizations, making it easier to extract actionable insights for stakeholders, which is crucial in today’s information-rich environment.
What are some common challenges when implementing custom sort order in Power BI?
Key challenges include ensuring compatibility of information types, the absence of necessary sort columns, and managing complex information relationships across multiple tables.
How can users address the issue of incompatible information types?
Users must pay careful attention to detail when organizing text fields, as mismatched information types can lead to unexpected ordering outcomes.
What should users do if the necessary sort columns are missing from their dataset?
Users may need to create additional columns to enable the desired arrangement, which can complicate the preparation process and increase the risk of mistakes.
Why is understanding complex information relationships important for sorting?
Maintaining the integrity of sort orders across interconnected tables is complex, requiring a clear understanding of these relationships to ensure consistent and accurate sorting.
What resources are available for users facing organizational challenges in Power BI?
Microsoft offers a 60-day trial phase of BI Pro, and the BI community shares valuable experiences, tutorials, and tips to help users overcome organizational challenges.
What was a practical example shared by a user regarding custom sorting?
A user noted that custom sorting effectively resolved an issue where months were not displaying in the correct chronological order in their visual.
How can the Category field be utilized in Power BI?
Incorporating the Category field into the Legend can aid in visualizing how segments are categorized, thereby enhancing the clarity of presentations.
Overview
Mastering Power BI Embedded Capacity is essential for organizations aiming to optimize their analytics. Understanding its structure and effective capacity planning are crucial steps in this process. By assessing user load, data volume, and conducting performance testing, organizations can significantly enhance their Power BI experience.
Implementing best practices, such as incremental refresh and efficient licensing, further boosts performance. These strategies not only improve user experience but also ensure that analytics are both effective and scalable. Are you ready to elevate your organization’s Power BI capabilities? Embrace these insights to transform your analytics landscape.
Introduction
In the rapidly evolving landscape of data analytics, organizations are increasingly turning to Power BI Embedded to enhance their reporting capabilities and drive informed decision-making. This powerful tool not only facilitates the seamless integration of interactive dashboards and reports within applications but also optimizes performance through effective capacity planning and resource management.
As businesses gear up for 2025, understanding the intricacies of Power BI Embedded—from licensing options to best practices for performance optimization—becomes crucial. This article delves into the essential components of Power BI Embedded, offering insights into how organizations can leverage its full potential while overcoming common challenges in implementation.
Through a comprehensive exploration of strategies and expert recommendations, readers will discover how to navigate the complexities of Power BI Embedded and harness its capabilities to foster a data-driven culture.
Understanding Power BI Embedded Capacity: An Overview
Power BI Embedded Capacity represents the dedicated resources essential for executing BI reports and dashboards within applications. This feature empowers organizations to seamlessly integrate analytics into their applications, offering users interactive visual representations without the need for separate BI licenses. Understanding the structure of Power BI Embedded Capacity is crucial for enhancing performance and ensuring resources are allocated effectively based on user demand and information complexity.
By 2025, all BI content will be managed within workspaces in Microsoft Fabric, significantly enhancing collaboration and data management. This architecture facilitates efficient scaling, allowing organizations to adapt to varying workloads while maintaining optimal performance. Importantly, the memory available on each node size is constrained by the memory footprint of a single BI item, which is vital for effective resource allocation.
For example, Inforiver Analytics+ serves as a migration partner for enterprises transitioning from legacy BI platforms to modern BI solutions, streamlining the migration process and enhancing visualization capabilities. This tool boasts over 100 chart types, enabling users to effortlessly generate intricate reports and dashboards, thus showcasing the practical benefits of optimized Power BI Embedded Capacity.
Current trends indicate a growing reliance on Power BI Embedded Capacity, as companies increasingly recognize the importance of customized analytics in shaping decision-making processes. In a data-rich environment, the ability to extract meaningful insights through BI is paramount. Experts emphasize that refining the architecture of Power BI Embedded Capacity not only enhances performance but also enriches user experience, positioning it as a critical focus for organizations aiming to leverage information effectively in 2025.
Moreover, our BI services guarantee efficient reporting, data consistency, and clear, actionable guidance. We offer a 3-Day BI Sprint for rapid report creation and the General Management App for comprehensive management and insightful reviews. As Patrick LeBlanc, Principal Program Manager, asserts, “We highly value your feedback, so please share your thoughts using the feedback forum.” By implementing best practices in Power BI Embedded Capacity and leveraging our EMMA RPA solutions, organizations can overcome outdated systems and ensure they are well-equipped to meet the demands of modern analytics.
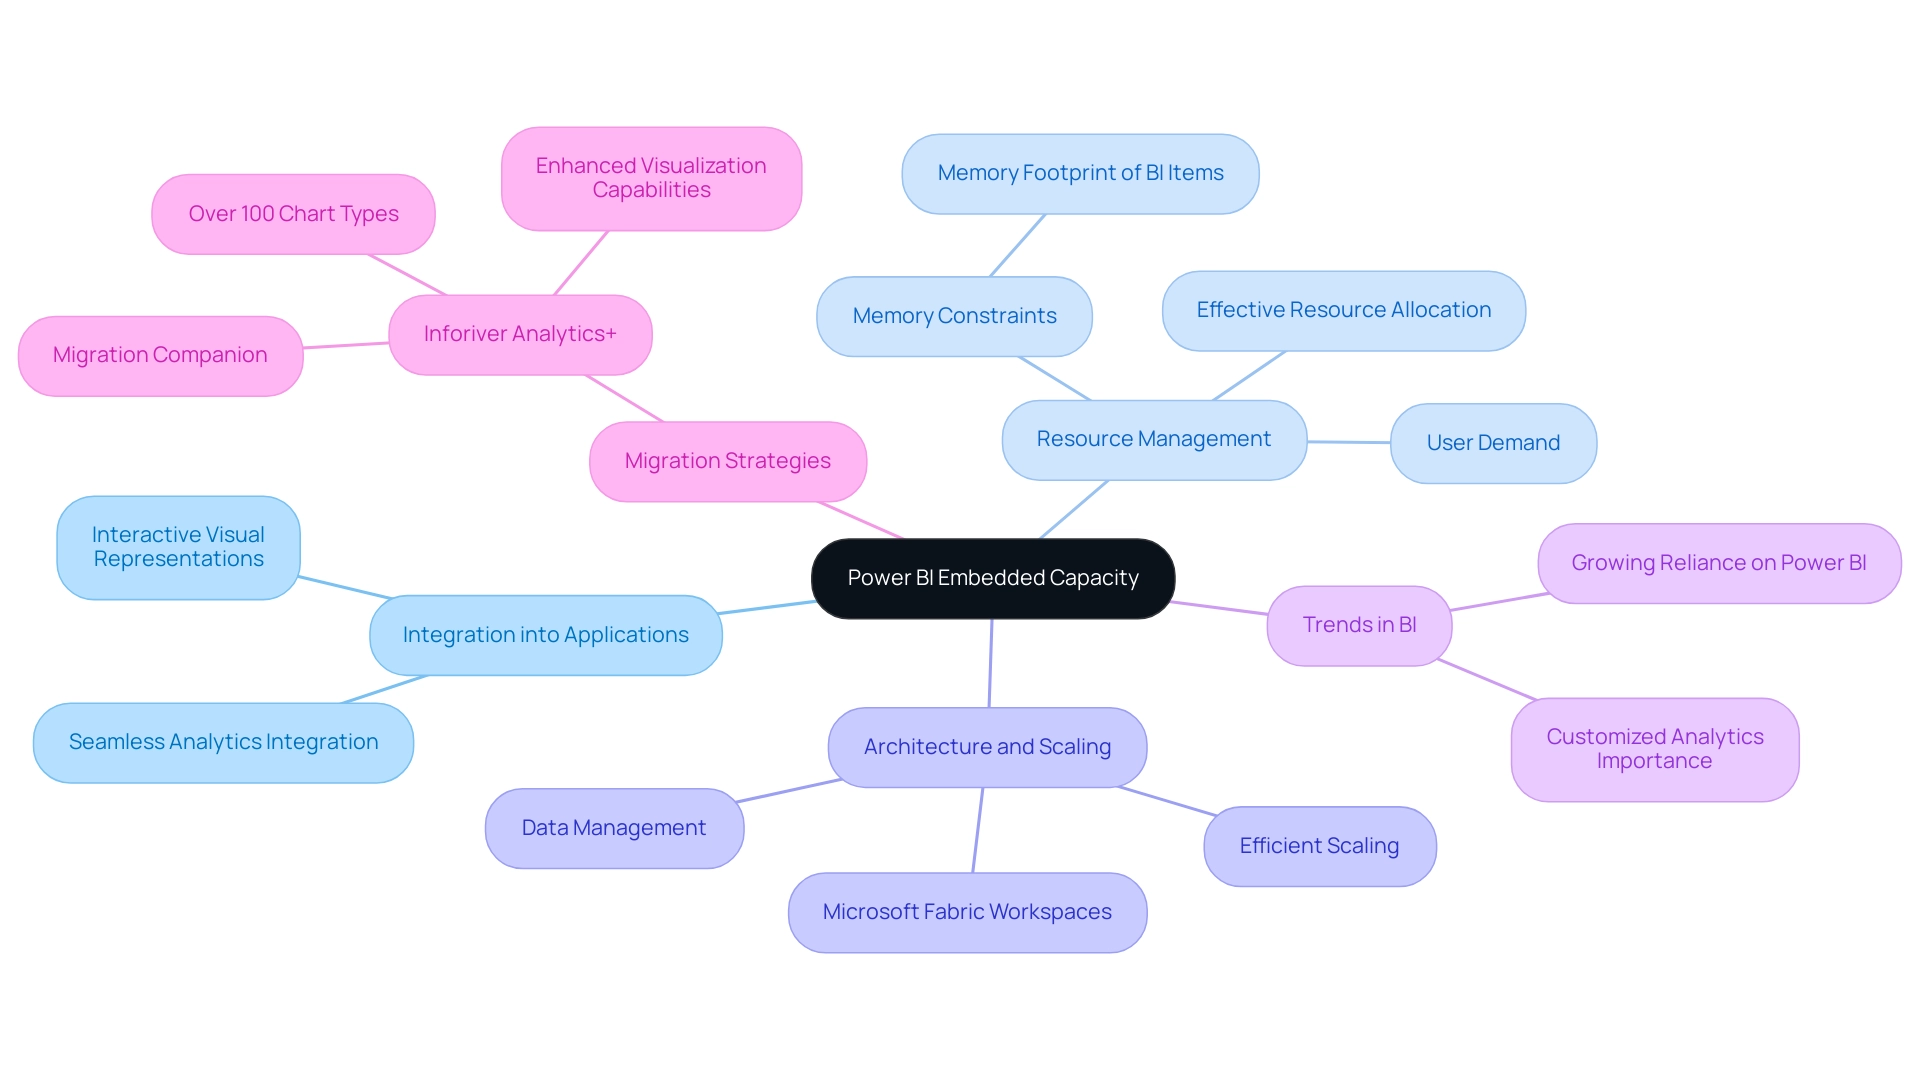
Capacity Planning: Key Considerations for Power BI Embedded
Effective planning for Power BI Embedded capacity is crucial for optimizing performance and ensuring a seamless experience. Organizations must assess several key factors to achieve this:
-
Load: Accurately estimating the number of simultaneous individuals accessing reports and dashboards is essential. This estimation helps determine the necessary capacity to support user demands without compromising performance.
-
Data Volume: A thorough analysis of dataset size and complexity is vital. Organizations should ensure that the allocated capacity can efficiently manage processing, preventing delays that could hinder decision-making. In today’s data-rich environment, the ability to extract meaningful insights from this data is paramount for maintaining a competitive edge.
-
Performance Testing: Conducting load testing is a proactive approach to identify potential performance issues. By mimicking participant interactions prior to launch, entities can resolve bottlenecks and improve system dependability. Understanding the limitations of usage metrics, as discussed in the case study ‘Limitations and Considerations of Usage Metrics,’ is important for accurately interpreting these metrics and considering alternative tracking methods.
-
Scaling Options: Utilizing Azure’s scaling features enables entities to modify capacity dynamically according to real-time usage patterns. This flexibility is especially advantageous during peak usage periods, ensuring optimal performance and customer satisfaction.
In 2025, comprehending load statistics and data volume trends will be essential for effective capacity planning. Organizations should be aware of the increasing complexity of reports and the rising number of individuals, which can significantly affect performance. By applying best practices for load estimation and considering real-world examples of effective capacity planning, businesses can enhance their implementations of Power BI Embedded capacity.
Additionally, the use of custom visuals in Power BI allows for high personalization and customization, enabling analysts to create tailored visual representations that meet specific business needs, further enhancing the overall user experience.
This strategic approach not only improves operational efficiency but also aligns with the recognition of Power BI as the ‘Embedded Analytics Solution of the Year’ at the ’24 Breakthrough Awards,’ underscoring its value in the analytics landscape. As Rena from the Community Support Team notes, creating a ‘Date Table’ and establishing relationships is essential for effective data integration, which is a key component of capacity planning. Furthermore, addressing the challenges of time-consuming report creation and ensuring actionable guidance from dashboards will empower entities to leverage insights effectively, driving growth and innovation.
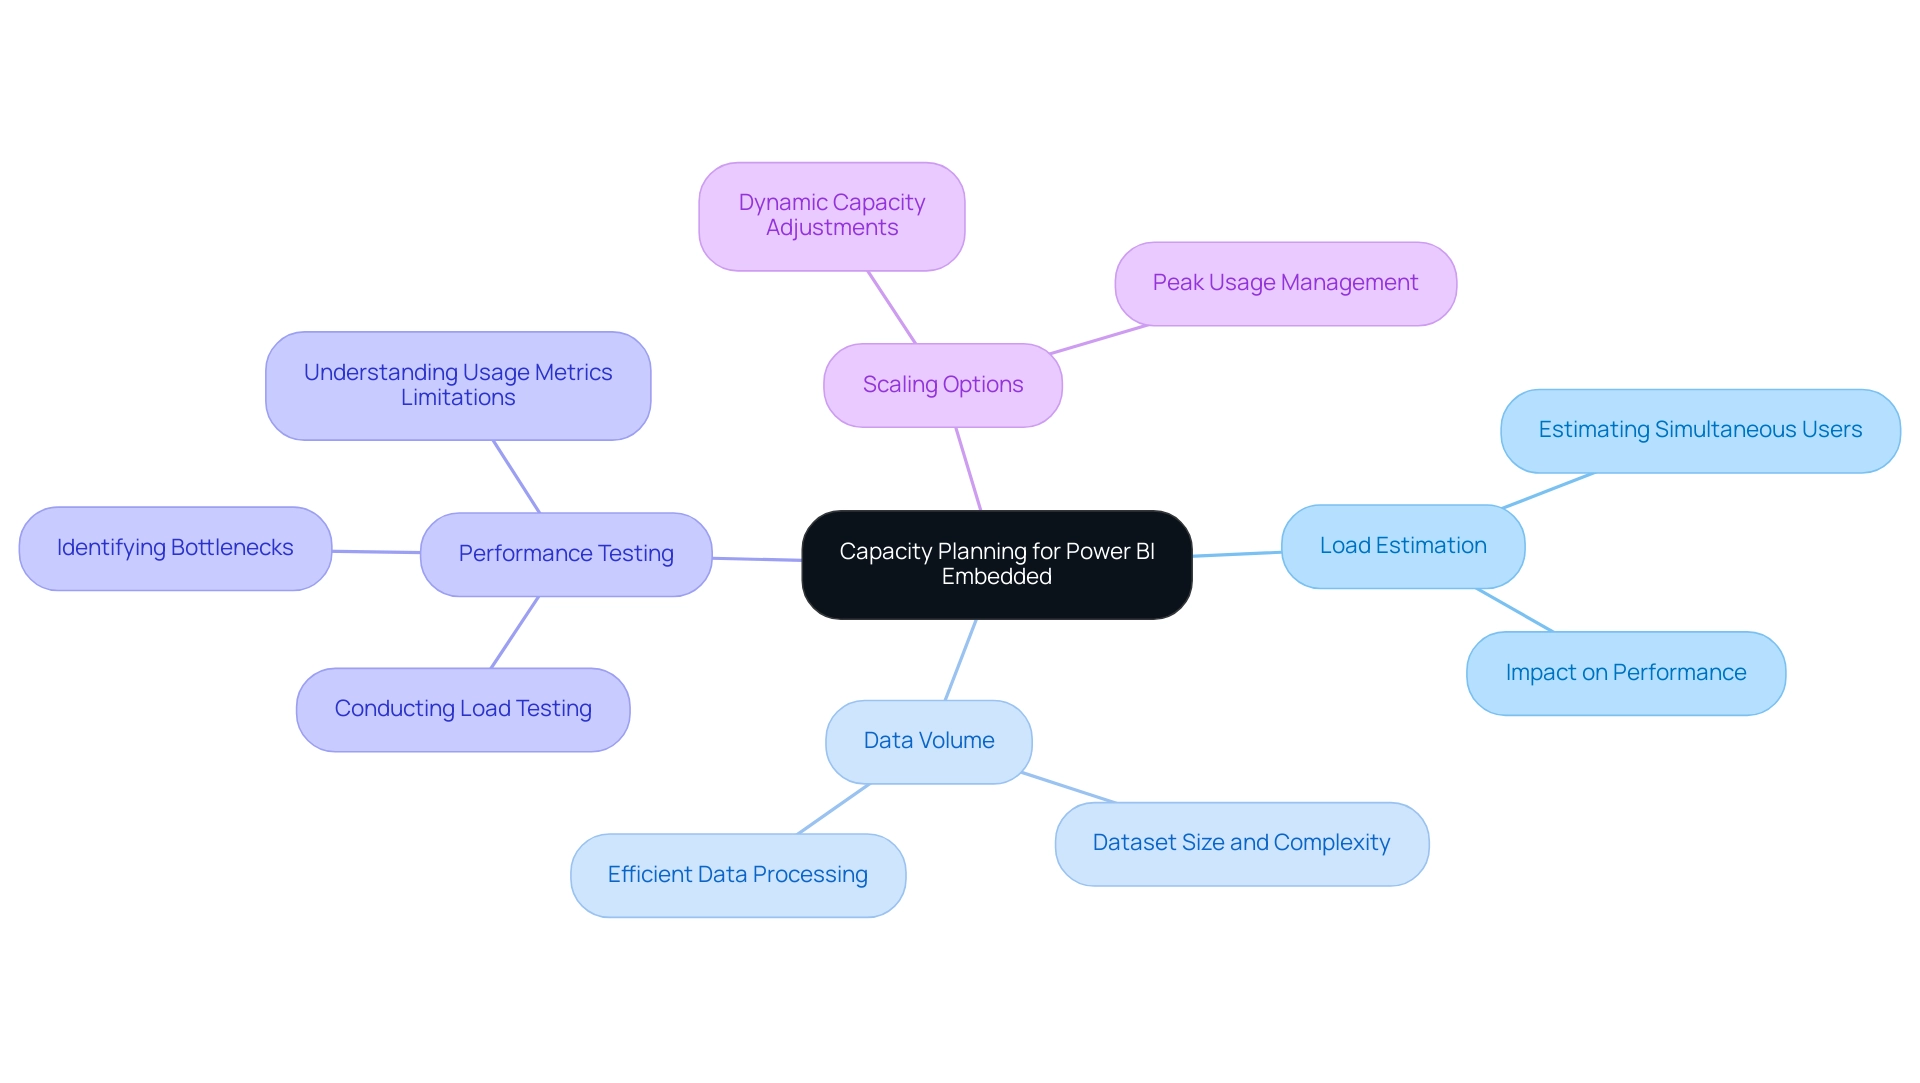
Navigating Power BI Embedded Licensing: Options and Implications
Power BI Embedded offers a variety of licensing options, notably A SKUs and EM SKUs, each designed to meet distinct organizational needs and pricing structures. To make informed decisions, organizations must carefully evaluate the following factors:
-
Usage Patterns: Understanding whether a capacity-based or user-based licensing model aligns better with anticipated usage is crucial for cost-effectiveness. For example, entities with fluctuating user engagement may benefit from a user-based model, while those with consistent usage might find capacity-based licensing more economical.
-
Cost Implications: A thorough analysis of the total cost of ownership is essential. This encompasses not only the direct costs of licenses but also potential hidden expenses related to scaling and ongoing maintenance. Organizations must be aware that, as of 2025, possessing a BI Pro or Premium Per User (PPU) license is necessary for viewing embedded content unless deployed on a Fabric F64 capacity, which can significantly influence overall costs. Additionally, insights from Justin Hayes, CEO of a shipping analytics company, highlight the practical challenges entities face when deciding on licensing options: “We could do it but it would be a huge distraction from what our core focus is and other projects that we need to do in our massive backlog. It’s a lot of work. Time and money is the biggest blocker to building embedded analytics ourselves.” This underscores the complexities involved, particularly in the context of time-consuming report creation and the need for actionable insights.
-
Flexibility: The capability to pause or scale licenses in response to changing business needs can lead to substantial cost savings. Organizations should assess how easily they can adjust their licensing as their requirements evolve, ensuring they are not locked into unnecessary expenses.
-
Compliance: Ensuring that the chosen licensing model adheres to organizational policies and regulatory requirements is vital. This compliance not only mitigates risks but also fosters sustainable operational practices.
By navigating these licensing choices effectively, entities can optimize their investment in BI Embedded, leveraging the platform’s capabilities while managing expenses efficiently. A case study on BI Embedded capacity planning illustrates the significance of model structure and query complexity in determining capacity requirements. It emphasizes that effective planning can enhance performance and cost management, particularly when deciding between separate databases for each customer or a single multi-tenant database.
As companies prepare for upcoming improvements and functionalities in BI, understanding these licensing dynamics will be crucial to maximizing their analytics potential and addressing challenges associated with inconsistencies and the need for clear, actionable guidance.
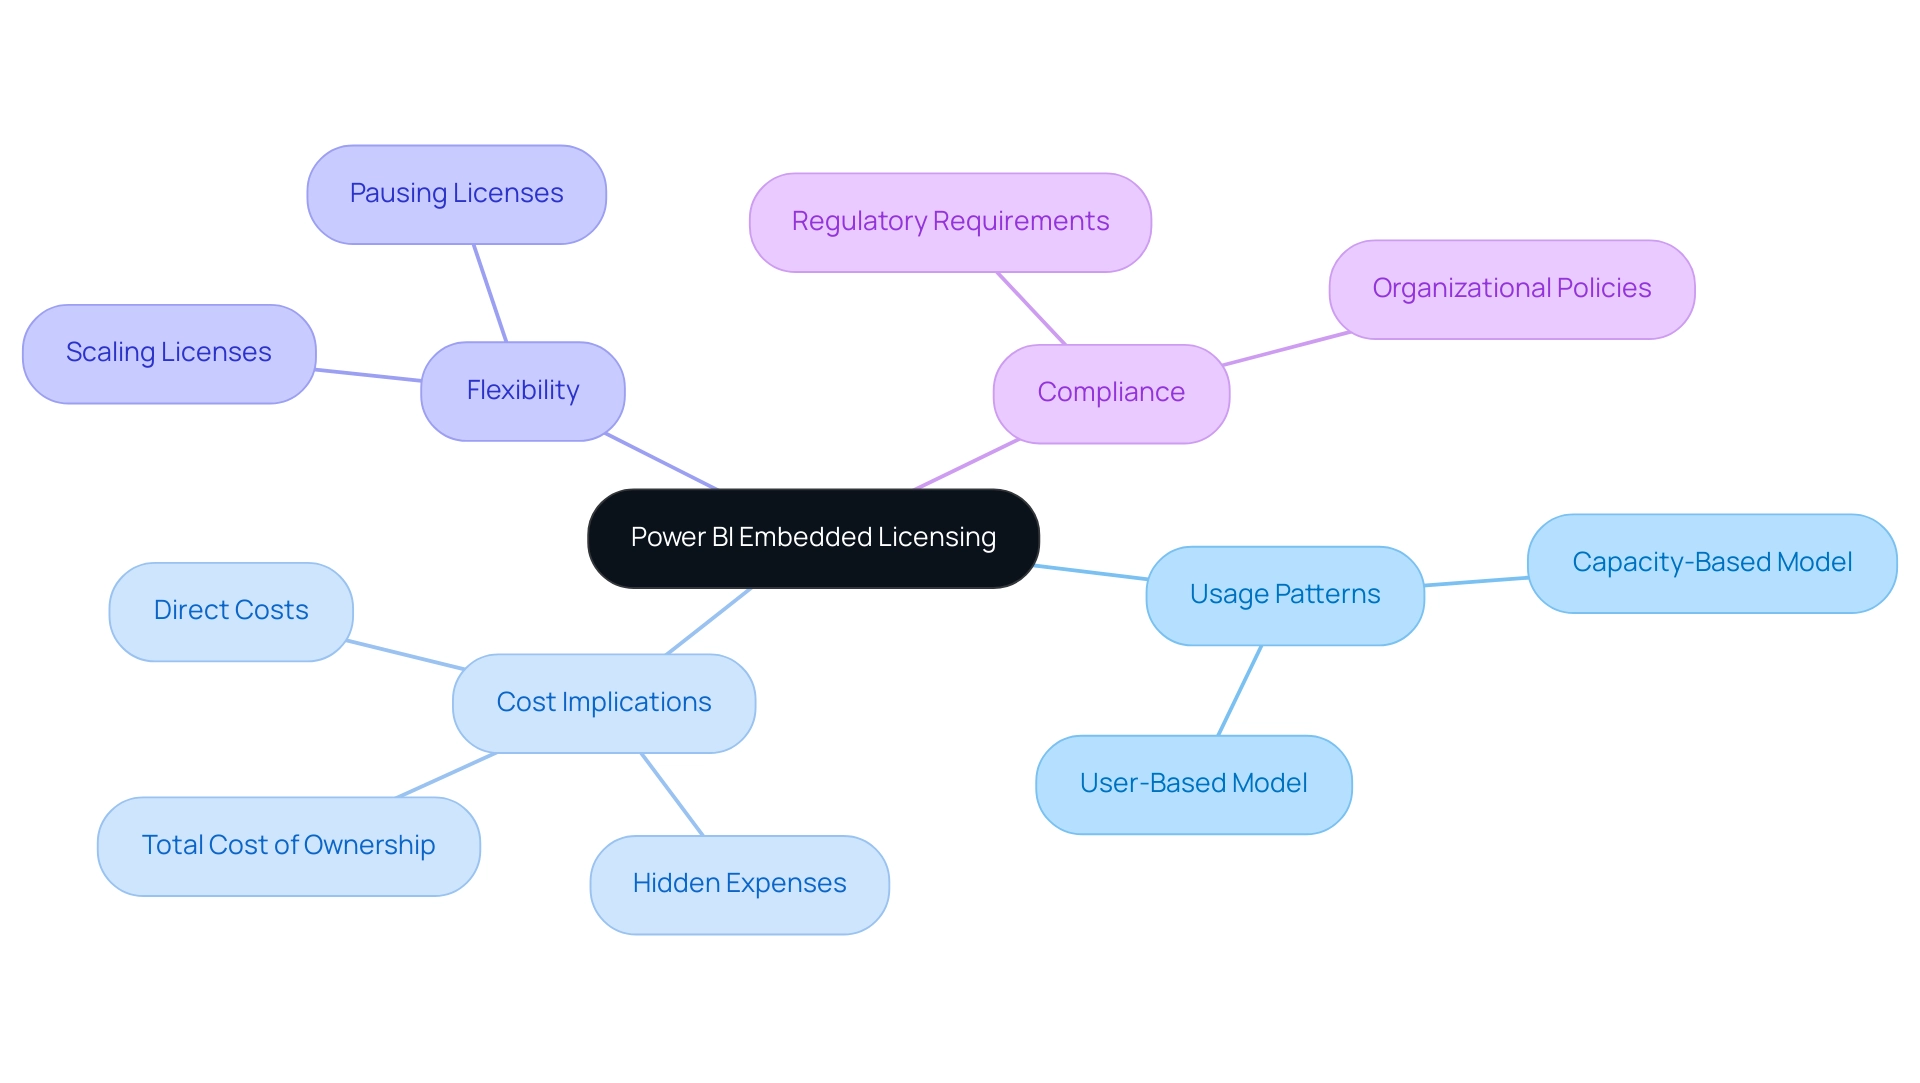
Leveraging Incremental Refresh: Enhancing Data Management
Incremental refresh in Power BI stands out as a powerful feature, enabling the platform to update only the information that has changed since the last refresh, rather than reloading the entire dataset. This capability is particularly advantageous for managing large datasets, as it significantly reduces processing time and resource consumption. To effectively configure incremental refresh, organizations can adopt several key strategies.
- Creating Parameters: Establish
RangeStartandRangeEndparameters to filter information based on specific time frames, allowing for targeted updates. - Applying Filters: Implement filters to restrict the information being refreshed, ensuring that only relevant and necessary content is processed, which optimizes performance.
- Scheduling Refreshes: Automate the refresh process by establishing scheduled refreshes, minimizing manual intervention and ensuring that information remains current.
This automation can be further enhanced by integrating Robotic Process Automation (RPA) solutions from Creatum GmbH, streamlining repetitive tasks and improving overall operational efficiency.
- Monitoring Performance: Continuously monitor the performance of incremental refresh to identify potential issues and refine configurations, ensuring optimal efficiency.
The benefits of incremental refresh are underscored by recent statistics indicating that organizations utilizing this feature can achieve up to a 70% reduction in refresh times for large datasets. Notably, only the most recent 10 days of information should be incrementally refreshed, ensuring that information older than this is not reloaded during each refresh cycle. This approach not only enhances information management strategies but also improves the overall effectiveness of analytics efforts.
Real-world examples illustrate the impact of incremental refresh. For instance, one organization successfully executed this process for particular tables in BI, ensuring real-time information accuracy in their reports. This method not only streamlined their information management but also empowered them to make informed decisions based on up-to-date insights.
The organized procedure they adhered to is outlined in the case study titled ‘Incremental Data Refresh Process in BI.’ Expert insights further emphasize the importance of incremental refresh in 2025, with professionals advocating for its use to maintain historical information while efficiently managing current updates. As one specialist remarked, ‘What I mean by retaining historical information is that; yes, my information evolves over time and I only want a specific duration of information to change, not the entire 2 years of information in BI.’ This illustrates the strategic benefits of this feature, enabling entities to retain two years’ worth of information while updating only the latest two weeks.
By utilizing incremental refresh alongside RPA from Creatum GmbH, entities can greatly improve their information management strategies, fostering growth and innovation while ensuring that their analytics capabilities remain strong and adaptable to evolving business requirements. Moreover, addressing challenges in utilizing insights from BI dashboards, such as time-consuming report creation and information inconsistencies, is essential for enhancing the effectiveness of insight-driven decision-making.
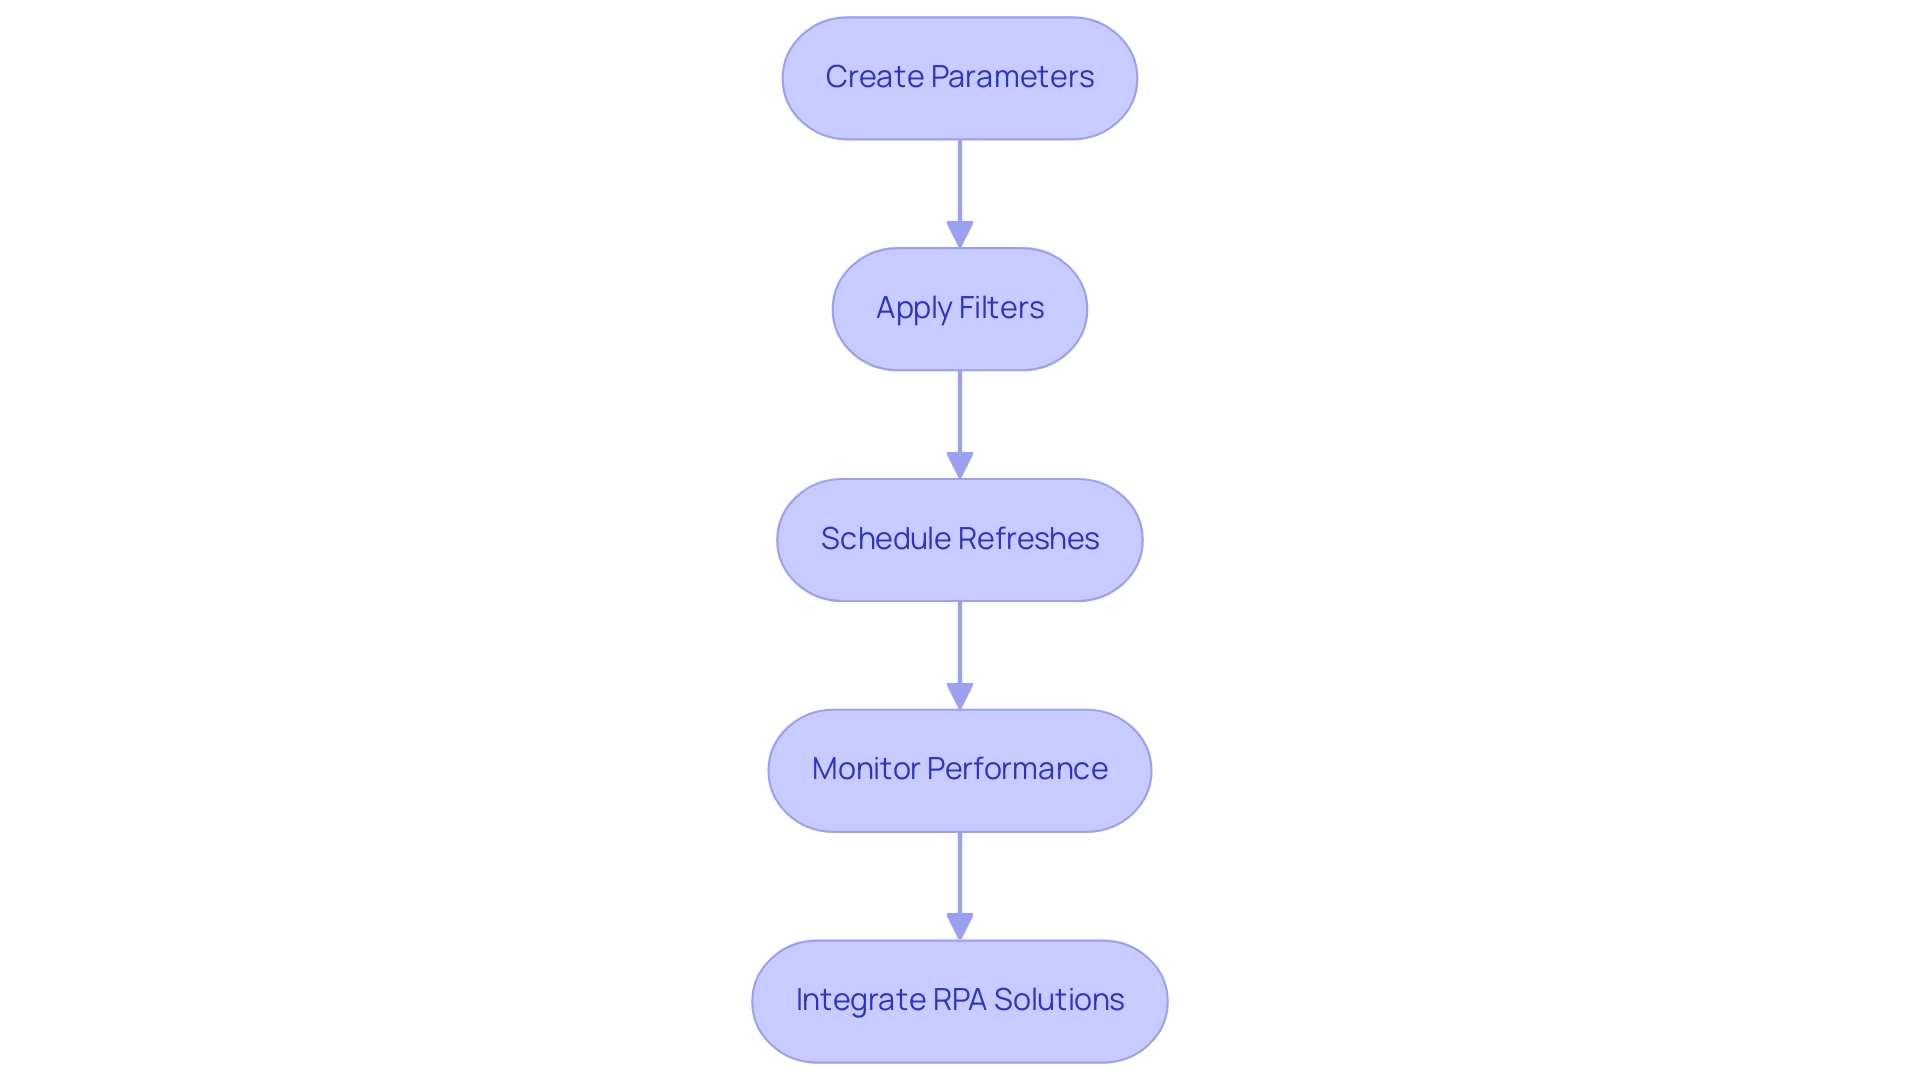
Integrating Power BI with Microsoft Fabric: What You Need to Know
Combining BI with Microsoft Fabric presents organizations with a significant opportunity to optimize workflows and enhance analytics capabilities. Key considerations for this integration include:
-
Information Accessibility: Ensuring that information from diverse sources is readily accessible within Power BI is crucial. This accessibility facilitates comprehensive analysis, enabling teams to derive actionable insights from a unified information landscape. Recent case studies have shown that support for conditional formatting in visual calculations improves analysis capabilities, allowing users to apply rules for columns and measures on their visuals. Moreover, our Power BI services are designed to enhance reporting efficiency, ensuring consistency and providing clear, actionable guidance.
-
Unified Analytics: Leveraging Microsoft Fabric allows organizations to create a cohesive analytics environment that fosters collaboration and enhances information sharing across departments. This integration simplifies data management and promotes a culture of data-driven decision-making. With features like the 3-Day BI Sprint, teams can quickly create professionally designed reports, underscoring the importance of streamlined workflows in achieving operational efficiency. The popularity of BI, with 3,433 users online, further emphasizes its role in facilitating unified analytics.
-
Performance Optimization: The advanced features of Microsoft Fabric are designed to enhance processing, significantly improving report rendering times. Experiments comparing information load and transformations between CSV files and a Fabric lakehouse utilizing Query have demonstrated practical performance improvements, making this enhancement vital for organizations that rely on real-time information analysis to inform strategic initiatives. Additionally, the integration of Power Automate allows for streamlined workflow automation, ensuring a risk-free ROI assessment and professional execution.
-
Security and Compliance: Implementing robust security measures is essential to protect sensitive information while ensuring compliance with regulatory standards. Organizations must prioritize data governance to maintain trust and integrity in their analytics processes. As Patrick LeBlanc, Principal Program Manager, emphasizes, “We highly value your feedback, so please share your thoughts using the feedback forum,” highlighting the significance of community input in shaping BI developments.
Understanding how to efficiently combine BI with Microsoft Fabric enables companies to enhance their analytics capabilities, ultimately leading to improved business results. As information accessibility trends evolve in 2025, staying informed about the latest advancements in BI and Microsoft Fabric integration will be essential for maintaining a competitive advantage.
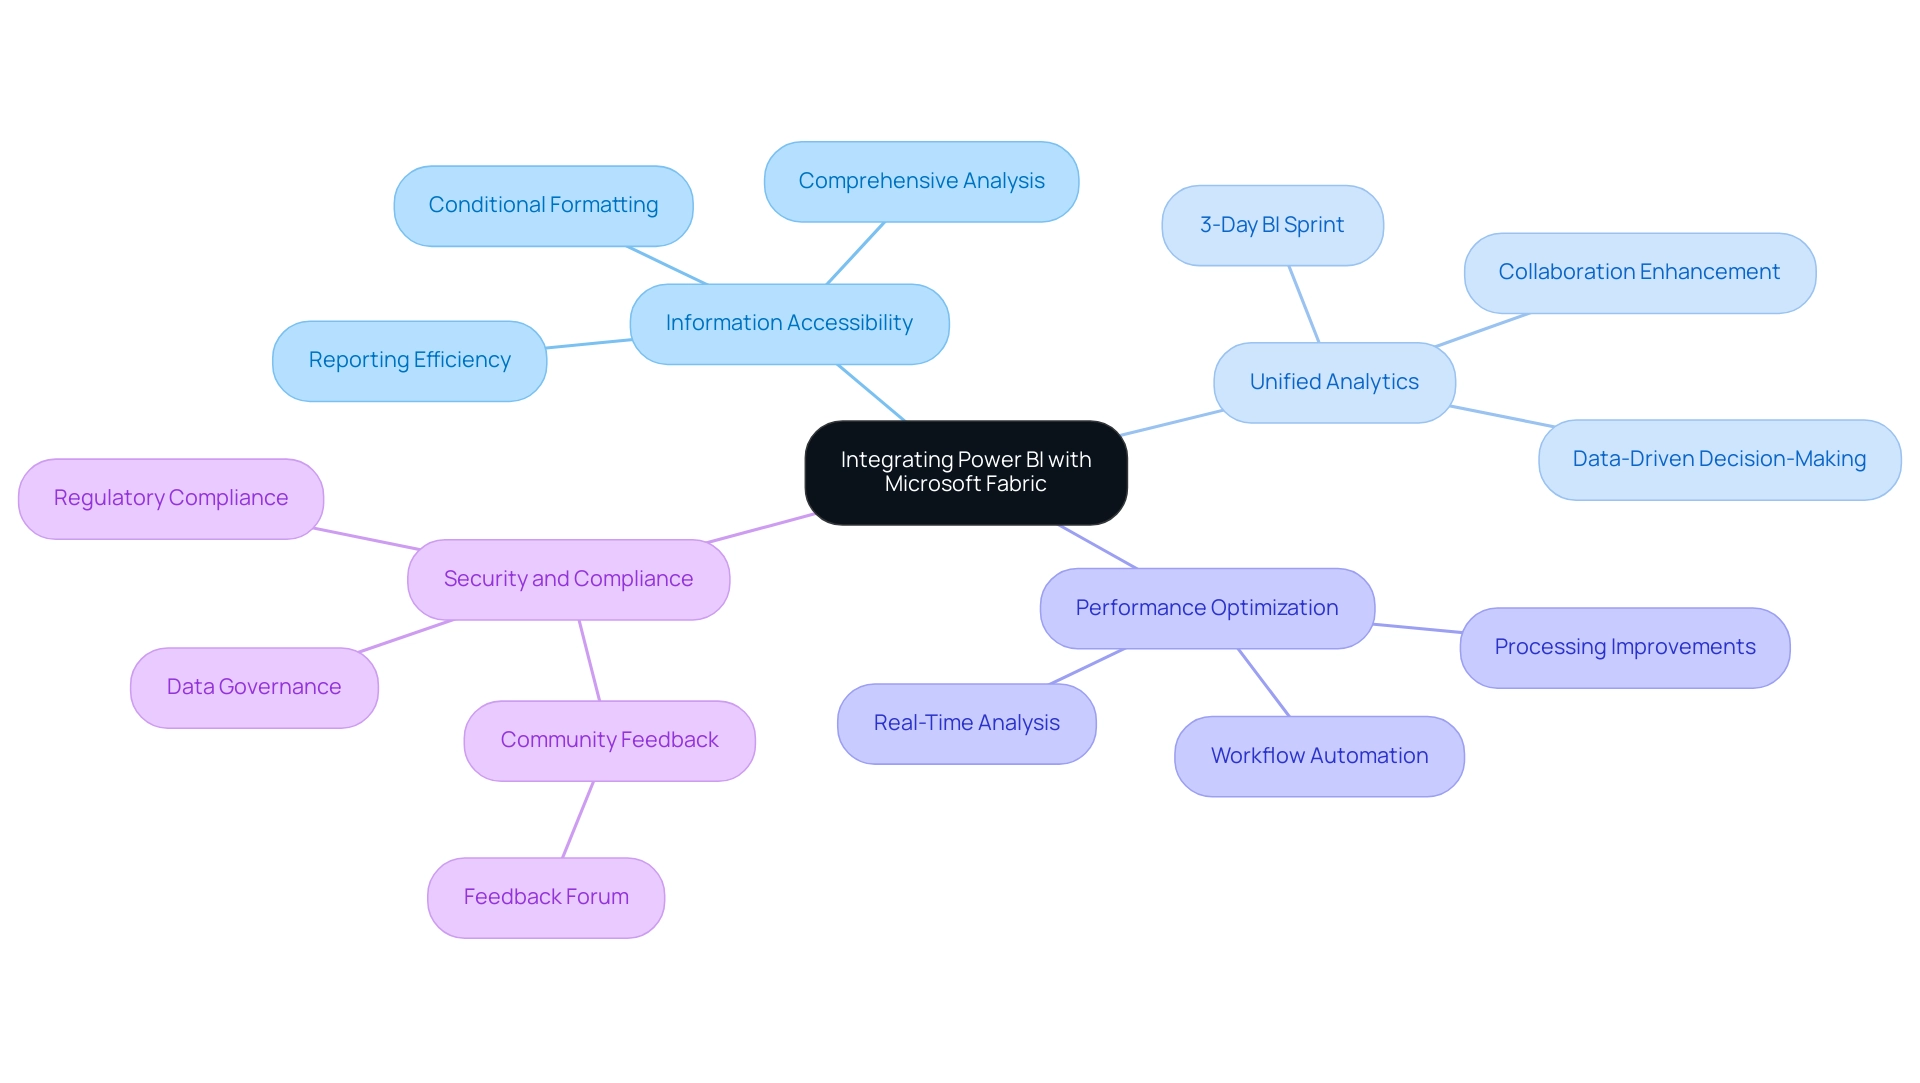
Best Practices for Optimizing Performance in Power BI Embedded
To achieve optimal performance in Power BI Embedded and effectively leverage insights, organizations must adopt the following best practices:
-
Optimize Information Models: Streamlining information models is crucial. Remove unnecessary columns and tables to simplify the structure, which not only reduces complexity but also enhances performance. A well-optimized information model can lead to significant improvements in report load times, addressing the common challenge of time-consuming report creation.
-
Use Aggregated Data: Implementing aggregated tables can dramatically speed up query performance. By condensing information at a higher level, entities can lessen the burden on foundational sources, leading to quicker response times for individuals and reducing inconsistencies across reports.
-
Limit Visuals: Reducing the number of visuals on a report page is essential. Each visual generates queries to the dataset, so minimizing visuals can decrease the overall number of queries, thereby enhancing load times. This practice is especially effective in enhancing the initial view load time, which can decrease from around 30 seconds to merely 3 seconds after optimization, ensuring stakeholders receive clear, actionable insights from the information presented.
-
Monitor Performance: Regularly utilizing tools like Performance Analyzer is vital for identifying bottlenecks within reports. By analyzing performance metrics, organizations can identify slow queries and optimize them, ensuring a smoother user experience and fostering trust in the information.
-
Implement Caching: Caching strategies can significantly enhance performance by storing frequently accessed information. This reduces the need for repeated queries to the data source, allowing for quicker access to information and enhancing overall efficiency, which is essential for driving data-driven insights.
A compelling case study involving a ride-sharing company illustrates the impact of these practices. Initially, their BI dataset, which contained 100 million trip records, had a .pbix file size of approximately 1.2 GB and an in-memory size of around 4 GB. After optimization, the model size was reduced to about 400 MB, resulting in a 10-20x improvement in report performance and a decrease in refresh times from over 2 hours to just 5 minutes.
Such optimizations not only enhance performance but also increase user satisfaction and confidence in utilizing BI for large datasets.
As Utpal Kar notes, “By isolating gateways, you can boost performance and utilization of resources,” which underscores the importance of strategic resource management in achieving optimal performance.
By applying these best practices, along with a strong governance strategy to ensure data consistency, companies can significantly improve the performance of their solutions using Power BI Embedded capacity, driving growth and innovation in their data-driven initiatives. Creatum GmbH is dedicated to assisting entities in navigating these challenges effectively.
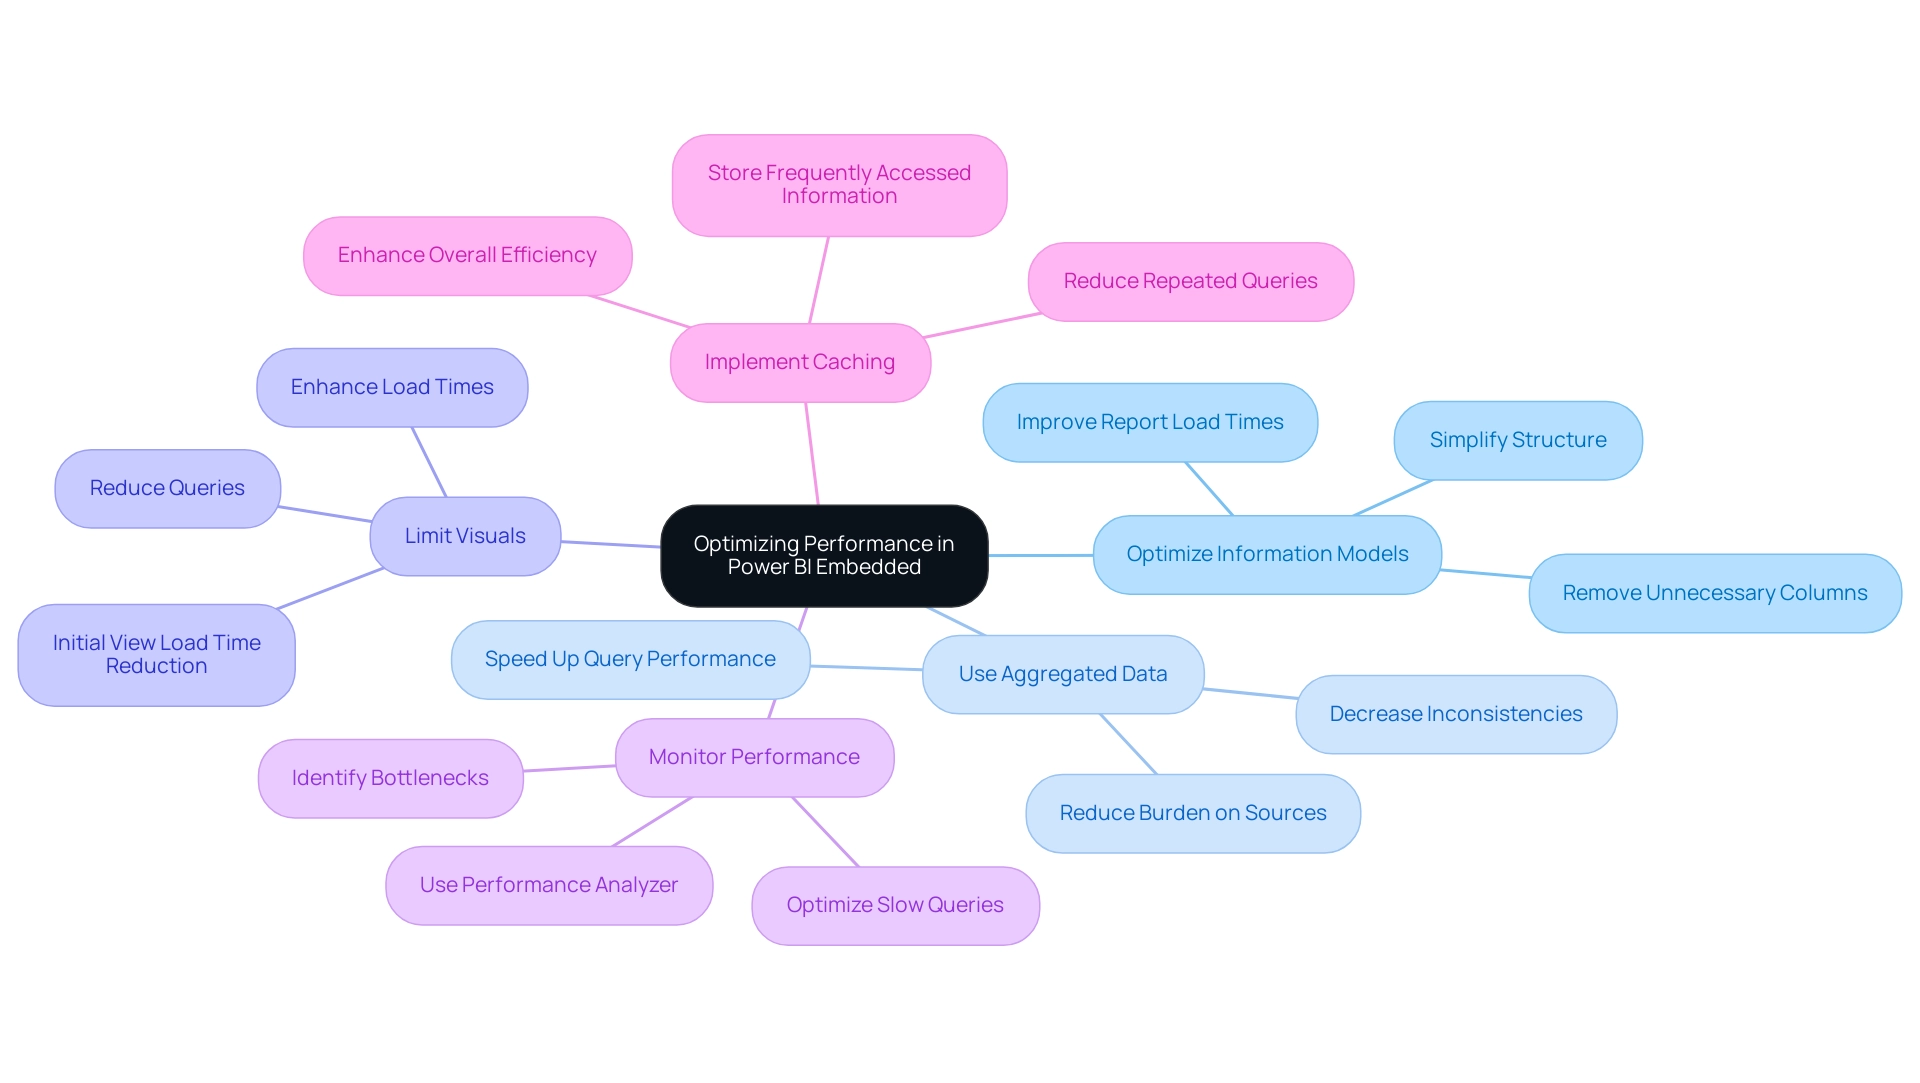
Monitoring Usage: Analyzing Power BI Embedded Performance
Tracking usage in BI Embedded is essential for enhancing performance metrics and understanding user interactions. Effective strategies for this process include:
-
Utilizing Usage Metrics: BI provides integrated usage metrics that empower organizations to monitor engagement effectively. By analyzing these metrics, teams can identify which reports and dashboards are most popular, facilitating data-driven decisions regarding content prioritization. A recent BI report visualizing report usage data exemplifies this, assisting individuals in pinpointing underutilized reports that may be considered ‘dead wood,’ thus guiding content enhancement efforts. This focus is particularly crucial in addressing the common challenge of investing more time in constructing reports than in leveraging insights from Power BI dashboards.
-
Setting Up Alerts: Proactive management is vital. Establishing alerts for key performance metrics enables organizations to address potential issues before they impact user experience. This approach not only enhances system reliability but also builds user trust in the platform, countering confusion and mistrust that can arise from inconsistencies across various reports. A lack of governance strategy can exacerbate these inconsistencies, making it essential to establish clear guidelines for data management.
-
Analyzing Resource Utilization: Monitoring resource utilization metrics is crucial for ensuring that capacity is used efficiently. By regularly reviewing these metrics, companies can identify areas for scaling and optimization, ultimately leading to improved performance and cost-effectiveness. This aligns with the need for actionable guidance often missing in reports filled with numbers and graphs. Failing to extract meaningful insights can place entities at a competitive disadvantage, underscoring the importance of effective monitoring strategies.
-
Feedback Systems: Establishing feedback systems allows organizations to gather input on performance and usability. This feedback is invaluable for informing future optimizations and ensuring that the Power BI Embedded environment effectively meets its audience’s needs, thus driving growth and innovation through data-driven insights.
Recent developments underscore the significance of these strategies. For example, organizations operating in national or regional clouds have encountered challenges regarding the availability of usage metrics due to local regulations. By recognizing these limitations, they can better inform users about the implications for service delivery and information access, which is crucial for effective monitoring strategies.
Additionally, while the BI API offers endpoints for obtaining activity information, it is limited to the previous 30 days. This limitation highlights the importance of utilizing PowerShell code, which can extend the view to a historical perspective of up to 12 months, providing deeper insights into usage trends. As lbendlin, a Super User, noted, “You can edit the usage report and include the information from the other reports as well,” emphasizing the flexibility and importance of customizing reports for enhanced insights.
By effectively monitoring usage, organizations like Creatum GmbH can make informed decisions that enhance their BI Embedded implementations, driving user engagement and maximizing the value derived from their data analytics efforts.
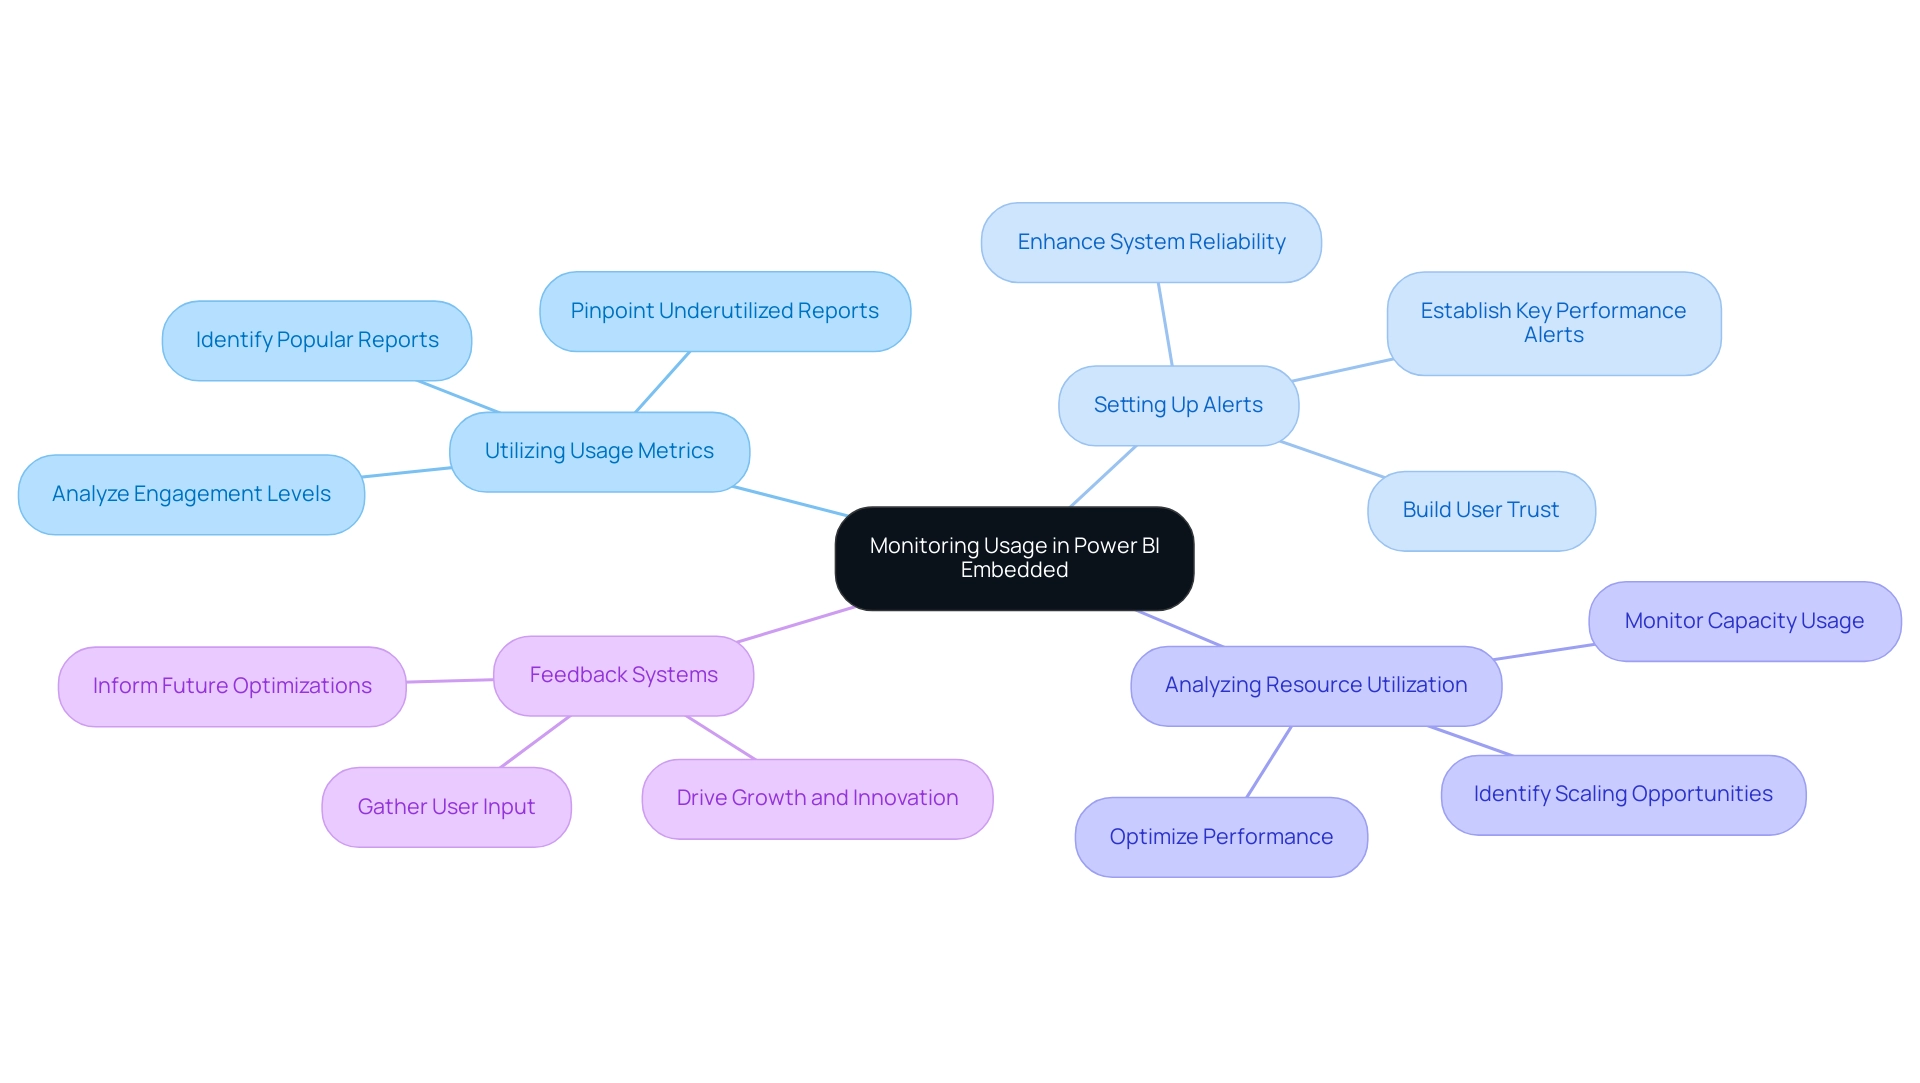
Overcoming Challenges in Power BI Embedded Implementation
Organizations frequently face several challenges during the implementation of BI Embedded, which can impede their overall success. Proactively addressing these challenges is essential for maximizing the benefits of this powerful analytics tool.
-
Resistance to Change: Employee resistance to new technologies remains a significant barrier, with studies indicating that up to 70% of change initiatives fail due to this resistance. However, adopting technologies like BI can lead to substantial career growth opportunities. A BI-certified professional will have numerous opportunities to advance and prosper in their career. To reduce resistance, organizations should invest in comprehensive training programs that not only inform employees about BI Embedded but also emphasize its benefits, such as enhanced visualization and decision-making abilities. Furthermore, integrating Robotic Process Automation (RPA) can streamline workflows, further demonstrating the value of embracing new technologies. This is crucial, as manual, repetitive tasks can significantly slow down operations, leading to wasted time and resources.
-
Information Integration Issues: The complexity of combining information from diverse sources can pose significant challenges. For instance, despite providing strong security features, Power BI has limitations in information security, such as the inability to implement row-level security on Excel sources. This raises concerns about report editing and collaboration. Establishing robust information governance policies is crucial, as is employing effective ETL (Extract, Transform, Load) processes. Leveraging Business Intelligence tools can enhance data integration efforts, ensuring that individuals have access to accurate and timely information, which is vital for informed decision-making. Not utilizing BI effectively can leave organizations at a competitive disadvantage.
-
Performance Bottlenecks: Insufficient capacity planning can result in performance bottlenecks, affecting the experience of individuals. Organizations should conduct regular evaluations of their capacity needs, adjusting resources as necessary to accommodate increasing data demands and participant activity. This proactive approach can help maintain optimal performance levels, ensuring that the implementation of Power BI Embedded Capacity supports operational efficiency.
-
Ensuring comfort with the new system is vital for successful implementation. Providing ongoing support, including access to resources and a dedicated helpdesk, can facilitate smoother transitions. Real-world examples demonstrate that entities emphasizing engagement and feedback during the launch of BI Embedded experience considerably higher adoption rates. As Justyna, a PMO Manager, emphasizes, “I want to schedule a free, 30-minute technical discovery session. No sales pitch guaranteed.” This highlights the importance of technical discovery sessions in overcoming user adoption challenges and illustrates how tailored AI solutions can address specific business needs.
By tackling these challenges directly, entities can significantly enhance the effectiveness of their Power BI Embedded capacity implementations, leading to improved operational efficiency and data-driven decision-making. Furthermore, staying abreast of trends in embedded analytics, particularly the integration of AI and machine learning, can provide organizations with deeper insights for a competitive advantage. Creatum GmbH is committed to helping businesses navigate these challenges effectively.
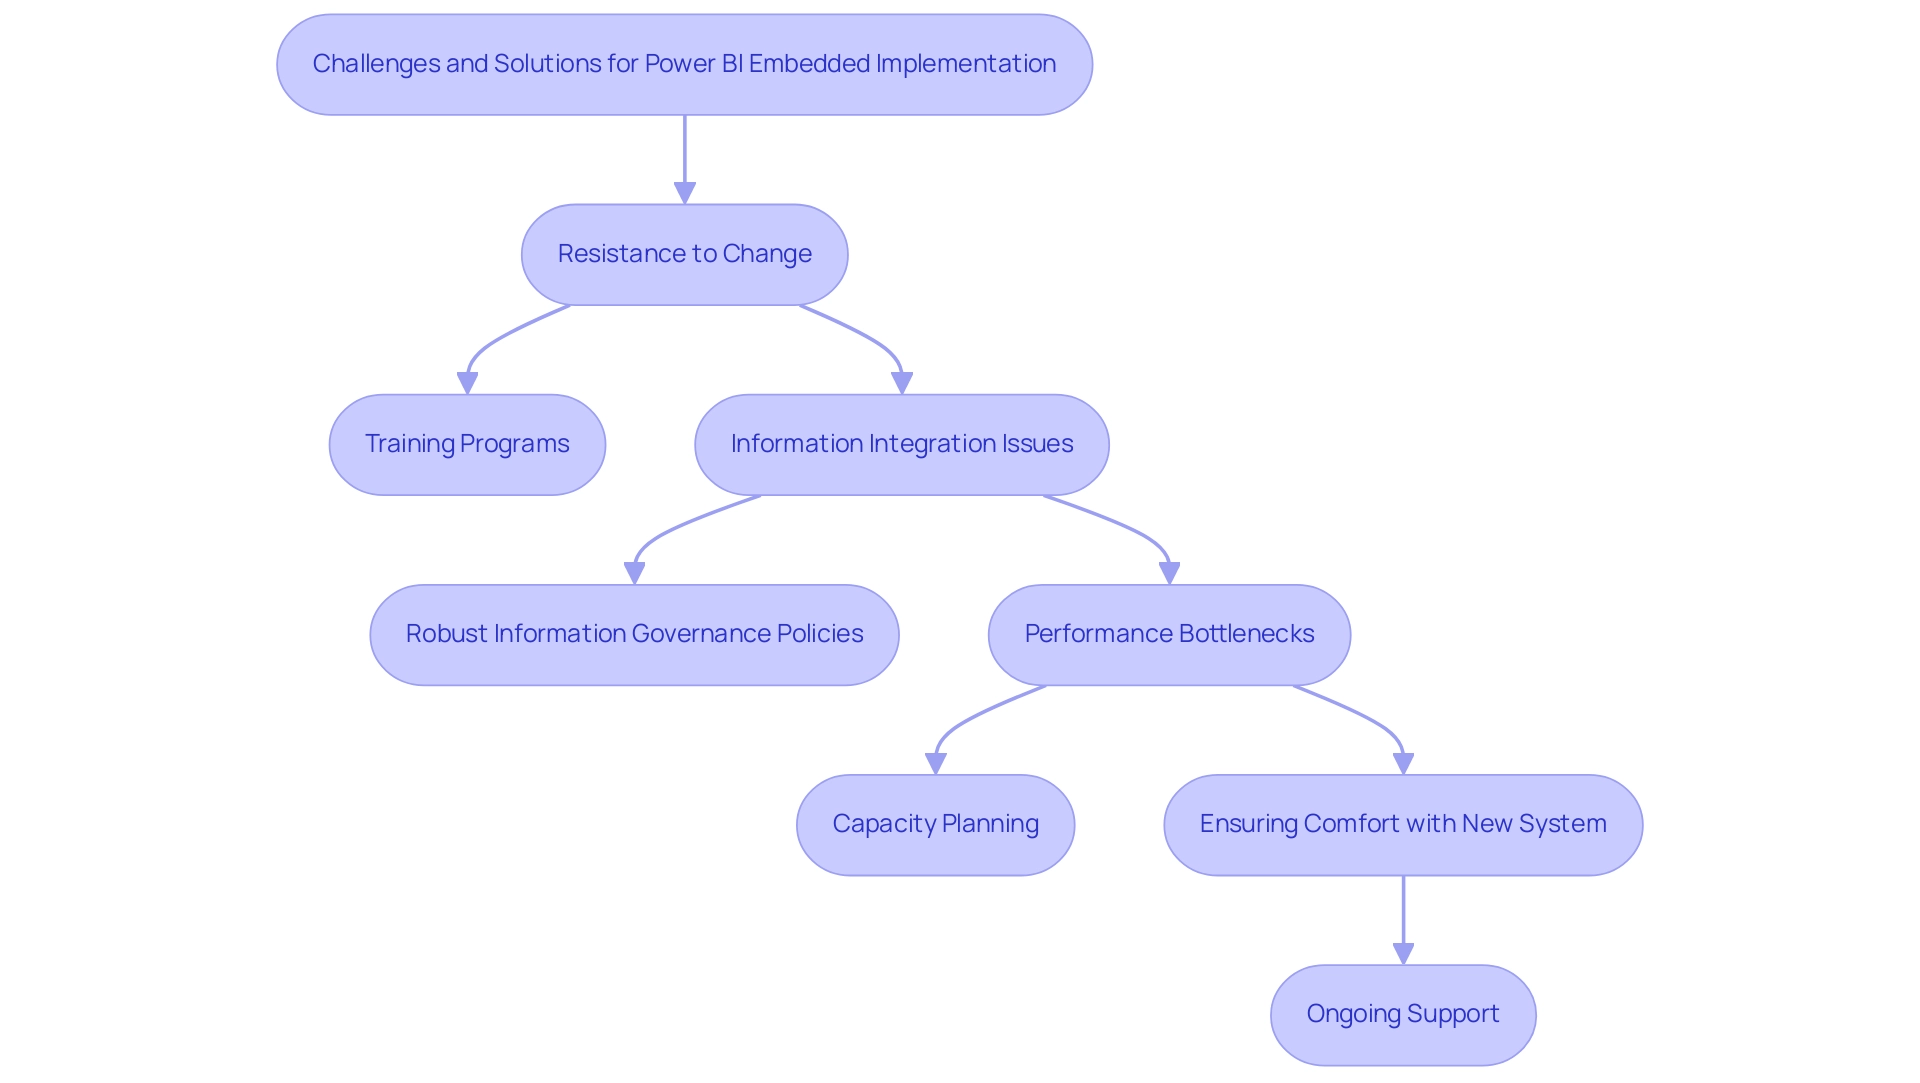
Conclusion
The exploration of Power BI Embedded underscores its vital role in enhancing organizational analytics and decision-making capabilities. Understanding the architecture of Power BI Embedded Capacity allows organizations to optimize performance and allocate resources effectively based on user demand and data complexity. Key considerations—such as user load, data volume, performance testing, and scaling options—are essential for effective capacity planning, enabling businesses to adapt to evolving analytics needs.
Navigating the licensing landscape is equally crucial; the choice between capacity-based and user-based models can significantly impact cost-effectiveness. Organizations must assess their usage patterns and compliance requirements to make informed decisions that align with operational goals. Additionally, leveraging features like incremental refresh and integrating Power BI with Microsoft Fabric can streamline data management processes, thereby enhancing the overall effectiveness of analytics efforts.
Implementing best practices for performance optimization—such as refining data models and monitoring usage—can lead to substantial improvements in report performance and user satisfaction. By addressing common challenges like resistance to change and data integration issues, organizations can cultivate a data-driven culture that empowers users to fully harness the potential of Power BI Embedded.
As the analytics landscape evolves, staying informed about best practices and emerging trends is key to maintaining a competitive edge. Power BI Embedded not only facilitates enhanced reporting capabilities but also acts as a catalyst for informed decision-making, driving growth and innovation in organizations ready to embrace its capabilities.
Frequently Asked Questions
What is Power BI Embedded Capacity?
Power BI Embedded Capacity represents the dedicated resources necessary for executing BI reports and dashboards within applications, allowing organizations to integrate analytics seamlessly without requiring separate BI licenses.
Why is understanding Power BI Embedded Capacity important?
Understanding the structure of Power BI Embedded Capacity is crucial for enhancing performance and ensuring that resources are allocated effectively based on user demand and the complexity of the information being processed.
What significant change is expected by 2025 regarding BI content management?
By 2025, all BI content will be managed within workspaces in Microsoft Fabric, which will significantly enhance collaboration and data management.
How does Power BI Embedded Capacity facilitate scaling?
The architecture of Power BI Embedded Capacity allows organizations to efficiently scale, adapting to varying workloads while maintaining optimal performance.
What is the role of Inforiver Analytics+ in relation to Power BI?
Inforiver Analytics+ serves as a migration partner for enterprises transitioning from legacy BI platforms to modern BI solutions, streamlining the migration process and enhancing visualization capabilities.
What trends are emerging regarding Power BI Embedded Capacity?
There is a growing reliance on Power BI Embedded Capacity as companies recognize the importance of customized analytics for decision-making processes in a data-rich environment.
What are key factors for effective planning of Power BI Embedded Capacity?
Key factors include load estimation, data volume analysis, performance testing, and utilizing scaling options to ensure optimal performance and a seamless user experience.
What is the importance of load estimation in capacity planning?
Accurately estimating the number of simultaneous users accessing reports and dashboards helps determine the necessary capacity to support user demands without compromising performance.
How can organizations ensure efficient data processing?
Organizations should analyze dataset size and complexity to ensure that the allocated capacity can effectively manage processing, preventing delays that could hinder decision-making.
What is the benefit of conducting performance testing?
Conducting load testing helps identify potential performance issues by mimicking participant interactions prior to launch, allowing organizations to resolve bottlenecks and improve system dependability.
How can Azure’s scaling features assist organizations?
Azure’s scaling features allow organizations to modify capacity dynamically based on real-time usage patterns, which is especially beneficial during peak usage periods to ensure optimal performance.
What role do custom visuals play in Power BI?
Custom visuals in Power BI enable high personalization and customization, allowing analysts to create tailored visual representations that meet specific business needs, thus enhancing the overall user experience.
What recognition has Power BI received in the analytics landscape?
Power BI was recognized as the ‘Embedded Analytics Solution of the Year’ at the ’24 Breakthrough Awards,’ highlighting its value in the analytics field.
What is essential for effective data integration in capacity planning?
Creating a ‘Date Table’ and establishing relationships is essential for effective data integration, which is a key component of capacity planning.
Overview
Mastering AI LLM commercial use requires a deep understanding of Microsoft’s strategic integration of AI technologies, aimed at enhancing business operations and productivity. Microsoft’s substantial investments in AI, such as the Azure OpenAI Service, exemplify this commitment. This service has successfully streamlined processes for various organizations, showcasing the effectiveness of AI in driving innovation and efficiency across sectors.
How can your organization leverage these advancements to transform its operations? Embracing such technologies may hold the key to staying competitive in an evolving market.
Introduction
In the rapidly evolving landscape of artificial intelligence, generative AI and Large Language Models (LLMs) are not merely buzzwords; they are redefining how businesses operate and engage with their customers. This significant shift towards automation and intelligent content generation enables organizations to enhance productivity and streamline operations.
With the generative AI market projected for substantial growth, understanding its implications on content ownership, copyright considerations, and strategic integration becomes imperative. Companies aiming to leverage these innovations effectively must navigate this new terrain.
Microsoft, among others, is leading the charge in AI integration, revealing vast potential for improved operational efficiency and innovation.
This article delves into the transformative power of generative AI, exploring its applications, challenges, and the future it holds for organizations across various sectors.
Understanding Generative AI and Large Language Models (LLMs)
Generative AI represents a sophisticated class of artificial intelligence capable of producing new content—ranging from text and images to audio—based on extensive training data. Within this domain, Large Language Models (LLMs) emerge as a specialized subset designed to comprehend and generate human-like text. Notable examples include GPT-3 and its successors, which leverage advanced deep learning techniques to process and analyze vast datasets of text.
This capability empowers LLMs to generate coherent, contextually appropriate responses, positioning them as invaluable tools for commercial applications, particularly in enhancing business operations and driving productivity through automation.
Looking ahead, the generative AI market is projected to experience significant growth by 2025, fueled by an increasing demand for intelligent automation across various sectors. The global AI market is expected to reach approximately 184 billion U.S. dollars, reflecting a robust trend towards integrating AI solutions for improved efficiency and cost reduction. Notably, content creation and the classification of customer interactions are emerging as leading use cases for generative AI in call centers, showcasing its potential to transform customer engagement strategies and streamline workflows through Robotic Process Automation (RPA).
As Bernard Marr observes, “The staggering investment levels, impressive ROI reports, and accelerating adoption rates signal a technology crossing the threshold from emerging to essential.” This perspective underscores the critical role of generative AI and RPA in contemporary practices. Additionally, the growth of the Generative AI market is influenced by macroeconomic factors, including technological advancements and government support, which foster a favorable environment for AI adoption.
Recent advancements in LLMs have further solidified their role in enhancing organizational efficiency. Companies increasingly adopt these technologies to streamline workflows, reduce operational errors, and allow teams to focus on strategic initiatives. Successful implementations of LLMs in enterprises demonstrate their effectiveness in driving innovation and growth, particularly in data-rich environments.
By utilizing customized AI solutions from Creatum GmbH and Business Intelligence, organizations can transform raw data into actionable insights, enabling informed decision-making that propels growth.
Understanding the mechanics of generative AI and LLMs is essential for organizations aiming to leverage these technologies. As the landscape evolves, staying informed about current trends and expert opinions will be crucial for maximizing the benefits of generative AI, ensuring organizations navigate the complexities of AI adoption effectively while replacing outdated systems with innovative solutions. Furthermore, Creatum GmbH offers GenAI workshops that provide hands-on training and custom GPT creation, addressing the challenges organizations face in implementing AI solutions.
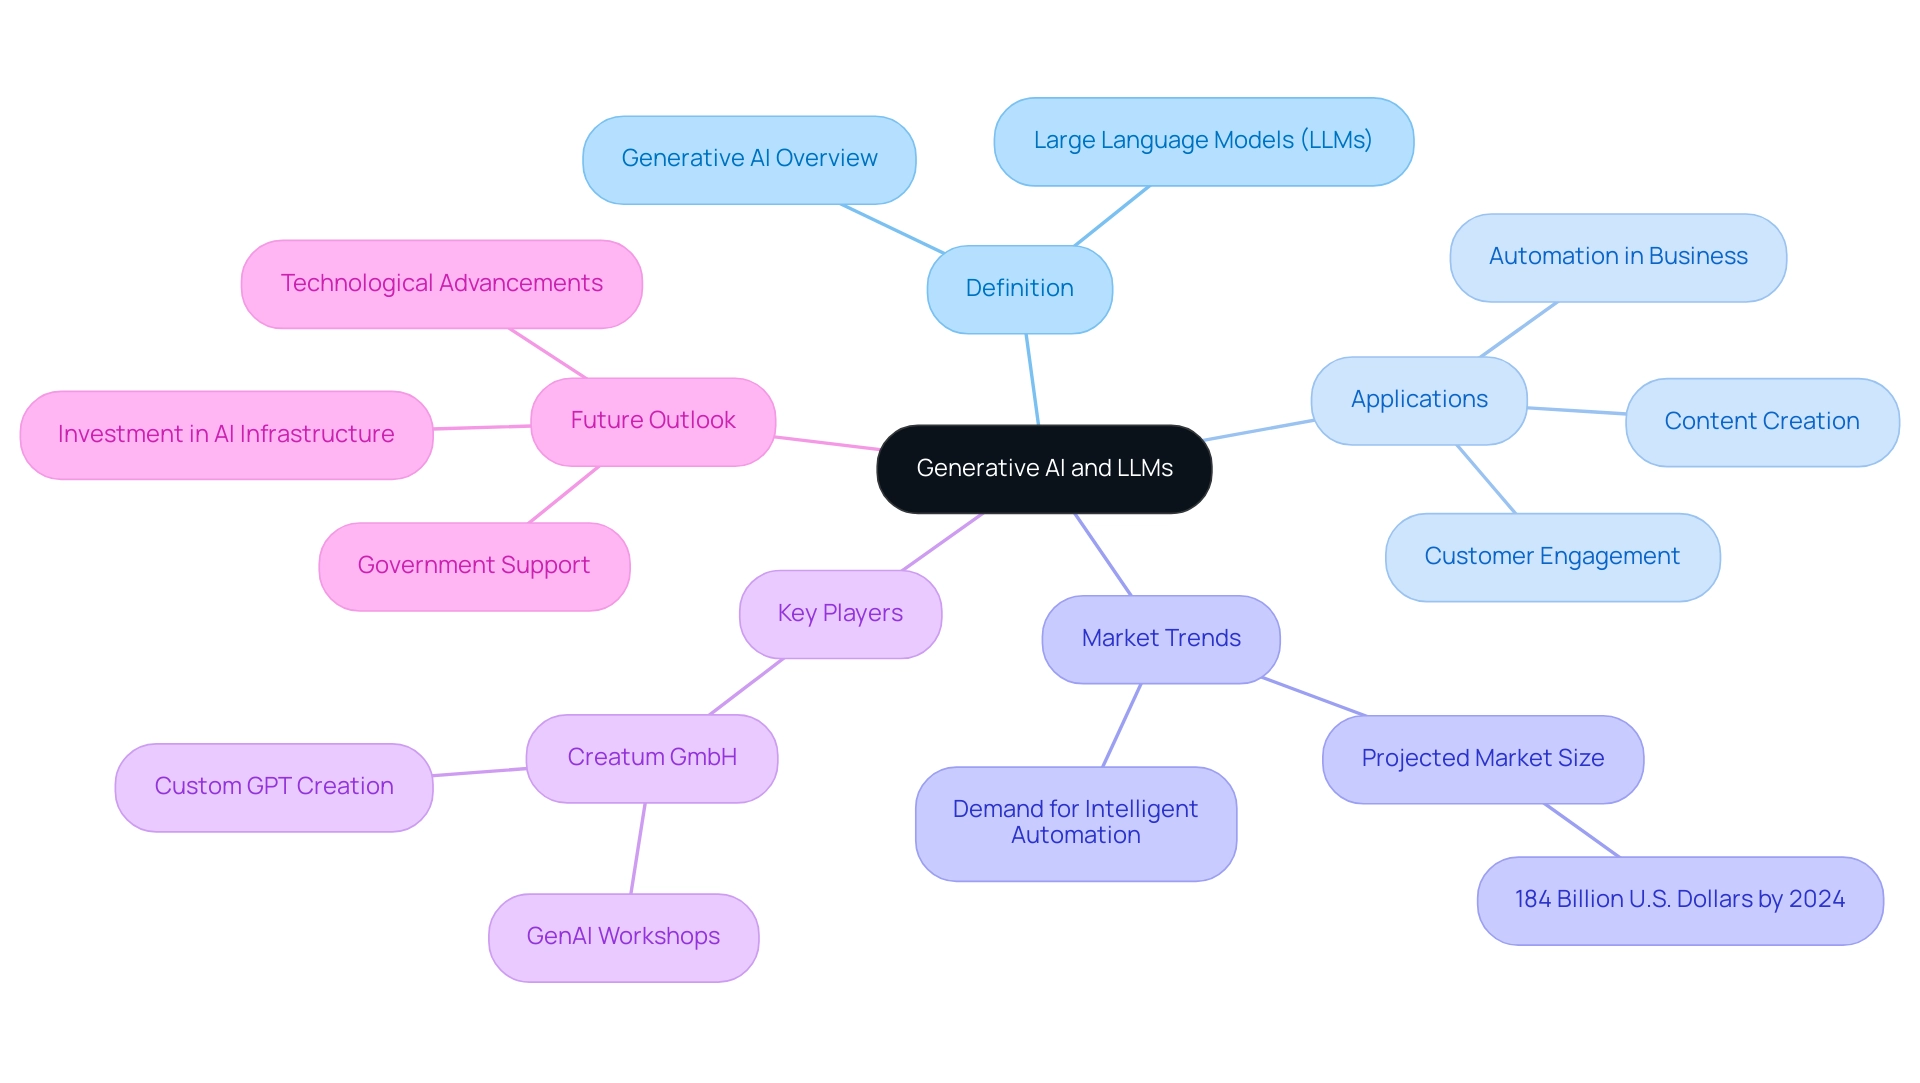
Navigating Content Ownership in AI Creations
As generative AI becomes increasingly integrated into organizational operations, the issue of ownership of material produced by these systems has emerged as a critical concern. Legal frameworks in many jurisdictions are still evolving to keep pace with these technological advancements, resulting in considerable ambiguity. Typically, the user who prompts the AI retains rights to the output; however, this can vary significantly based on the specific terms of service established by the AI provider.
To navigate this complex landscape effectively, companies must proactively establish clear policies regarding ownership. This is essential not only to mitigate potential disputes but also to ensure compliance with existing intellectual property laws. Recent statistics reveal that 30% of business owners expect AI to generate website copy for their companies, underscoring the growing reliance on AI-generated material.
Yet, with this reliance comes the risk of ownership disputes, which are anticipated to rise as more organizations adopt these technologies. Legal opinions on AI ownership rights are gaining prominence, particularly as existing frameworks struggle to address the nuances of AI-generated works. For instance, a recent case study titled ‘Modifying AI-Generated Material for Copyright‘ indicated that while wholly AI-generated works lack copyright protection, modifications made by humans can meet originality standards, potentially allowing for copyright claims on those contributions. This highlights the importance of human involvement in the creative process to secure ownership rights.
As Zach Lewis aptly noted, “AI hasn’t turned copyright law on its head. At least not yet.”
Moreover, statistics indicate that 41% anticipate AI being utilized to rectify coding mistakes efficiently, further demonstrating AI’s capabilities and significance in generation. Additionally, 64% assert that the primary purpose of AI is to assist, enhance, and empower consumers, reinforcing the narrative surrounding AI’s role in operational activities.
In this context, our AI-based junior consultant, Hayley, is equipped to provide tailored insights to help organizations navigate these challenges effectively. Hayley can assist in developing clear policies regarding ownership of materials and understanding the legal implications of AI-generated works. As we progress through 2025, it is essential for companies to remain vigilant about the evolving legal landscape concerning AI-generated material.
Establishing robust policies and comprehending the implications of content ownership will be crucial for leveraging AI technologies effectively while safeguarding intellectual property rights. We invite you to engage with Hayley to explore how our tailored AI solutions at Creatum GmbH can support your organization in navigating these complexities.
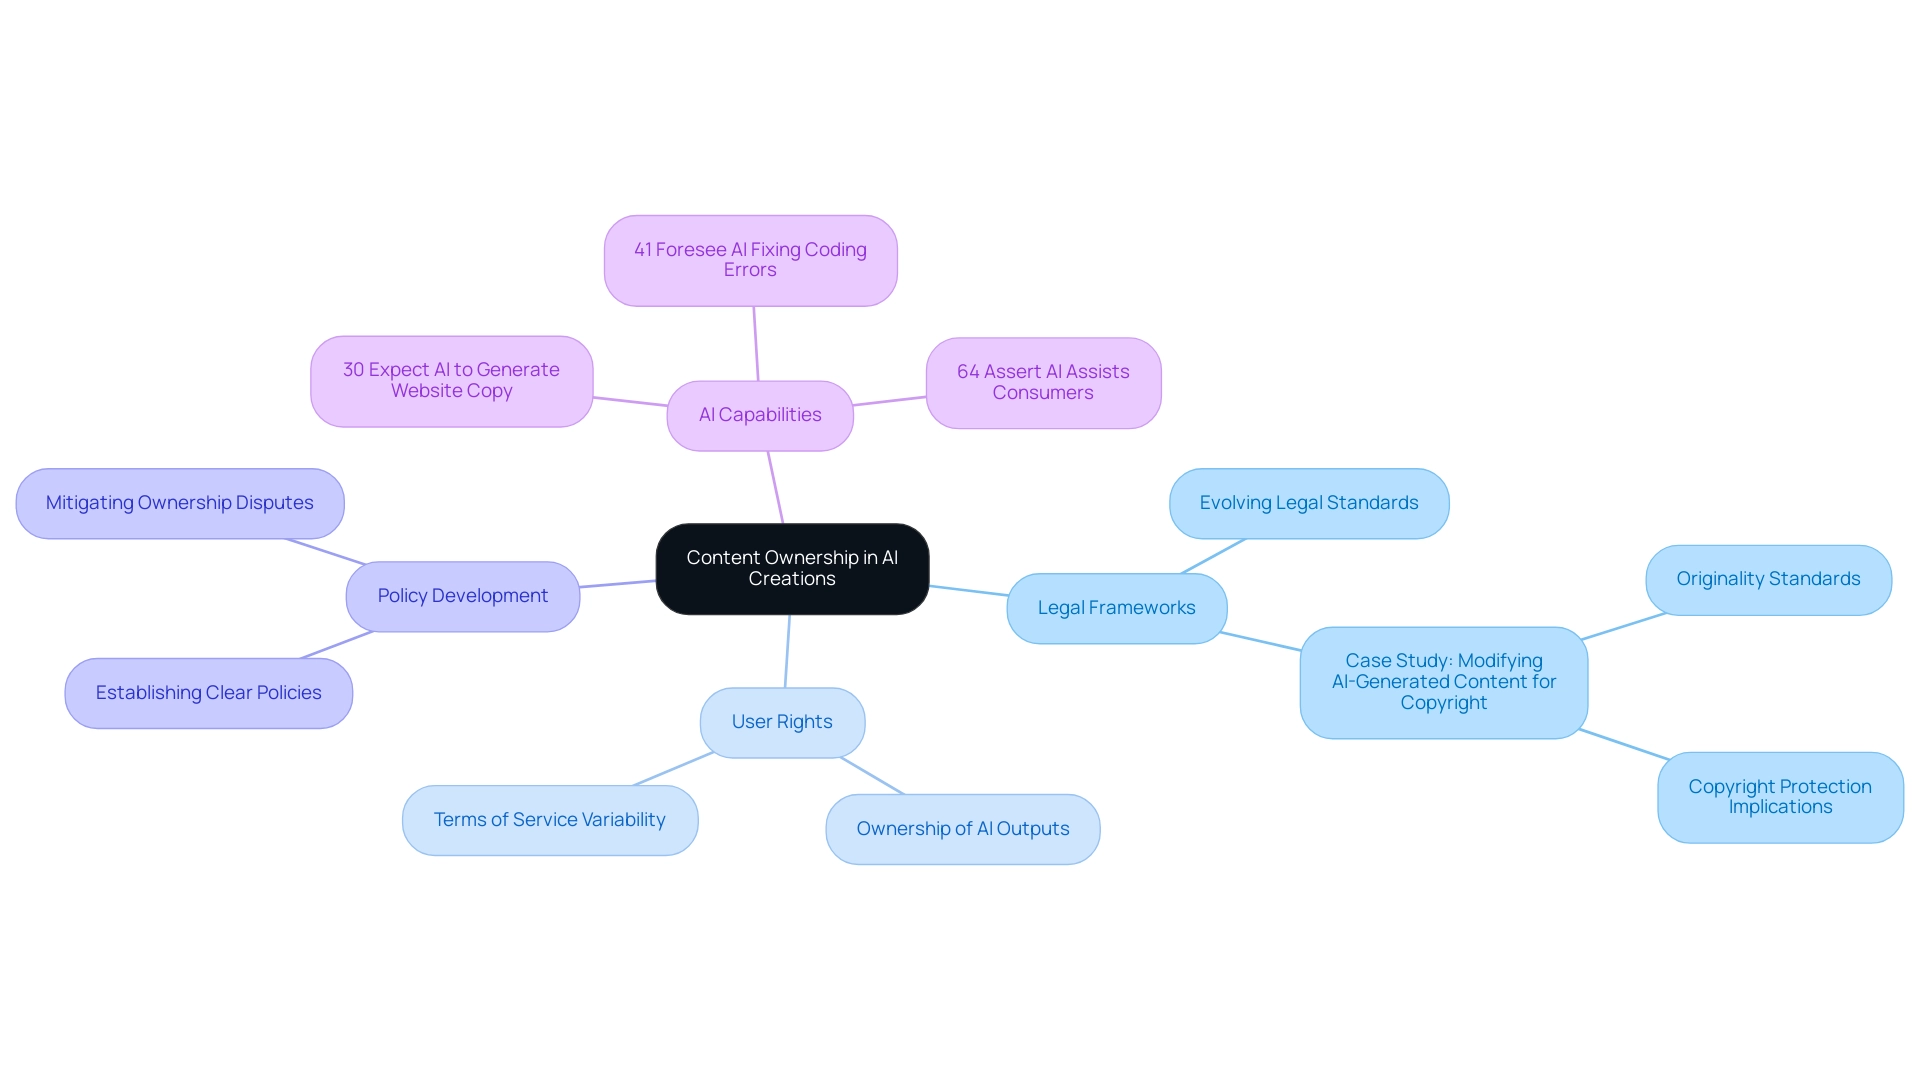
Copyright Considerations for Generative AI Usage
Copyright law presents significant challenges for enterprises leveraging generative AI technologies. As of 2025, existing regulations typically do not recognize AI-generated works as copyrightable unless substantial human involvement is evident in their creation. This creates a precarious landscape for companies utilizing generative AI, compelling them to navigate the risks of infringing on existing copyrights.
To mitigate these risks, companies should conduct thorough audits of their AI-generated materials and seek expert legal advice to ensure compliance with copyright regulations.
Recent statistics reveal that half of enterprise owners expect AI to enhance their decision-making processes, underscoring the growing reliance on AI technologies. However, this reliance brings with it the responsibility to comprehend the legal implications. For instance, the Copyright Office’s AI Initiative, launched in early 2023, explored the intersection of copyright and AI, gathering insights from over 10,000 public comments.
The findings emphasized the importance of human creativity in copyright law, leading to suggestions for future legislation that addresses the unique challenges posed by AI-generated material. This initiative serves as a crucial learning point for organizations navigating copyright laws, highlighting the necessity of human oversight in AI-generated works.
Moreover, entities must remain cognizant of the copyright challenges associated with generative AI. A notable case study involves companies that have successfully navigated these complexities by establishing clear guidelines for AI usage and ensuring that their creation processes incorporate significant human oversight. As generative AI continues to evolve, staying informed about current legal precedents and actively engaging with legal experts will be essential for organizations aiming to harness the benefits of AI while remaining compliant with copyright laws.
Furthermore, with the integration of Robotic Process Automation (RPA) and customized AI solutions, organizations can enhance operational efficiency, automate repetitive tasks, and ensure that their AI-generated materials deliver genuine value. By 2028, it is projected that 20% of repetitive processes will be automated through domain-specific Generative AI implementations, further underscoring the need for organizations to adapt to these changes while maintaining compliance. As the Course Creator aptly noted, while embracing AI technology is crucial, it is equally important to avoid perceptions of laziness or unreliability by ensuring that AI-generated content is strategically aligned with organizational goals.
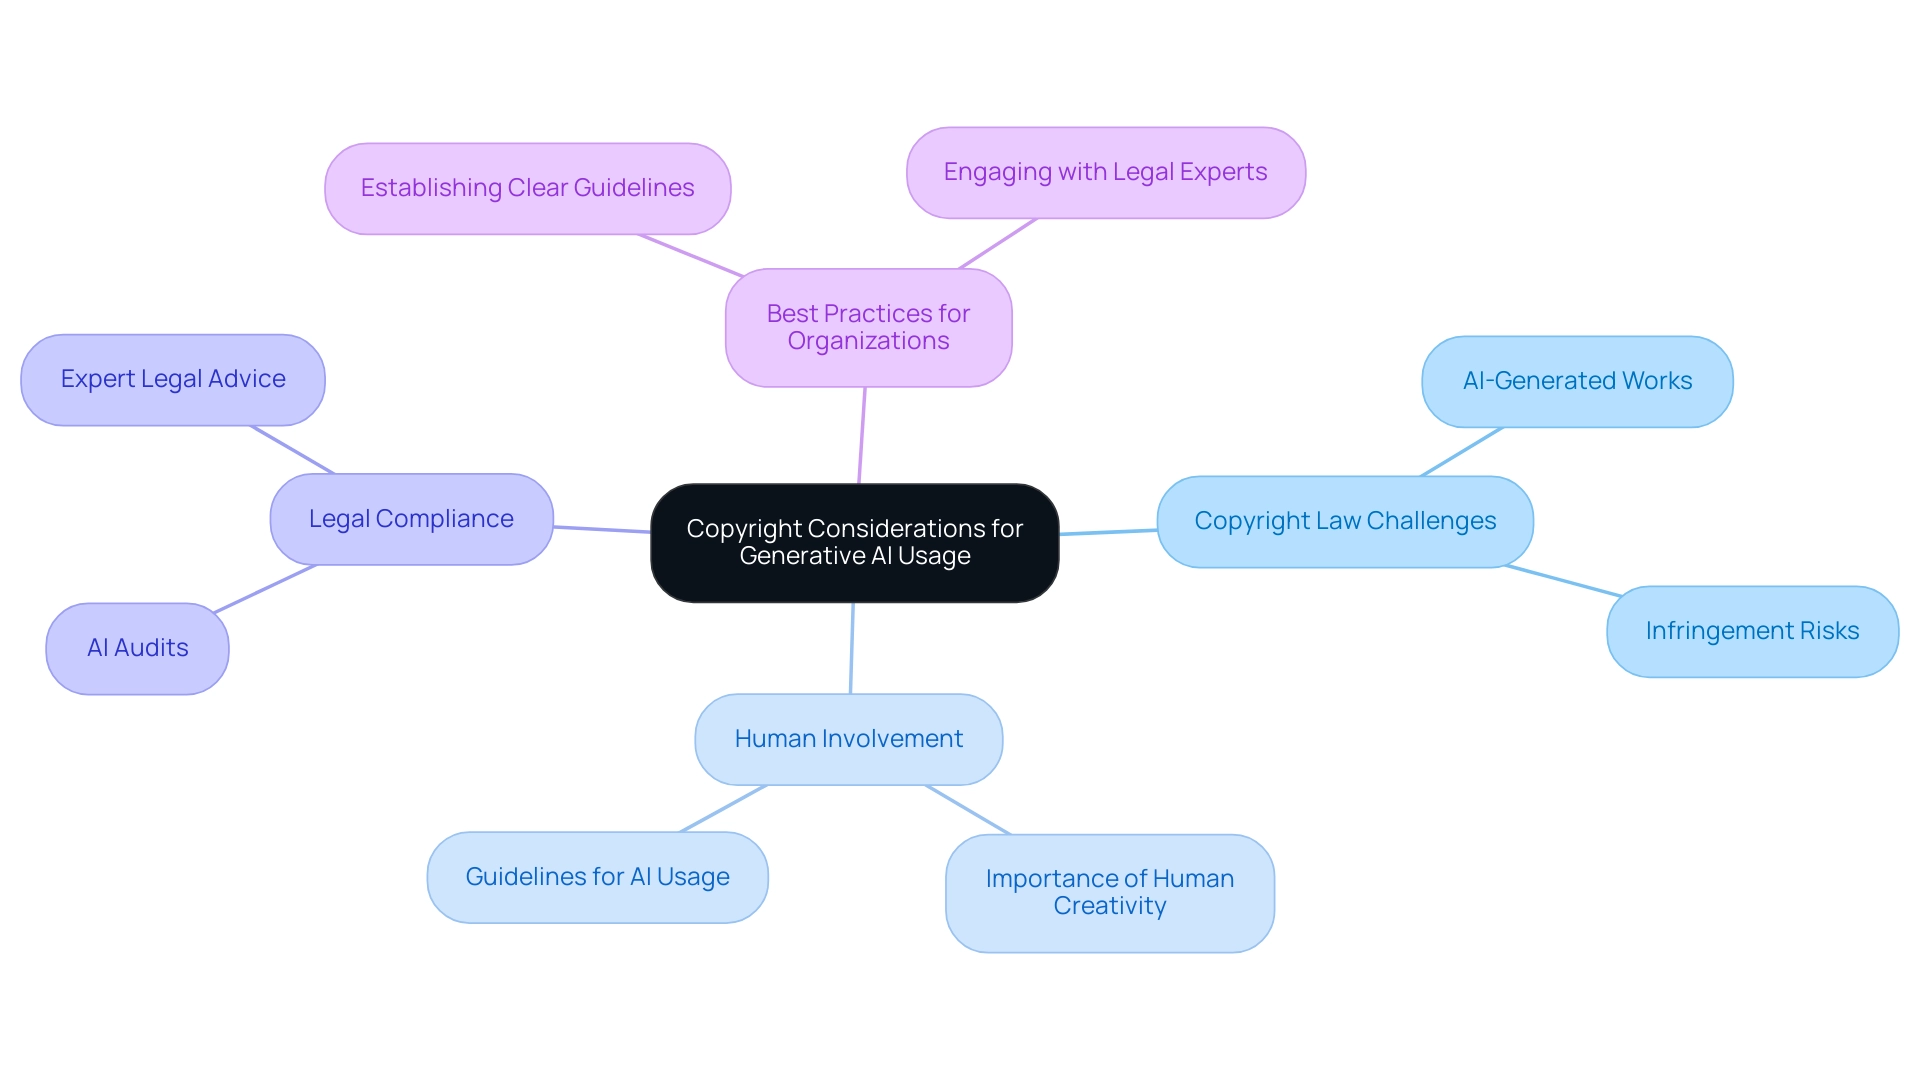
Microsoft’s Strategic Integration of AI in Business
Microsoft has firmly established itself as a frontrunner in AI integration, with substantial investments in AI technologies and platforms projected to exceed $20 billion by 2025. The Azure OpenAI Service stands out as a pivotal offering, granting organizations access to advanced AI models that significantly enhance productivity and streamline operations. By seamlessly integrating AI capabilities into widely utilized products such as Microsoft 365, the company empowers organizations to automate repetitive tasks, improve decision-making processes, and foster innovation across various sectors.
Recent developments underscore this commitment. Organizations like Zakladni Skola As Hlavkova have successfully adopted Microsoft 365 Copilot, leading to a remarkable 60% improvement in administrative document handling. They noted, “adopted Microsoft 365 Copilot and saw a 60% improvement in handling administrative documents, decreased lesson preparation from hours to a few minutes, increased inclusivity and enhanced communication with students and parents.” This integration has notably reduced lesson preparation time from hours to mere minutes, showcasing the tangible benefits of AI in educational settings.
Similarly, Vodafone Group has achieved a 70% resolution rate for customer inquiries through digital channels, illustrating how Microsoft’s AI solutions enhance customer service by streamlining interactions and improving response times.
The market share of Microsoft Azure OpenAI Service is expected to expand considerably by 2025, reflecting the growing interest in AI commercial use among companies aiming to leverage AI for operational effectiveness. Case studies, such as ZF Group’s implementation of over 25,000 applications on the Power Platform, reveal substantial operational improvements, with 37,000 unique active users benefiting from streamlined processes. This demonstrates the effectiveness of Microsoft’s solutions in real-world applications.
Moreover, the integration of Robotic Process Automation (RPA) solutions like EMMA RPA and Microsoft Power Automate further enhances productivity and employee morale. EMMA RPA offers a revolutionary tool for operational efficiency, while Power Automate transforms operations with its user-friendly digitalization capabilities. These tools facilitate process automation, allowing organizations to achieve risk-free ROI evaluations and professional execution of workflows.
Microsoft executives have articulated a clear vision for AI strategy in 2025, emphasizing the importance of embedding AI into their business framework to maintain a competitive edge. Expert analyses further highlight how this integration not only enhances Microsoft’s product offerings but also positions the company as a leader in the evolving technology landscape, driving growth and innovation across industries. Creatum GmbH is dedicated to utilizing these advancements to enhance operational productivity and employee morale.
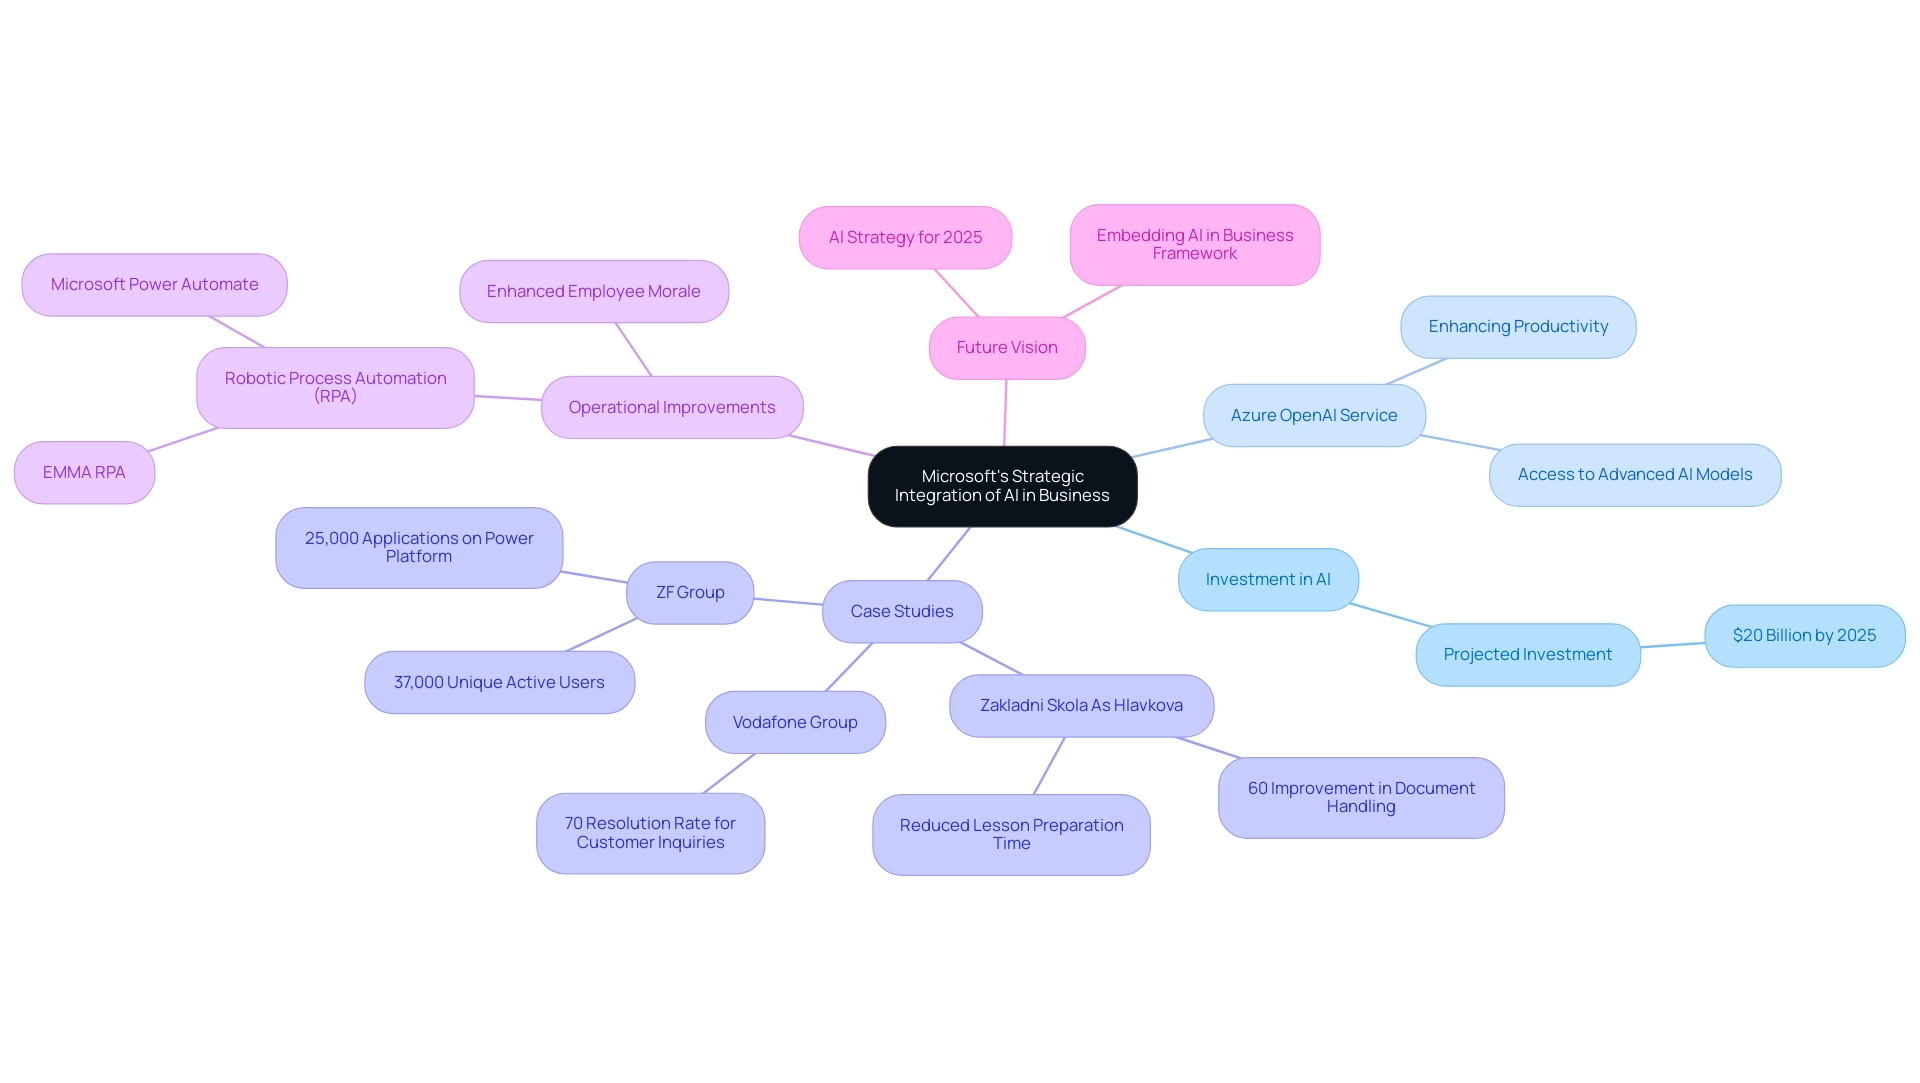
Leveraging AI for Enhanced Operational Efficiency
AI technologies are revolutionizing operational efficiency by automating repetitive tasks, providing deep data analysis for actionable insights, and optimizing workflows. Businesses utilizing AI-driven analytics can identify bottlenecks in their operations, enabling them to implement targeted solutions that minimize downtime and enhance productivity. The adoption of AI in retail has reached an impressive 56%, reflecting a broader trend where 83% of companies prioritize AI in their strategic plans.
Moreover, AI facilitates improved resource allocation by accurately predicting demand and adjusting operations accordingly. This capability not only streamlines processes but also allows organizations to reallocate valuable human resources towards more strategic initiatives, fostering innovation and growth. RPA solutions from Creatum GmbH, such as EMMA RPA and Microsoft Power Automate, exemplify this trend by improving productivity and employee morale through innovative automation tools that simplify complex workflows and reduce manual effort.
Case studies illustrate this trend: in the healthcare sector, which has seen a 38% adoption rate of AI, organizations are utilizing AI to enhance patient care and operational workflows, leading to improved patient outcomes and productivity. A notable case study involved a mid-sized company that enhanced productivity by automating data entry, software testing, and legacy system integration using GUI automation. This implementation reduced data entry mistakes by 70%, accelerated testing processes by 50%, and enhanced workflow effectiveness by 80%, achieving ROI within six months.
Similarly, financial services, boasting a 65% adoption rate, are employing AI to optimize risk management and customer service operations, resulting in faster response times and better client satisfaction. These examples underscore the significant role AI plays in enhancing operational efficiency across various industries.
As Michael Chui, a Senior Fellow, notes, the momentum behind AI—encompassing both generative and analytical forms—continues to build, indicating a robust future for AI-driven operational improvements. This momentum is further reflected in the competitive landscape, where AI startups are enjoying higher valuations than their non-AI counterparts, presenting lucrative opportunities for businesses willing to embrace these technologies.
With investment in generative AI reaching $25.2 billion in 2023, organizations that integrate AI into their operations can not only streamline workflows but also position themselves for sustained success in an increasingly data-driven world.
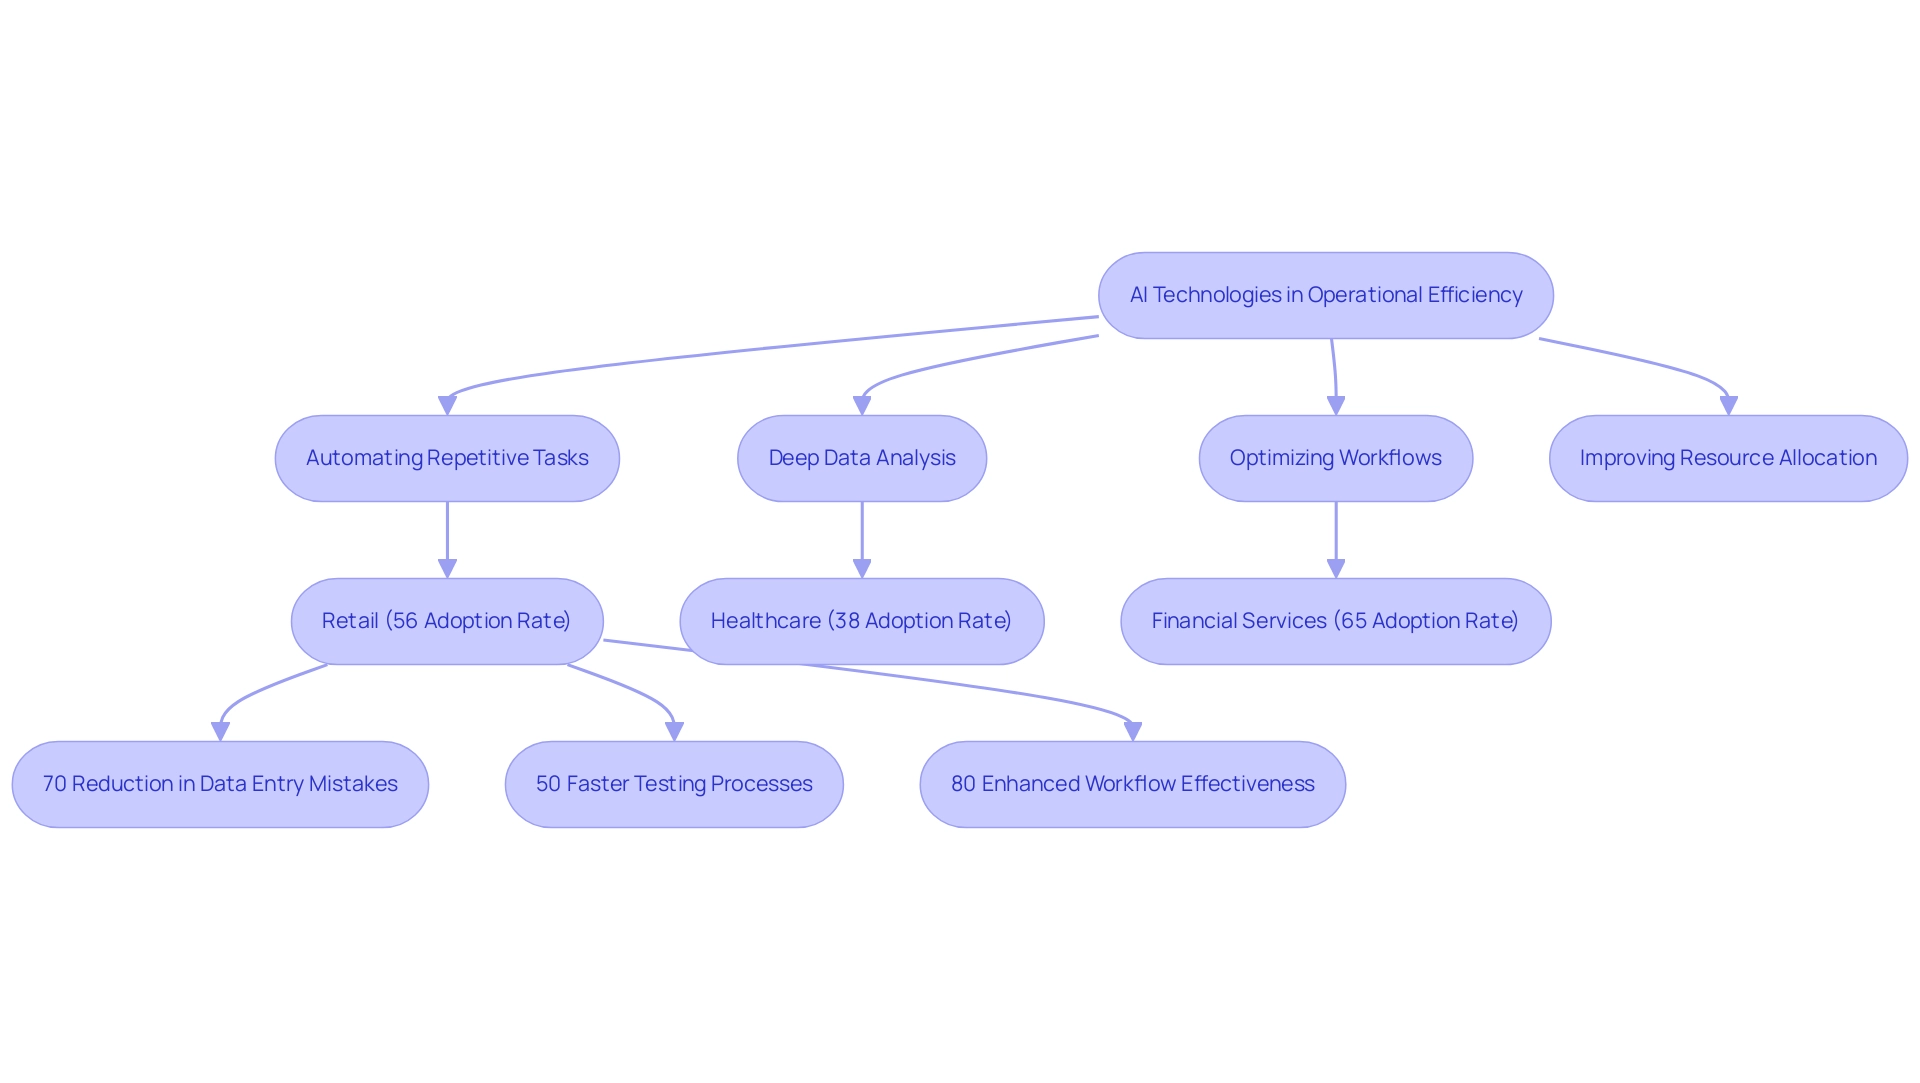
Conclusion
The transformative potential of generative AI and Large Language Models (LLMs) is increasingly evident across various sectors. As businesses strive for enhanced operational efficiency, integrating these technologies is not merely an option; it is a necessity. Companies leveraging generative AI can significantly automate content creation, streamline workflows, and improve customer engagement, ultimately driving productivity and innovation.
However, the journey toward effective AI integration presents challenges. Issues surrounding content ownership and copyright considerations create complex legal landscapes that organizations must navigate carefully. Establishing clear policies on content ownership and understanding the implications of copyright laws are essential steps for businesses to protect their intellectual property while harnessing the power of AI-generated content.
Industry leaders like Microsoft exemplify how strategic integration of AI tools can lead to remarkable improvements in operational efficiency. The success stories of companies utilizing AI solutions underscore the tangible benefits of adopting these technologies, from reducing administrative workloads to enhancing customer service interactions. Organizations prioritizing AI in their strategic planning are likely to experience significant advantages in a competitive marketplace.
In conclusion, embracing generative AI and LLMs is crucial for organizations aiming to thrive in an increasingly automated and data-driven world. By staying informed about emerging trends and legal considerations, businesses can effectively navigate the evolving landscape of AI, transforming potential challenges into opportunities for growth and innovation. As the market for generative AI continues to expand, those who adapt and integrate these technologies will be well-positioned for success in the future.
Frequently Asked Questions
What is generative AI?
Generative AI is a sophisticated class of artificial intelligence capable of producing new content, including text, images, and audio, based on extensive training data.
What are Large Language Models (LLMs)?
LLMs are a specialized subset of generative AI designed to understand and generate human-like text, with notable examples including GPT-3 and its successors.
How do LLMs benefit businesses?
LLMs enhance business operations and drive productivity through automation by generating coherent and contextually appropriate responses.
What is the projected growth of the generative AI market by 2025?
The generative AI market is expected to grow significantly, with the global AI market projected to reach approximately 184 billion U.S. dollars, driven by increasing demand for intelligent automation.
What are some leading use cases for generative AI in call centers?
Content creation and the classification of customer interactions are emerging as leading use cases for generative AI in call centers, transforming customer engagement strategies and streamlining workflows.
What macroeconomic factors influence the growth of the generative AI market?
Technological advancements and government support are key macroeconomic factors that create a favorable environment for AI adoption.
How are organizations using LLMs to improve efficiency?
Organizations adopt LLMs to streamline workflows, reduce operational errors, and allow teams to focus on strategic initiatives, demonstrating their effectiveness in data-rich environments.
What role does Creatum GmbH play in AI implementation?
Creatum GmbH offers customized AI solutions and GenAI workshops, providing hands-on training and custom GPT creation to help organizations implement AI solutions effectively.
What is the current issue regarding ownership of AI-generated material?
The ownership of material produced by generative AI is a critical concern, with legal frameworks evolving and users typically retaining rights to the output, depending on the AI provider’s terms of service.
What are the implications of human involvement in AI-generated works?
While wholly AI-generated works may lack copyright protection, modifications made by humans can meet originality standards, potentially allowing for copyright claims on those contributions.
How can organizations navigate the complexities of AI content ownership?
Companies should establish clear policies regarding ownership of AI-generated materials to mitigate disputes and ensure compliance with intellectual property laws.
What assistance does the AI-based junior consultant, Hayley, provide?
Hayley offers tailored insights to help organizations develop clear policies regarding ownership of materials and understand the legal implications of AI-generated works.
Overview
This article serves as a comprehensive guide for mastering the DAX NETWORKDAYS function in Power BI. It calculates the number of workdays between two dates, explicitly excluding weekends and specified holidays. By detailing the function’s syntax and its applications in business scenarios—such as project management—the article highlights its growing importance for operational efficiency and accurate reporting in organizations. With practical steps for implementation, this guide is essential for professionals seeking to enhance their analytical capabilities.
Introduction
In the realm of business analytics, mastering the DAX NETWORKDAYS function is a game-changer for organizations striving for operational efficiency. This powerful tool calculates the number of workdays between two dates and allows for customization by excluding weekends and holidays. Such functionality is indispensable for accurate project management and reporting. As businesses increasingly turn to data-driven strategies, understanding how to effectively implement the NETWORKDAYS function in platforms like Power BI has become essential. Recent advancements in Robotic Process Automation (RPA) and updates to SQL Server Data Tools position organizations to enhance their analytical capabilities, streamline workflows, and drive growth. This article delves into the intricacies of the NETWORKDAYS function, offering insights into its implementation, real-world applications, and the challenges users may encounter along the way.
Understanding the DAX NETWORKDAYS Function
The DAX NETWORKDAYS capability serves as a powerful tool for calculating the number of whole workdays between two dates, effectively excluding weekends and any specified holidays. Its syntax is structured as follows:
NETWORKDAYS(<start_date>, <end_date>[, <weekend>, <holidays>])
- start_date: This parameter indicates the beginning date of the period.
- end_date: This parameter marks the ending date of the period.
- weekend: (Optional) This allows users to specify which days should be treated as weekends.
- holidays: (Optional) This is a list of dates that should be excluded as holidays.
Mastering these parameters is essential for effectively utilizing the WORKDAYS tool and applying DAX NETWORKDAYS across various business scenarios, particularly in project management and reporting.
As of 2025, the utilization of DAX NETWORKDAYS in business analytics has seen a notable increase, with organizations progressively depending on it to improve operational efficiency. This function is particularly valuable for time-sensitive metrics, such as delivery timelines and workforce planning. A specialist in data analytics remarked, “The DAX NETWORKDAYS formula for calculating business days simplifies the process, making it a valuable resource for time-sensitive metrics like delivery times, project schedules, or workforce planning.”
Recent updates to the SQL Server Data Tools (SSDT), specifically the version updated from v16.0.70.21 on June 16, 2022, have further enhanced the capabilities of date calculation, making it easier for users to incorporate it into their analytics workflows.
Real-world applications of the DAX NETWORKDAYS function illustrate its impact on business reporting. For instance, in the case study titled “Business Intelligence for Data Insights,” companies have successfully integrated this function into their project management frameworks, allowing for more accurate tracking of project timelines and resource allocation. This not only streamlines operations but also supports informed decision-making by transforming raw information into actionable insights.
By leveraging advancements in RPA solutions like EMMA RPA and Microsoft Power Automate, organizations can automate manual workflows, significantly improving their operational efficiency. These tools reduce repetitive tasks and errors, freeing up teams to focus on strategic initiatives. Furthermore, customized solutions that enhance data quality and simplify AI implementation can drive growth and innovation in a data-rich environment.
The incorporation of the WORKDAYS capability with RPA tools can lead to more effective project management and reporting processes using DAX NETWORKDAYS, ultimately improving overall business performance.
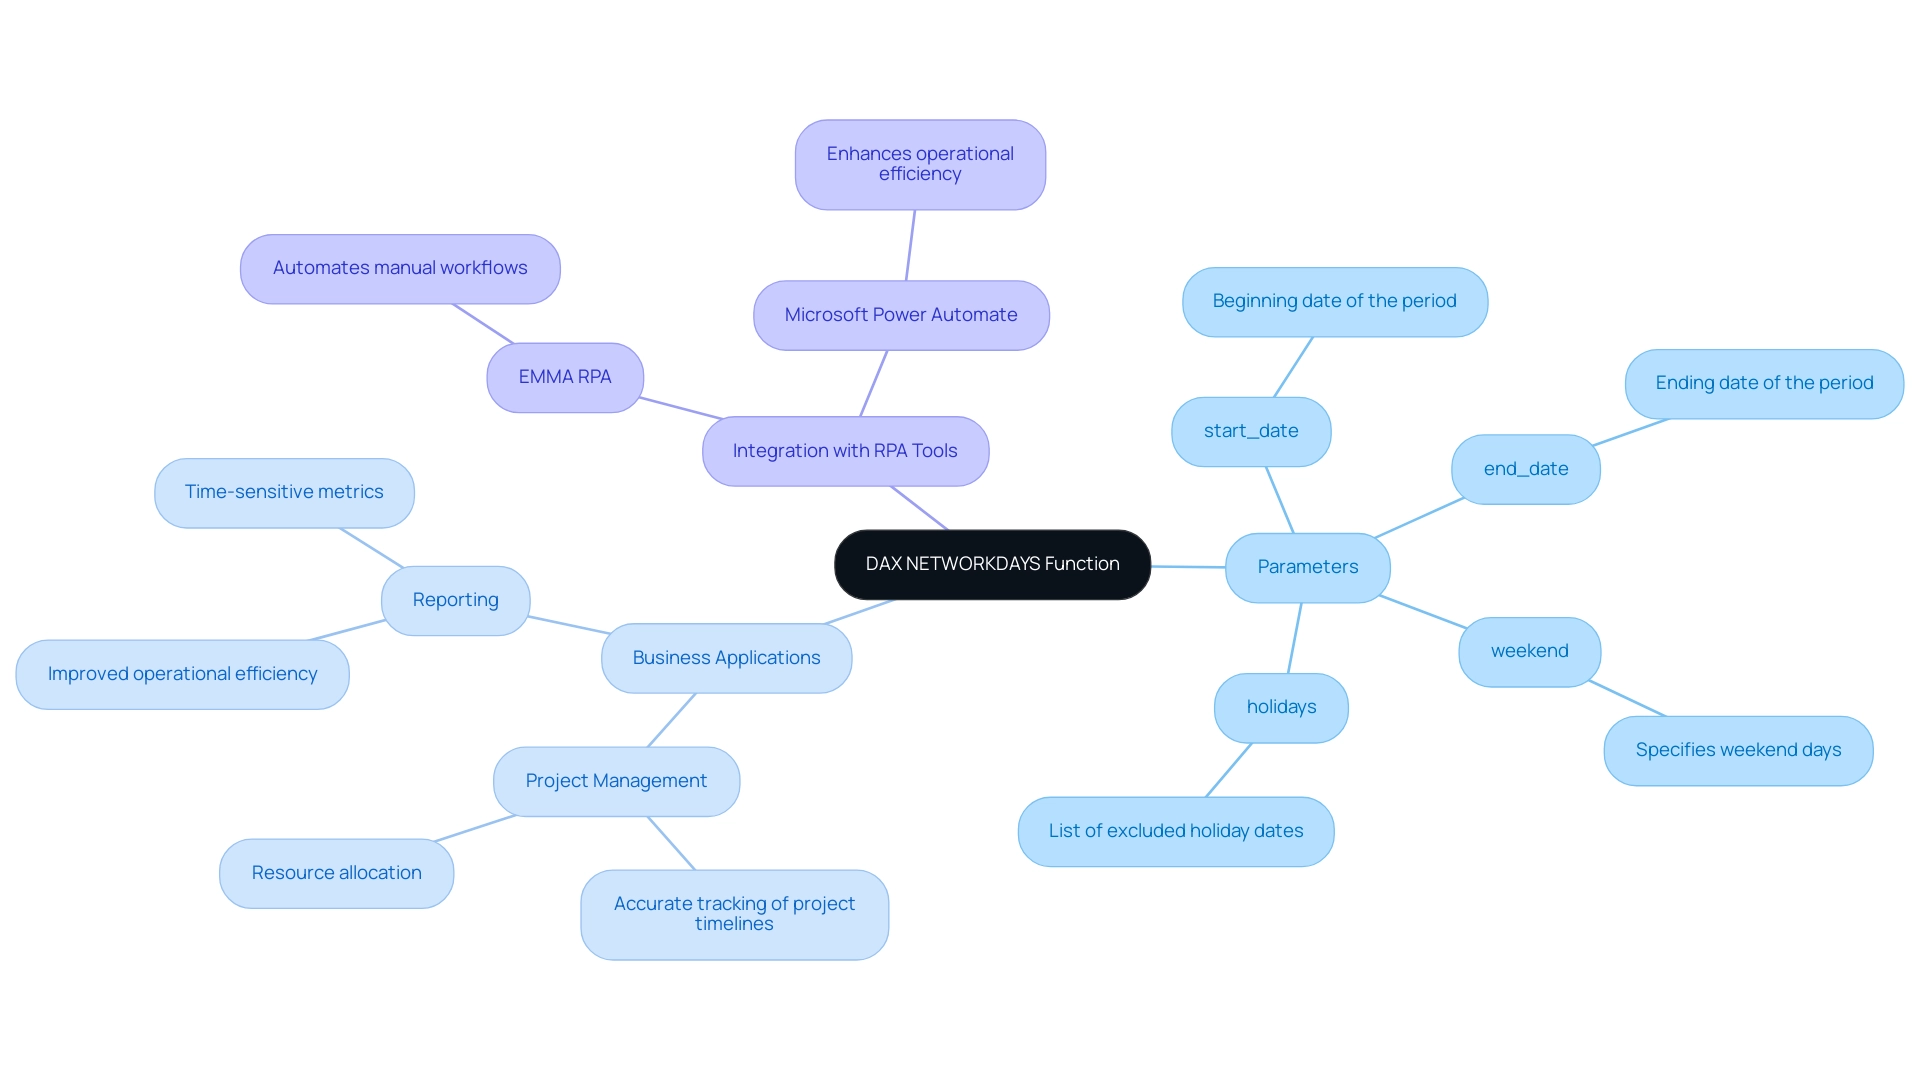
Implementing NETWORKDAYS in Power BI: Step-by-Step Guide
To effectively apply the WORKINGDAYS capability in BI while utilizing Robotic Process Automation (RPA) for improved operational efficiency, follow these detailed steps:
- Open Power BI Desktop and load your data model to ensure all necessary data is accessible.
- Create a new measure by navigating to the ‘Modeling’ tab and selecting ‘New Measure’. This is where you will define your calculation.
- Enter the DAX NETWORKDAYS formula using the WORKDAYS function. For instance:
WorkingDays = NETWORKDAYS(StartDate, EndDate) - Customize the formula by incorporating optional parameters for weekends and holidays, if applicable. This can be done as follows:
WorkingDays = NETWORKDAYS(StartDate, EndDate, 1, Holidays) - Visualize the results by adding the measure to a report visual, such as a card or table, to effectively display the calculated working days.
By following these steps, users can accurately calculate working days in their reports, enhancing analytical capabilities. The application of the WORKDAYS tool not only simplifies reporting processes but also adheres to best practices for developing metrics in Power BI, ensuring confidence in presenting insights within a business intelligence environment. As organizations progressively embrace such capabilities, user adoption rates for the relevant feature are anticipated to increase notably in 2025, indicating its escalating significance in information analysis.
Furthermore, incorporating RPA into your workflows can further improve operational efficiency by automating repetitive tasks related to information management. This minimizes errors and allows your team to concentrate on strategic initiatives that promote business growth. Additionally, tailored AI solutions can help organizations navigate the rapidly evolving AI landscape, ensuring that the technologies implemented align with specific business goals and challenges. Ultimately, the organization’s unique value lies in providing customized solutions that enhance data quality and simplify AI implementation, driving operational efficiency.
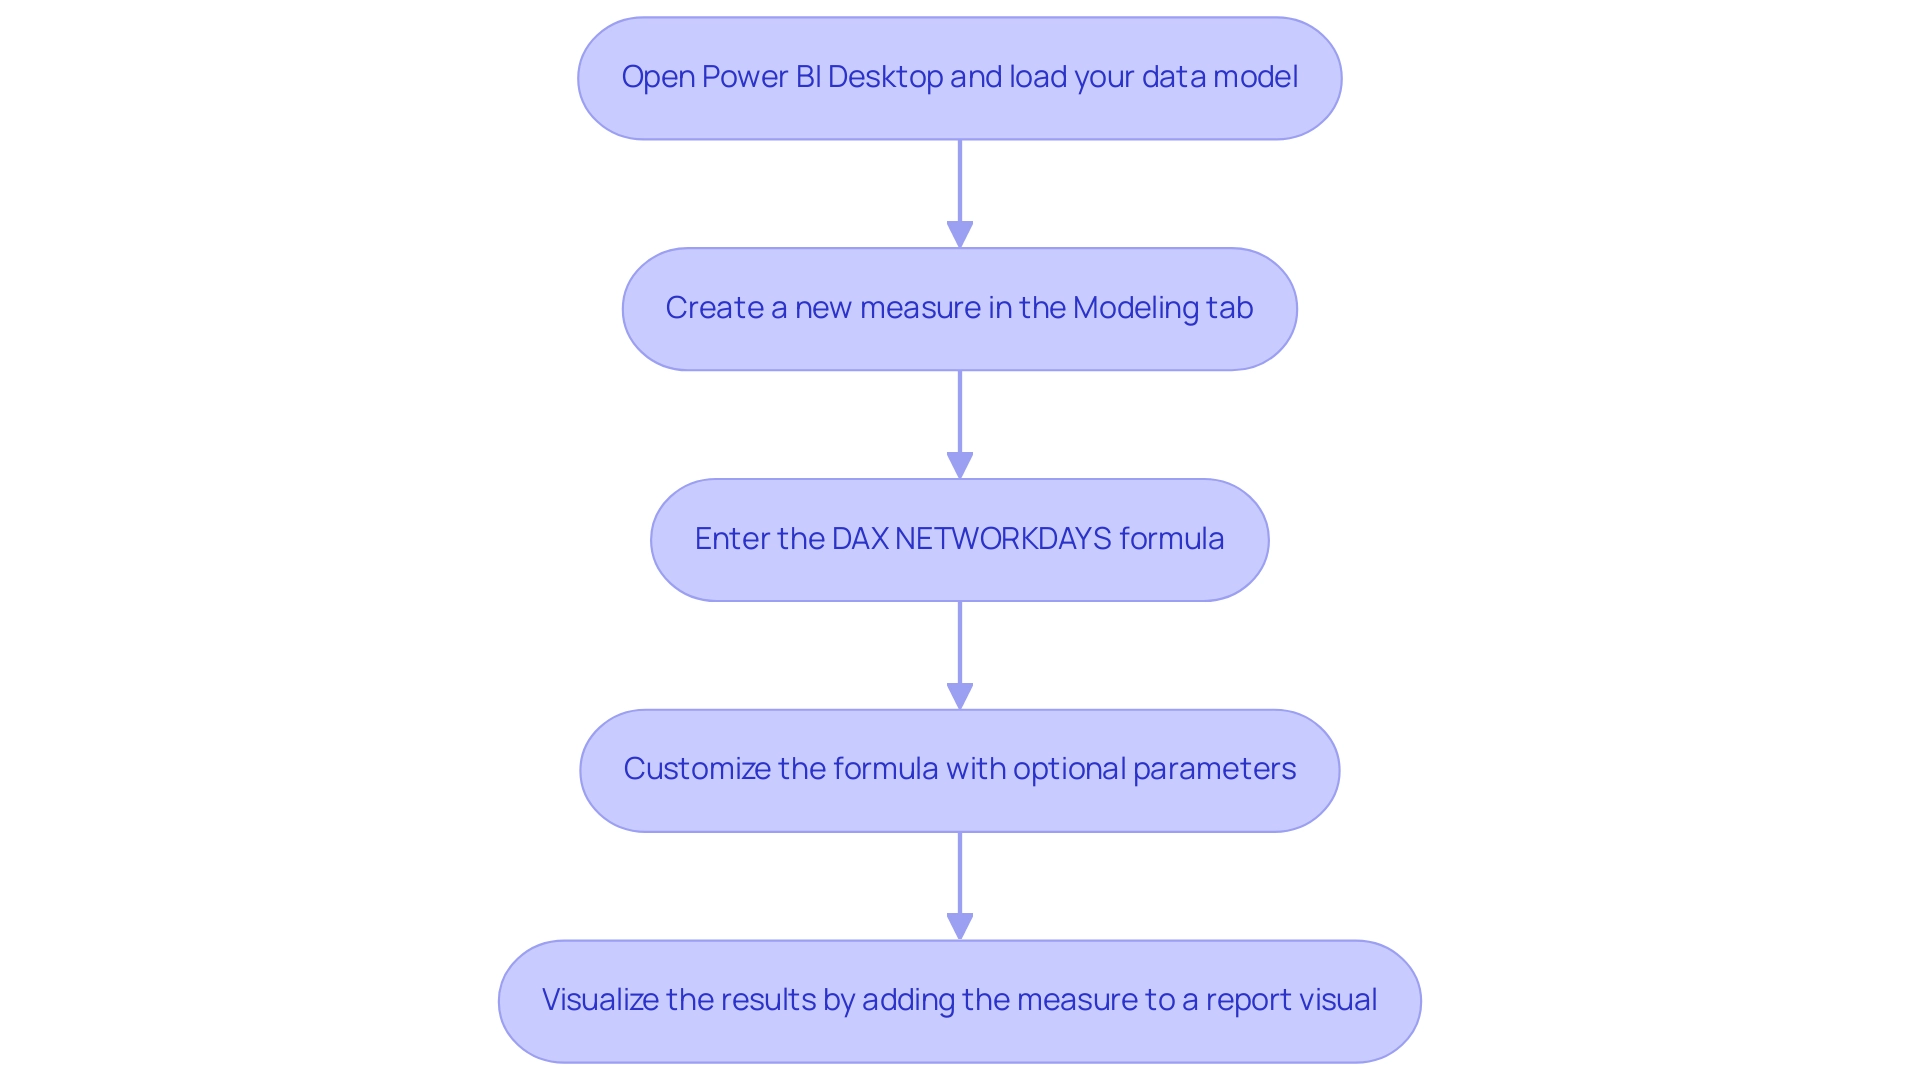
Calculating Working Days: Handling Weekends and Holidays
When utilizing the NETWORKDAYS function in DAX, understanding the significant impact of weekends and holidays on your calculations is crucial.
-
Weekends: The default setting considers Saturday and Sunday as weekends. However, many organizations are recognizing the need for flexibility in their operations. In 2025, a notable percentage of companies are customizing weekend parameters to align with their specific business needs, allowing for more accurate tracking of working days. This customization can be achieved by specifying which days should be treated as weekends within the parameters. Statistics from EmpMonitor indicate that over 500,000 employees across more than 100 countries are affected by these operational adjustments, highlighting the widespread relevance of this issue.
-
Holidays: To effectively exclude holidays from your calculations, maintaining a separate table that lists all relevant holiday dates is essential. This table can then be referenced in your workday calculation, ensuring that your computations reflect actual working days. For example:
WorkingDays = NETWORKDAYS(StartDate, EndDate, 1, Holidays[HolidayDate])
Accurate accounting for weekends and holidays is not merely a technical requirement; it directly influences business productivity. Statistics indicate that weekends and holidays can significantly affect operational efficiency, with many organizations reporting a marked improvement in productivity when these factors are correctly integrated into their planning processes. Furthermore, expert opinions emphasize that precise working day calculations are vital for effective resource allocation and project management.
As noted by Lorelei Trisca, Content Marketing Manager, “Currently, 47% of affected employees choose to let the conflict go without any formal resolution,” underscoring the importance of accurate calculations in fostering a productive work environment.
Additionally, a case study titled “Need for AI Adoption to Stay Competitive” reveals that 79% of leaders agree that adopting AI is essential for maintaining competitiveness. This statistic parallels the necessity for clear plans in DAX calculations, reinforcing the importance of accurate calculations in strategic decision-making. By leveraging Robotic Process Automation (RPA) and Business Intelligence solutions from Creatum GmbH, organizations can enhance their operational efficiency and ensure that their working day calculations truly reflect their business operations, ultimately leading to better decision-making and enhanced productivity.
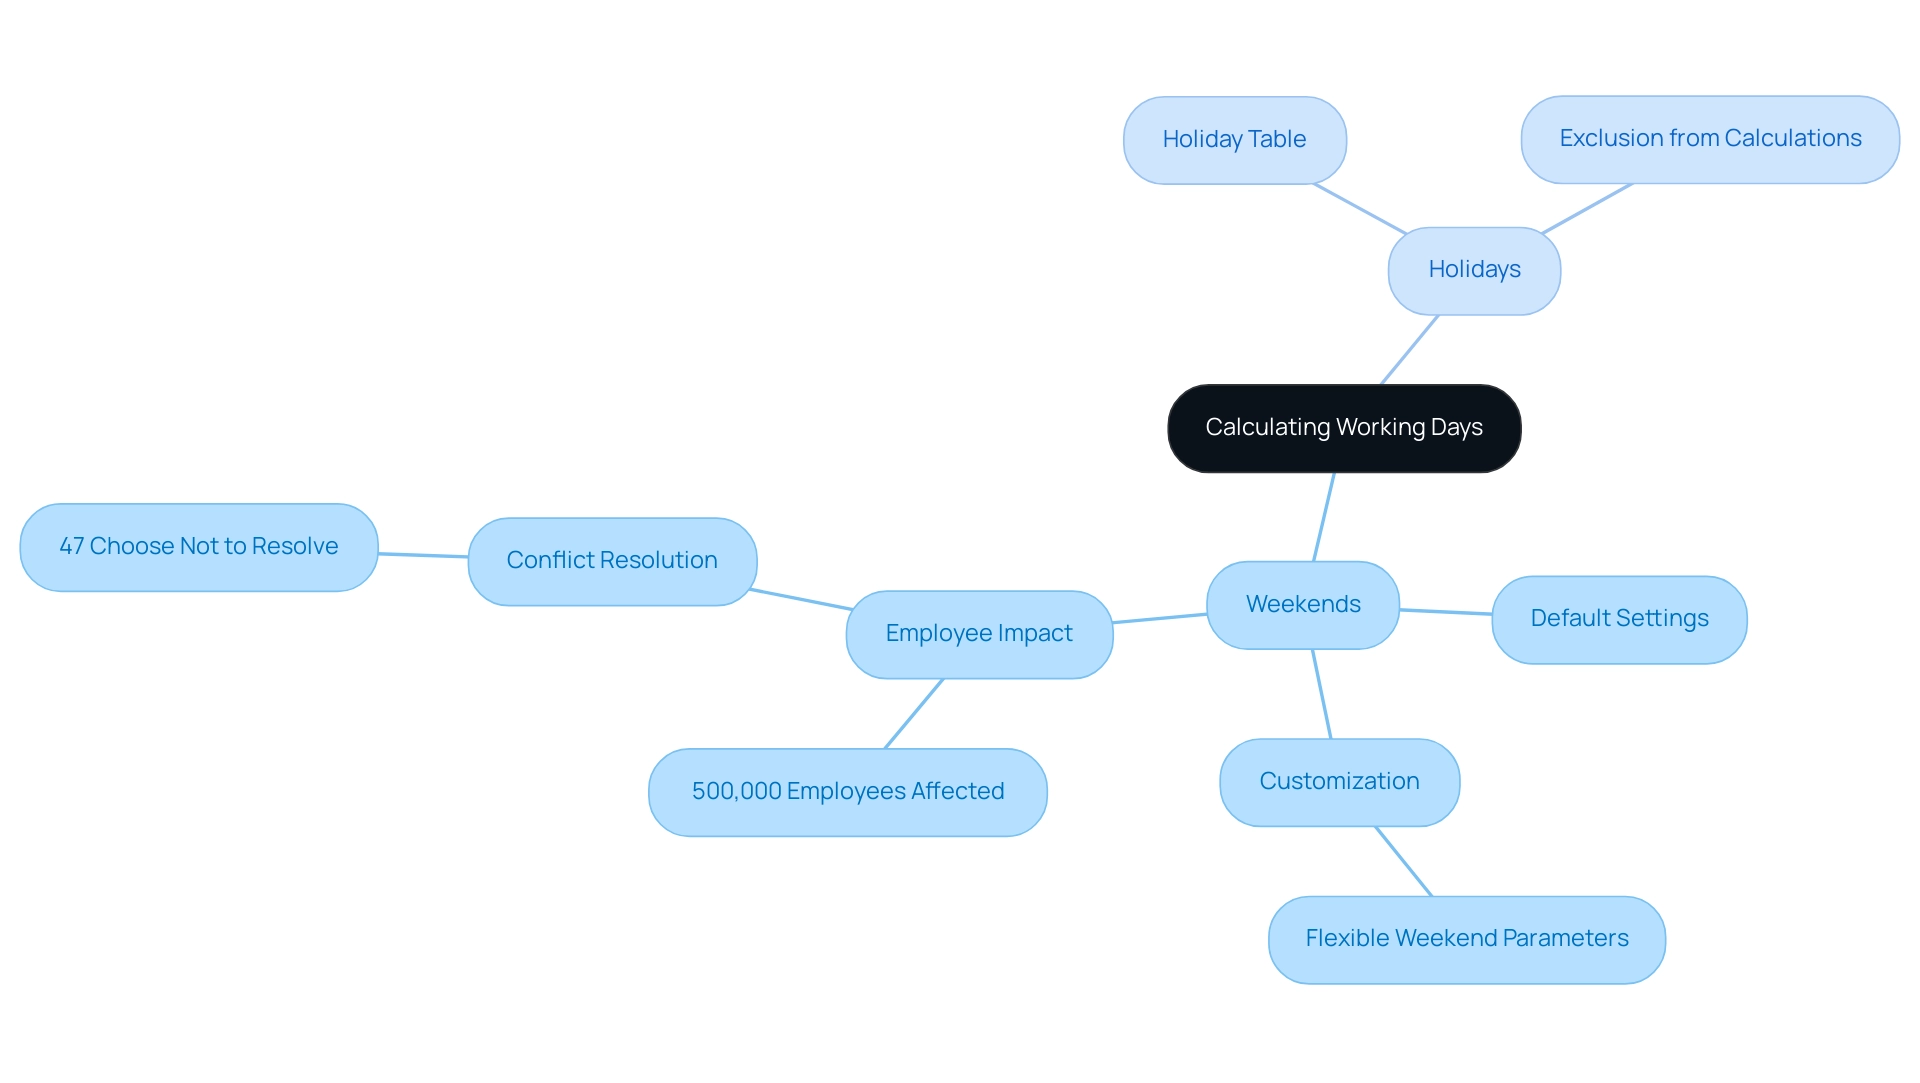
Overcoming Challenges with NETWORKDAYS in Power BI
When utilizing the NETWORKDAYS function in Power BI, users often encounter several key challenges that can hinder their analytical processes.
-
Incorrect Date Formats: One of the most common issues arises from improperly formatted dates. To mitigate this, it is advisable to use the DATE function to explicitly define dates, ensuring they conform to the expected format. Statistics indicate that date format errors account for a significant portion of DAX calculation issues, with many users reporting difficulties in 2025.
-
Missing Holidays Table: Another frequent challenge is the absence of a properly configured holidays table. If your calculations reference a holidays table, it is crucial to ensure that it is correctly set up and accessible within your information model. This oversight can lead to inaccurate results and misinterpretations of information.
-
Performance Issues: Performance optimization is vital, especially when working with large datasets. In fact, 47% of users are dissatisfied with the performance of their business intelligence tools, highlighting the need for effective optimization strategies. Users should contemplate simplifying their DAX calculations and reducing the complexity of their models to enhance performance. Slow loading times and sluggish visualizations are common issues among BI developers, making it essential to optimize queries and information models for a smoother user experience. As Amit Chandak, Chief Analytics Officer, notes, “Optimizing DAX calculations is crucial for improving overall performance and user satisfaction.”
-
Broader Context: Additionally, organizations may face challenges related to data security within BI, particularly with row-level security on Excel data sources. This context underscores the importance of addressing various issues that can impact the effectiveness of BI as a whole, especially in a data-rich environment where extracting meaningful insights is critical for maintaining a competitive edge.
-
Monitoring Tools: To further enhance performance and insights, users should explore essential Power BI monitoring tools designed for developers. These resources can assist in identifying performance bottlenecks and optimizing models, ultimately driving operational efficiency and enabling informed decision-making that fosters business growth.
By acknowledging these challenges and applying the suggested solutions, users can greatly enhance their experience with DAX NETWORKDAYS, resulting in more precise and effective analysis. Creatum GmbH’s solutions, such as EMMA RPA and Automate, can further assist in overcoming these challenges, ensuring that organizations can leverage their data effectively to drive growth and innovation.
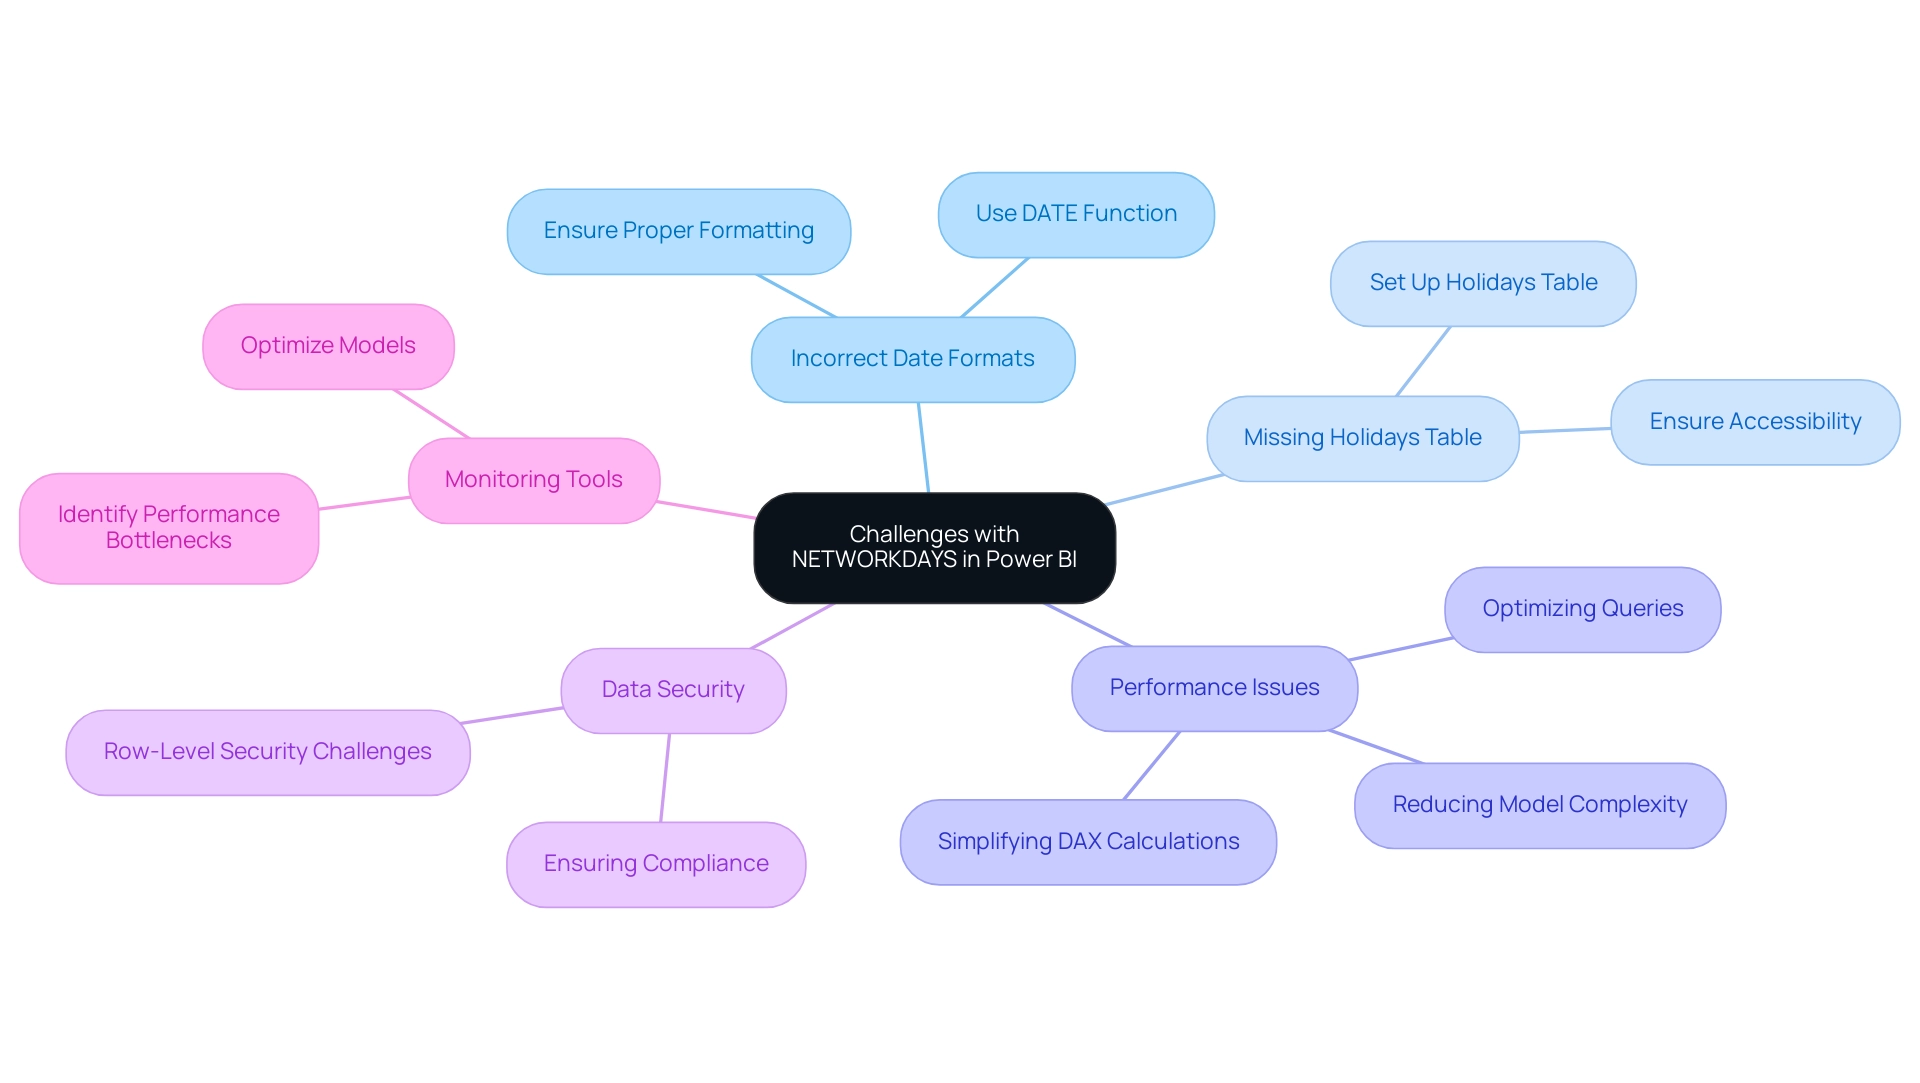
Continuous Learning: Expanding Your DAX Skills
To elevate your DAX skills effectively and leverage the full potential of Business Intelligence and RPA for operational efficiency at Creatum GmbH, consider implementing the following strategies:
-
Online Courses: Enroll in specialized courses focusing on DAX and BI. With 153 free BI courses available, you can access a wealth of knowledge, including 11 hours of on-demand video and 53 articles, culminating in a certificate of completion. These resources are designed to enhance your comprehension and present advanced techniques that can assist in overcoming challenges such as time-consuming report creation and inconsistencies.
-
Regular Practice: Strengthen your learning by applying new concepts to real-world projects or sample sets. This practical approach not only solidifies your skills but also enhances your ability to tackle intricate information challenges, ultimately enabling your organization to transform unrefined data into actionable insights.
-
Engage in Community Forums: Actively participate in BI community forums and social media groups. Engaging with peers allows you to share insights, ask questions, and learn from others’ experiences, fostering a collaborative learning environment. This engagement is vital, as it helps you stay connected with the latest discussions and trends in the BI community, providing actionable guidance for your BI initiatives.
-
Stay Informed: Keep up with the latest trends and updates in DAX by following industry blogs, attending webinars, and utilizing official Microsoft resources. Staying informed about new features and best practices is crucial for maintaining a competitive edge in analysis. As highlighted by Certstaffix Training, Power BI users should effectively communicate their findings to others, underscoring the importance of mastering DAX skills in professional settings.
-
Leverage RPA Solutions: Utilize Creatum GmbH’s EMMA RPA and Power Automate to streamline repetitive tasks and enhance operational efficiency. These tools can significantly reduce the time spent on report creation and help address data inconsistencies, allowing your team to focus on deriving actionable insights from data. By committing to these continuous learning strategies and leveraging Creatum GmbH’s RPA solutions, you can master DAX functions, such as
dax networkdays, and significantly enhance your data analysis capabilities, ultimately empowering your organization to drive growth and innovation through effective use of Business Intelligence and RPA.
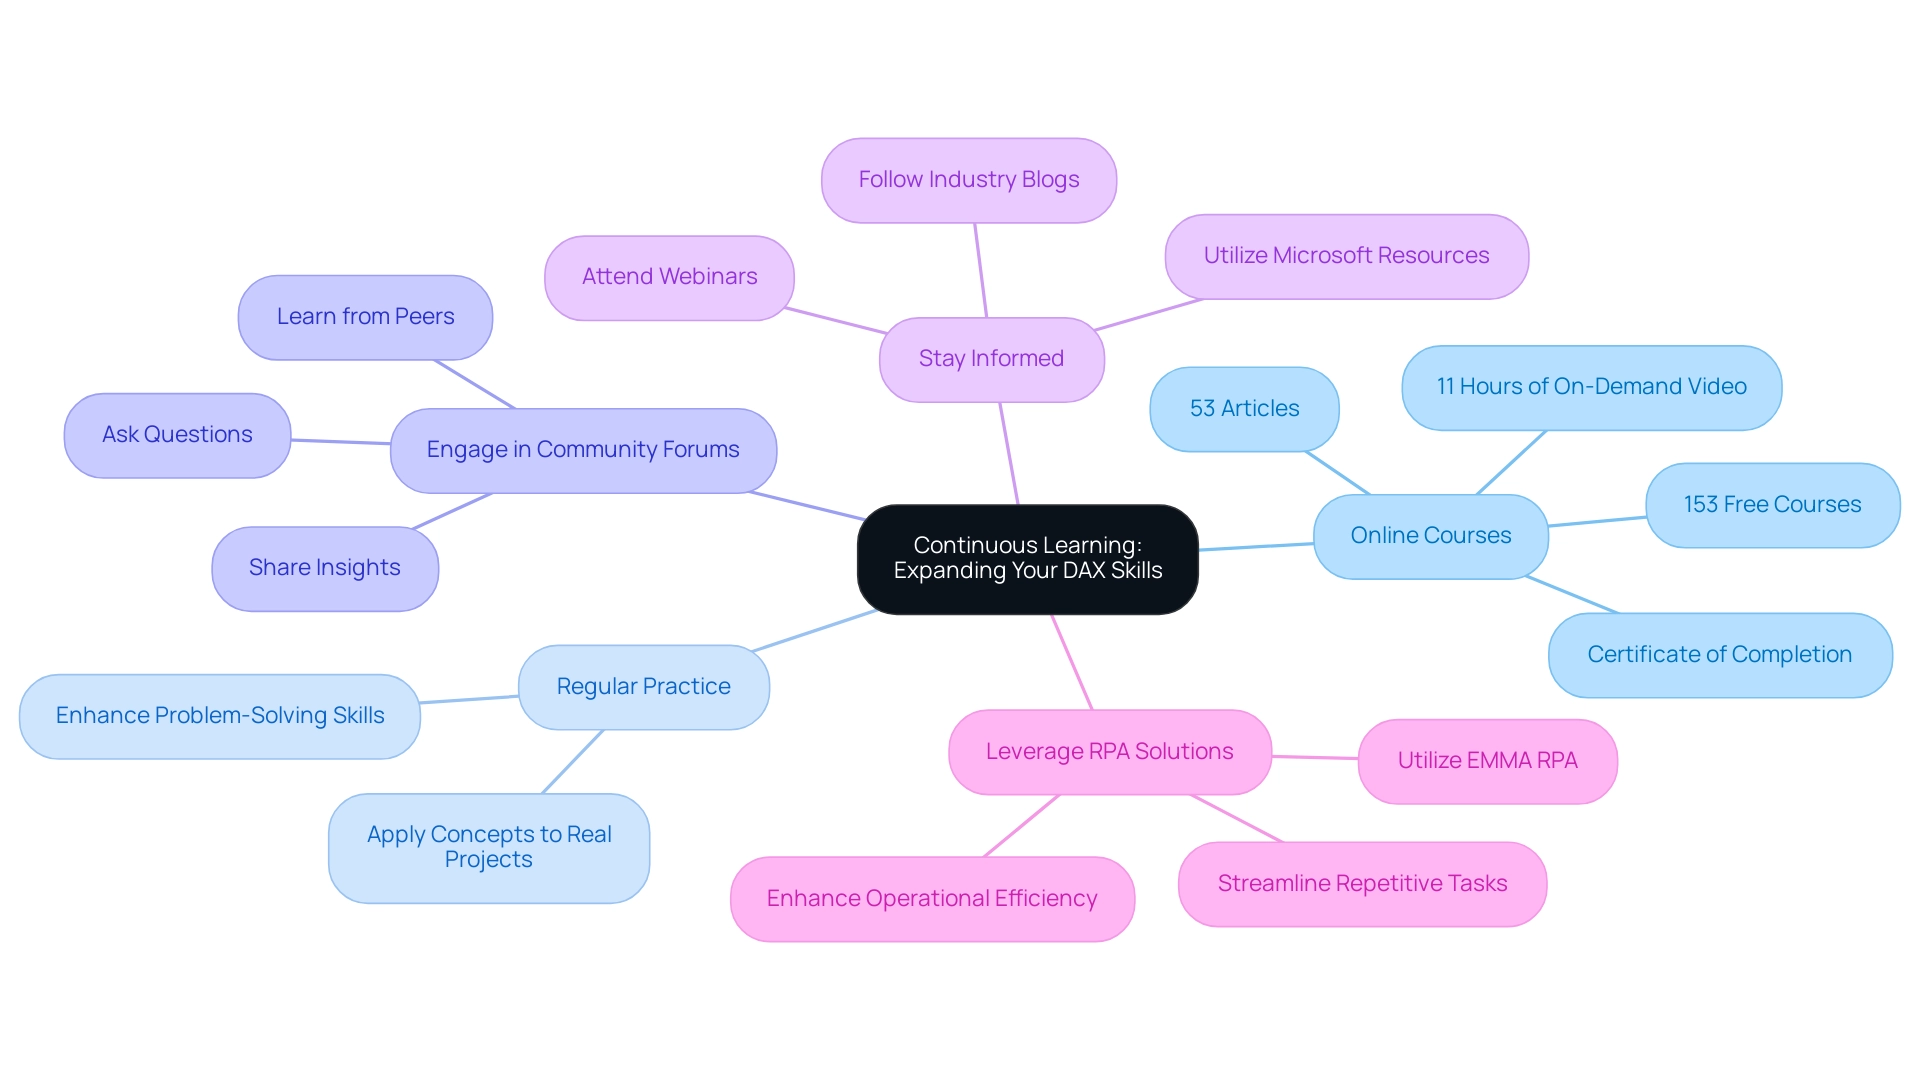
Conclusion
The DAX NETWORKDAYS function is essential for enhancing business analytics, as it accurately calculates workdays between two dates while accounting for weekends and holidays. Grasping its syntax and parameters is crucial for effective implementation in various scenarios, particularly in project management and reporting. The increasing reliance on this function highlights its importance in achieving operational efficiency and precise metric tracking, especially as organizations embrace data-driven strategies.
Implementing the NETWORKDAYS function in Power BI not only streamlines reporting processes but also adheres to best practices, ensuring confidence in analytics. Addressing common challenges such as incorrect date formats, missing holiday tables, and performance issues can significantly improve user experience and analytical outcomes. By integrating RPA solutions, businesses can automate workflows, reduce errors, and concentrate on strategic initiatives that foster growth.
Ongoing learning and engagement with community resources empower users to master DAX skills and fully leverage Business Intelligence tools. As the data analytics landscape evolves, the ability to accurately calculate working days and efficiently manage resources remains vital for organizations seeking a competitive edge. Embracing these tools and strategies will ultimately enhance decision-making and boost productivity in a data-rich environment.
Frequently Asked Questions
What is the DAX NETWORKDAYS capability used for?
The DAX NETWORKDAYS capability is used to calculate the number of whole workdays between two dates, excluding weekends and any specified holidays.
What is the syntax for the NETWORKDAYS function?
The syntax for the NETWORKDAYS function is as follows: NETWORKDAYS(<start_date>, <end_date>[,
What do the parameters of the NETWORKDAYS function represent?
- start_date: The beginning date of the period.\n- end_date: The ending date of the period.\n- weekend: (Optional) Specifies which days are treated as weekends.\n- holidays: (Optional) A list of dates to be excluded as holidays.
How has the use of DAX NETWORKDAYS changed in recent years?
As of 2025, the use of DAX NETWORKDAYS in business analytics has increased, with organizations relying on it to enhance operational efficiency, particularly for time-sensitive metrics such as delivery timelines and workforce planning.
What recent updates have improved the capabilities of date calculations in DAX?
Recent updates to SQL Server Data Tools (SSDT) have enhanced date calculation capabilities, making it easier for users to incorporate the NETWORKDAYS function into their analytics workflows.
Can you provide an example of how DAX NETWORKDAYS is applied in business reporting?
In the case study ‘Business Intelligence for Data Insights,’ companies have integrated the DAX NETWORKDAYS function into their project management frameworks, allowing for accurate tracking of project timelines and resource allocation.
How can organizations improve operational efficiency using RPA and DAX NETWORKDAYS?
By leveraging RPA solutions like EMMA RPA and Microsoft Power Automate alongside DAX NETWORKDAYS, organizations can automate manual workflows, reduce repetitive tasks, and enhance overall operational efficiency.
What steps should be followed to apply the WORKINGDAYS capability in Power BI?
The steps include:\n1. Open Power BI Desktop and load your data model.\n2. Create a new measure in the ‘Modeling’ tab.\n3. Enter the DAX NETWORKDAYS formula.\n4. Customize the formula with optional parameters for weekends and holidays.\n5. Visualize the results in a report visual.
What benefits does the application of the WORKDAYS tool provide in Power BI?
The WORKDAYS tool simplifies reporting processes and adheres to best practices for developing metrics in Power BI, enhancing confidence in presenting insights within a business intelligence environment.
Overview
KPI cards stand as essential tools in data visualization, succinctly presenting key performance indicators alongside their target values. This capability empowers organizations to enhance operational efficiency and make informed decisions. By providing immediate insights into performance metrics, KPI cards streamline workflows and facilitate strategic alignment across departments. In doing so, they support effective decision-making in today’s fast-paced business environment.
Consider how KPI cards can transform your organizational approach. They not only offer clarity but also drive accountability, ensuring that teams remain focused on their goals. As you reflect on your current practices, ask yourself: Are you leveraging these powerful tools to their fullest potential?
In conclusion, embracing KPI cards can significantly impact your decision-making processes. By integrating them into your operational strategies, you position your organization for success in a competitive landscape.
Introduction
In the dynamic realm of business, where data is the cornerstone of decision-making and strategy formulation, Key Performance Indicator (KPI) cards have become essential assets for organizations pursuing operational excellence. These visual tools not only display critical metrics alongside their targets but also equip decision-makers with immediate insights that can profoundly impact strategic planning.
As companies navigate the intricacies of performance measurement, KPI cards direct attention to areas requiring focus, ultimately boosting efficiency and effectiveness. This article explores the purpose, features, and best practices related to KPI cards, underscoring their crucial role in promoting data-driven decision-making and aligning organizational objectives in 2025 and beyond.
Defining KPI Cards: An Overview of Their Purpose and Importance
A KPI card serves as a powerful visual tool that succinctly presents a key performance indicator alongside its target value, establishing a cornerstone of effective data visualization. As we approach 2025, KPI card tools have become indispensable for organizations striving to enhance operational efficiency and decision-making processes. They provide a clear snapshot of performance, enabling decision-makers to swiftly assess how well a specific metric aligns with its goal.
This immediacy is vital in today’s fast-paced business environment, where timely insights can significantly influence strategic planning. The aim of KPI tools transcends mere representation; they encompass essential metrics that facilitate informed decision-making. By highlighting areas requiring attention or improvement, KPI tools empower teams to focus their efforts strategically. For instance, organizations that utilize KPI tools have reported a notable increase in operational efficiency, as these resources streamline workflows and minimize the time spent on data analysis.
This relevance is particularly pronounced in the context of Robotic Process Automation (RPA), where automating manual workflows can further boost efficiency and employee morale. Real-world examples illustrate the effectiveness of KPI tools in enhancing decision-making. Companies that have adopted tailored KPI cards have experienced improved visibility into their performance metrics, allowing for more agile responses to market changes. Moreover, integrating KPI card tools into SaaS dashboards facilitates comprehensive tracking of the entire customer lifecycle, yielding valuable insights for marketing, product development, and customer support.
This aligns with the capabilities of Power BI services, which enhance reporting and actionable insights. Professional insights underscore the significance of KPI tools in visual representation. As organizations navigate conflicting targets across departments, KPI tools emerge as a unifying metric that aligns efforts toward common goals. This alignment is crucial, as conflicting objectives can undermine optimization efforts, resulting in inefficiencies.
In this context, KPI tools not only enhance data quality but also clarify the intricate environment of evaluation, ensuring that companies can make data-informed choices that foster growth and innovation. As noted by British economist Charles Goodhart, “When a measure becomes a target, it ceases to be a good measure,” highlighting the critical balance KPI metrics must maintain in evaluating results.
In summary, KPI tools, including the KPI card, are more than just visual aids; they are essential components of a robust decision-making framework. Their ability to provide immediate insights into measurement metrics renders the KPI card indispensable for organizations aiming for operational excellence in 2025 and beyond. Furthermore, the significance of selecting the right KPI card software cannot be overstated, as it ensures that organizations can effectively track their KPIs and derive actionable insights tailored to their specific needs.
Leveraging RPA solutions like EMMA RPA and Microsoft Power Automate can further enhance this process, ensuring that organizations remain competitive in a rapidly evolving AI landscape.
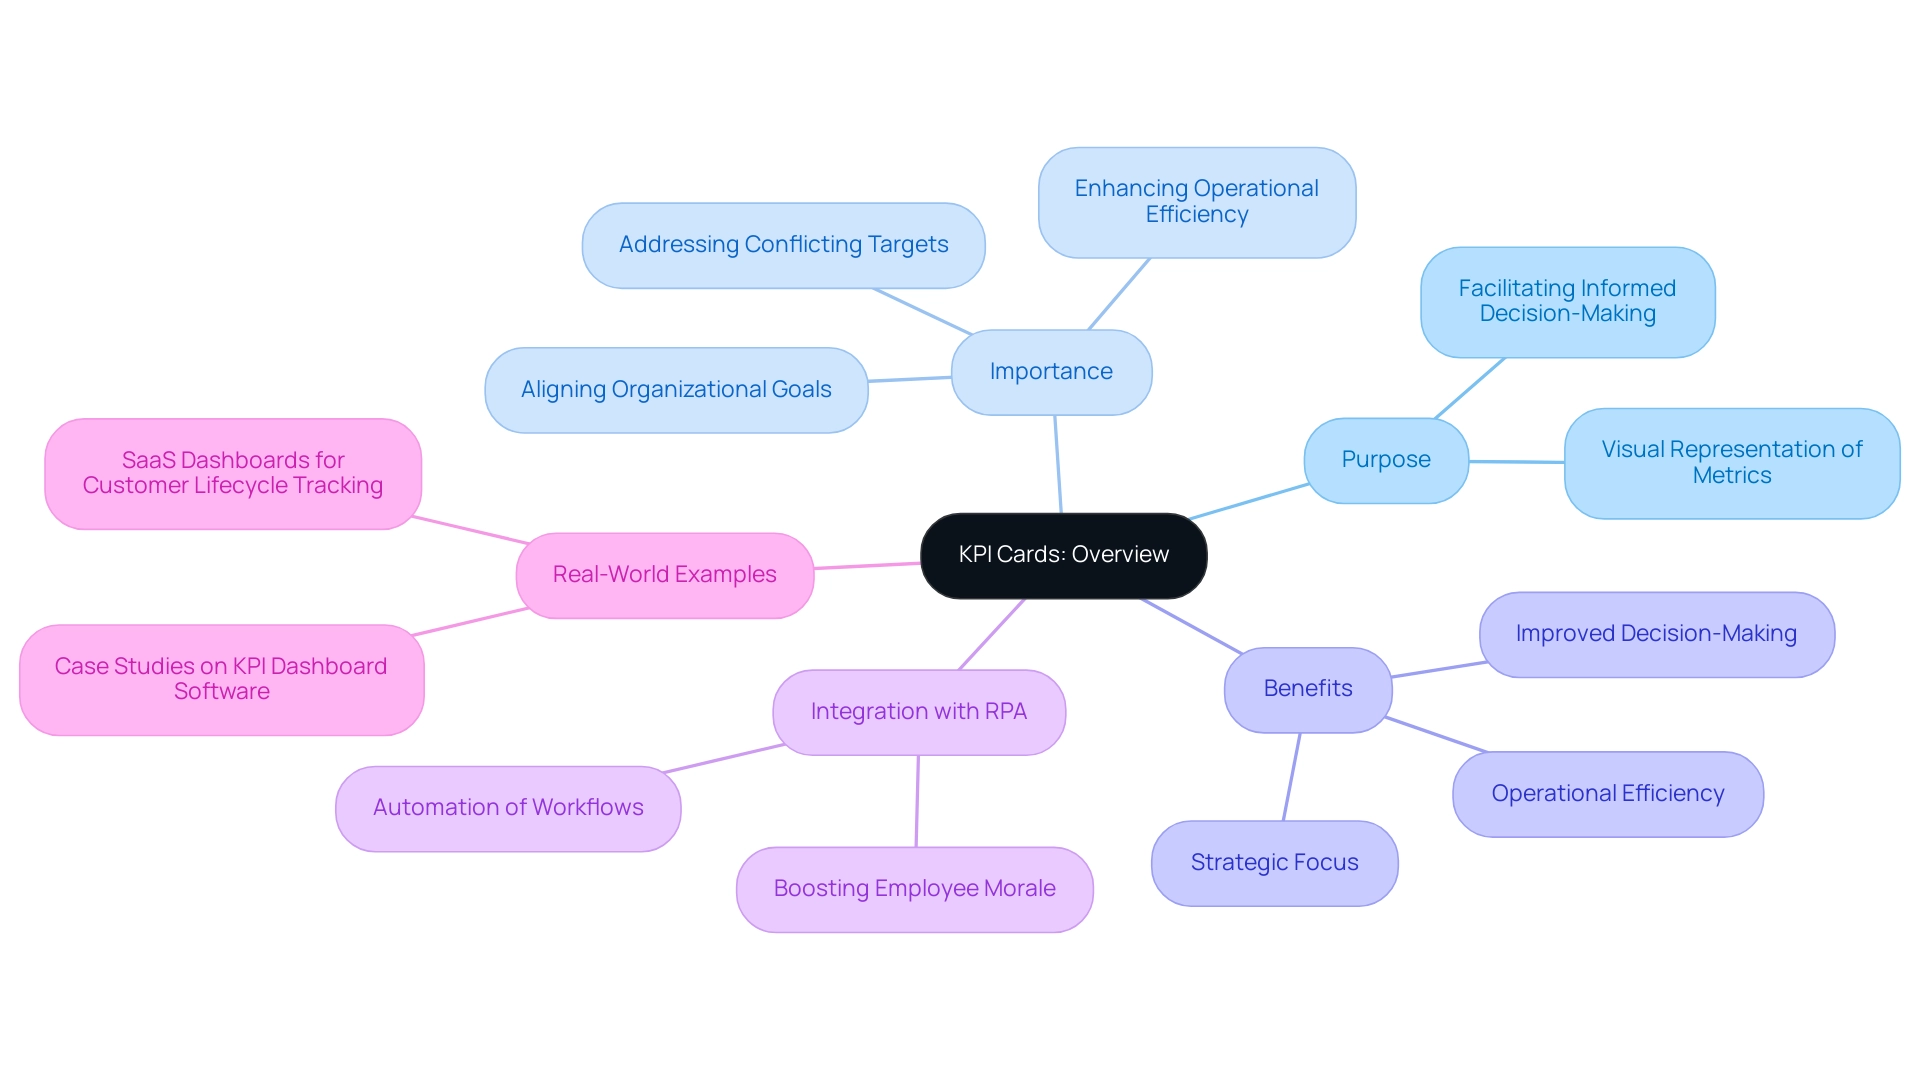
Key Features and Benefits of KPI Cards in Data Visualization
KPI cards are equipped with crucial attributes that significantly enhance their efficiency in information visualization. These features include the ability to display current values, target values, and indicators of success in a concise format, essential for swift decision-making. The benefits of KPI cards are numerous; they enhance clarity in data presentation, provide quick insights into trends, and highlight essential metrics that align with overarching business goals.
Organizations can utilize KPI tools to monitor sales performance, customer satisfaction scores, or operational efficiency metrics. This empowers teams to make informed, data-driven decisions promptly. Regular reviews of these KPIs are vital to ensure they remain relevant and aligned with the dynamic business landscape.
As Lorea Lastiri noted, “Long periods of system failure may have significant repercussions, such as lost sales revenue or loss of customer confidence,” underscoring the importance of maintaining accurate KPIs.
Moreover, KPI cards can be tailored to reflect specific organizational goals, making them versatile tools applicable across various industries. A notable case study illustrates how SaaS companies meticulously track the entire customer lifecycle—from acquisition to support and churn—using a KPI card. This method not only communicates information effectively but also aids in making informed choices about marketing strategies, product development, and customer support initiatives, showcasing the practical use of KPI cards in real-world scenarios.
The significance of Business Intelligence in this context cannot be overstated; it transforms raw data into actionable insights, enabling informed decision-making that drives growth and innovation. Furthermore, integrating Power BI services, including the 3-Day Power BI Sprint for rapid report creation and the General Management App for comprehensive oversight, enhances the effectiveness of KPI card displays. The 3-Day Power BI Sprint allows organizations to swiftly produce professionally crafted reports, while the General Management App offers a complete overview of metrics.
Coupled with Robotic Process Automation (RPA), businesses can automate manual workflows, boosting efficiency and enabling teams to focus on strategic initiatives that foster growth.
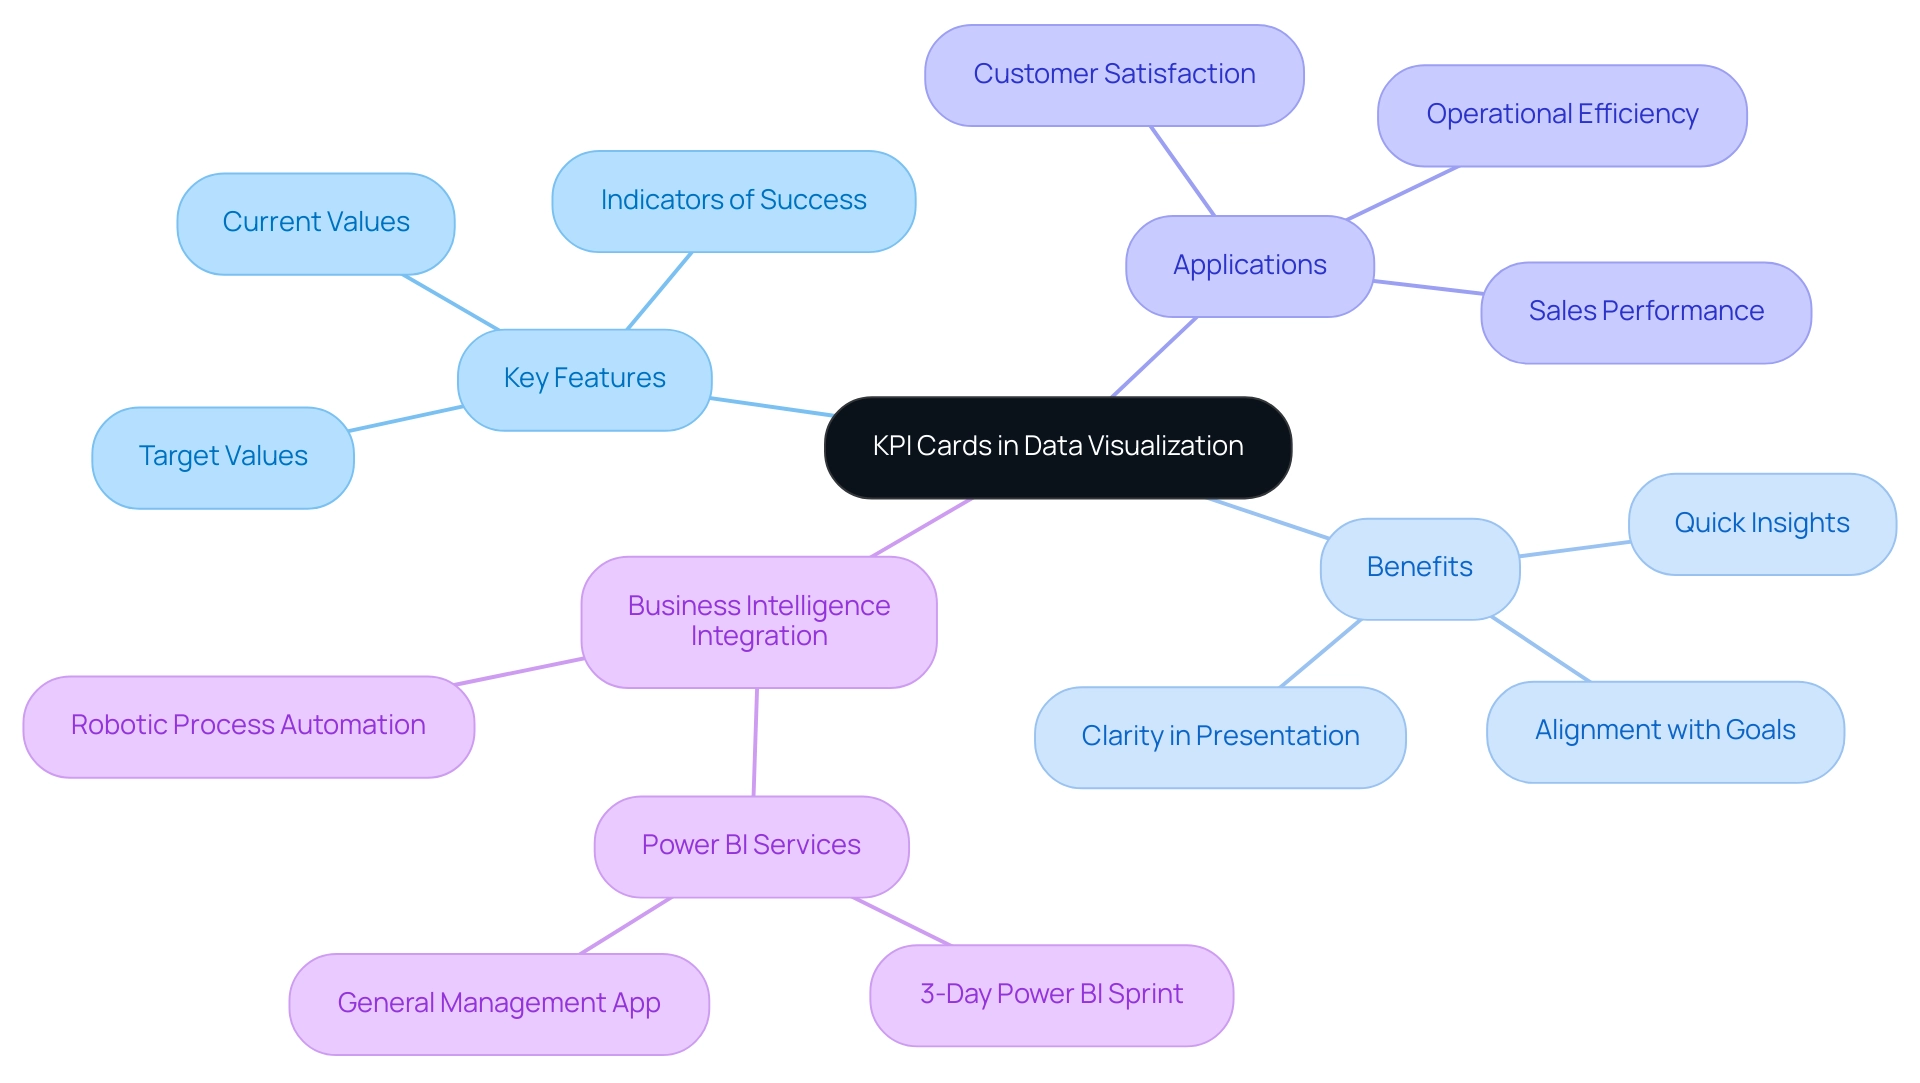
How to Create and Configure KPI Cards Effectively
Creating and configuring a KPI card display is a critical process that ensures effective communication of key metrics. Begin by identifying the key success indicators (KPIs) that align with your business objectives; these will serve as the foundation for your analysis. Selecting the right data visualization tool is equally important—both Power BI and Tableau provide robust capabilities for the creation of KPI cards.
In Power BI, the process involves several straightforward steps:
- Choose a relevant measure that reflects your KPI.
- Define a target value that represents success for that measure.
- Establish thresholds to indicate varying levels of achievement.
This structured approach clarifies expectations and facilitates performance tracking.
Ensuring information accuracy and timeliness is crucial. Outdated or incorrect information can lead to misguided decisions, undermining the very purpose of a KPI card. Therefore, ensure that your information sources are reliable and regularly updated.
Utilizing Business Intelligence tools such as Power BI can significantly improve your reporting capabilities, ensuring efficient reporting and consistency.
However, organizations frequently encounter obstacles like time-consuming report generation and inconsistencies, which can impede the effectiveness of KPI displays. To mitigate these issues, integrating RPA solutions can streamline data management processes, reduce manual errors, and enhance operational efficiency.
To enhance the effectiveness of your KPI displays, incorporate visual elements such as colors and icons. These elements can significantly improve readability and impact, making it easier for stakeholders to grasp the information at a glance. For instance, using a color-coded system to indicate achievement levels can quickly convey whether a KPI is on track, at risk, or off target.
Best practices for creating a KPI card display in 2025 emphasize the importance of a balanced approach to metrics. Organizations should aim for a 60/40 ratio of leading to lagging indicators, allowing for both predictive insights and validation of past performance. This balance ensures that your KPI card indicators reflect current standings and guide future actions.
Additionally, expert opinions suggest that continuous evolution of KPIs is necessary to adapt to changing business conditions. Regularly revisiting and adjusting your metrics will help maintain alignment with organizational goals and market dynamics. As Rebecca Reynoso, Lead Editor at G2, states, “Hey, we’re Databox. Our mission is to help businesses save time and grow faster,” highlighting the importance of effective KPI management in driving business growth.
Case studies highlight the significance of selecting the right KPI dashboard software, as this choice directly impacts the accuracy and actionability of insights. By understanding your tracking requirements and the functionalities offered by various software options, you can effectively customize your KPI card displays to meet specific needs. For instance, a free Databox template is available for monitoring important KPIs related to website visitor engagement, which can be set up easily without coding.
In summary, developing effective visuals for a KPI card in Power BI and Tableau requires a systematic approach that emphasizes information integrity, visual clarity, and strategic alignment with business objectives. By adhering to these guidelines and utilizing Power BI services from Creatum GmbH, including the 3-Day Sprint for swift report creation, organizations can harness KPI displays as powerful tools for data-driven decision-making.
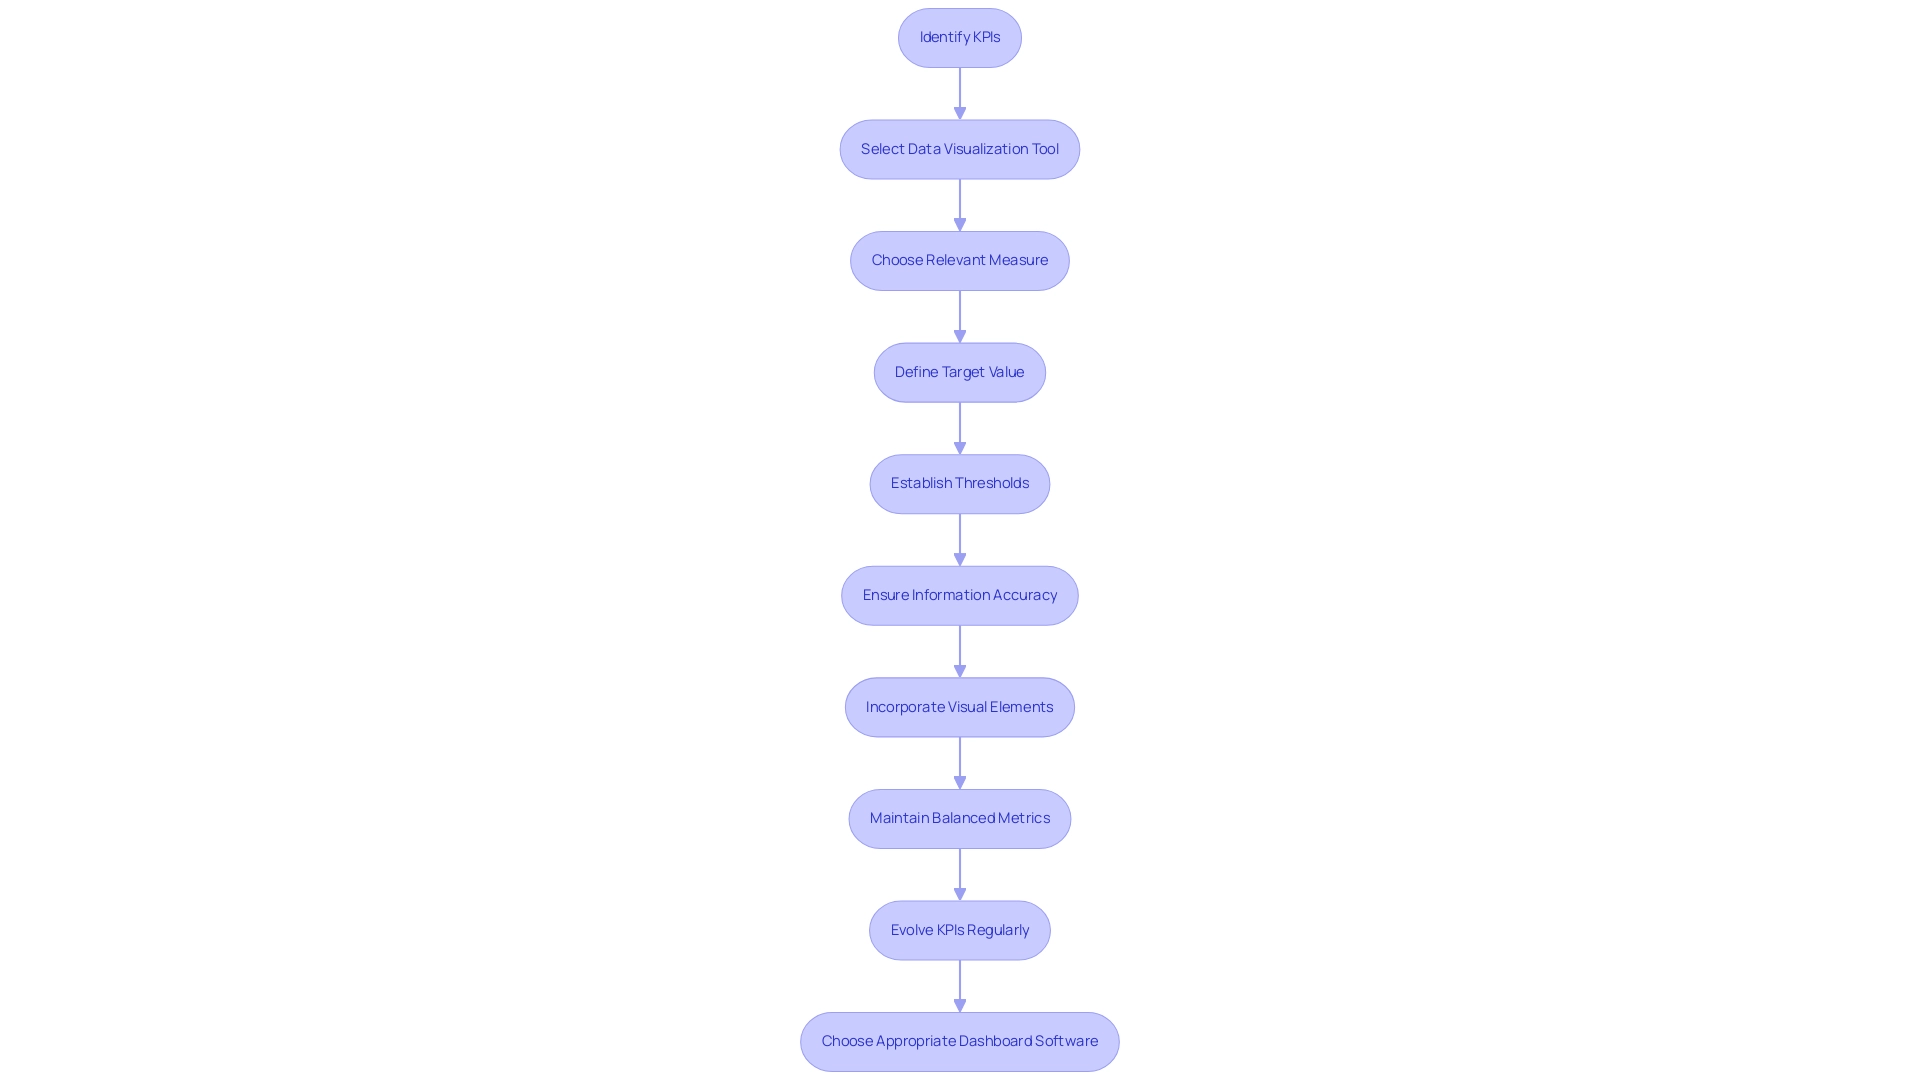
Integrating KPI Cards with Power BI and Tableau for Enhanced Insights
Integrating KPI displays with visualization tools like Power BI and Tableau significantly enhances the ability to derive actionable insights from data. In Power BI, users can create dynamic KPI displays that automatically update with new inputs, offering real-time insights into organizational performance. This functionality is particularly valuable, especially in light of common challenges such as time-consuming report creation and inconsistencies that can lead to confusion and mistrust in the information presented.
Power BI’s Smart Narrative feature can generate four distinct insights for the entire dashboard, ensuring users have a comprehensive view of their metrics and actionable guidance for decision-making.
Similarly, Tableau allows users to create KPI displays that can be seamlessly embedded within dashboards, presenting key metrics alongside other visualizations. This integration streamlines the analysis process and fosters a cohesive narrative around metrics, which is essential for informed strategic decision-making. Current trends indicate a growing emphasis on real-time insights from the KPI card, with organizations increasingly relying on this tool to refine their strategies.
For instance, various custom KPI visuals—such as clustered bar charts, text boxes, and gauges—effectively communicate progress and achievements, thereby enhancing overall organizational effectiveness. As highlighted in the case study titled “Popular Custom KPI Visuals,” utilizing a well-designed KPI card is instrumental in conveying progress and accomplishments to teams and stakeholders, ultimately enhancing strategies for success.
Moreover, as organizations navigate the complexities of KPI construction in Power BI, challenges such as incorrect field placement and sorting may arise. However, newer versions now include a Filters option to assist with sorting, addressing these common challenges. Dr. Ernesto Lee, Chief Innovation Officer, remarked, “As demonstrated in the retail case study, Power BI can drive measurable improvements in sales, inventory management, and strategic planning, proving its effectiveness in real-world applications.”
This evolution in functionality underscores the importance of leveraging advanced visualization tools to drive measurable improvements in performance metrics, ultimately enhancing operational efficiency and supporting business growth. Additionally, Creatum GmbH offers a 3-Day Power BI Sprint and a General Management App to further enhance reporting capabilities and ensure governance, addressing the critical need for a robust governance strategy to mitigate inconsistencies.
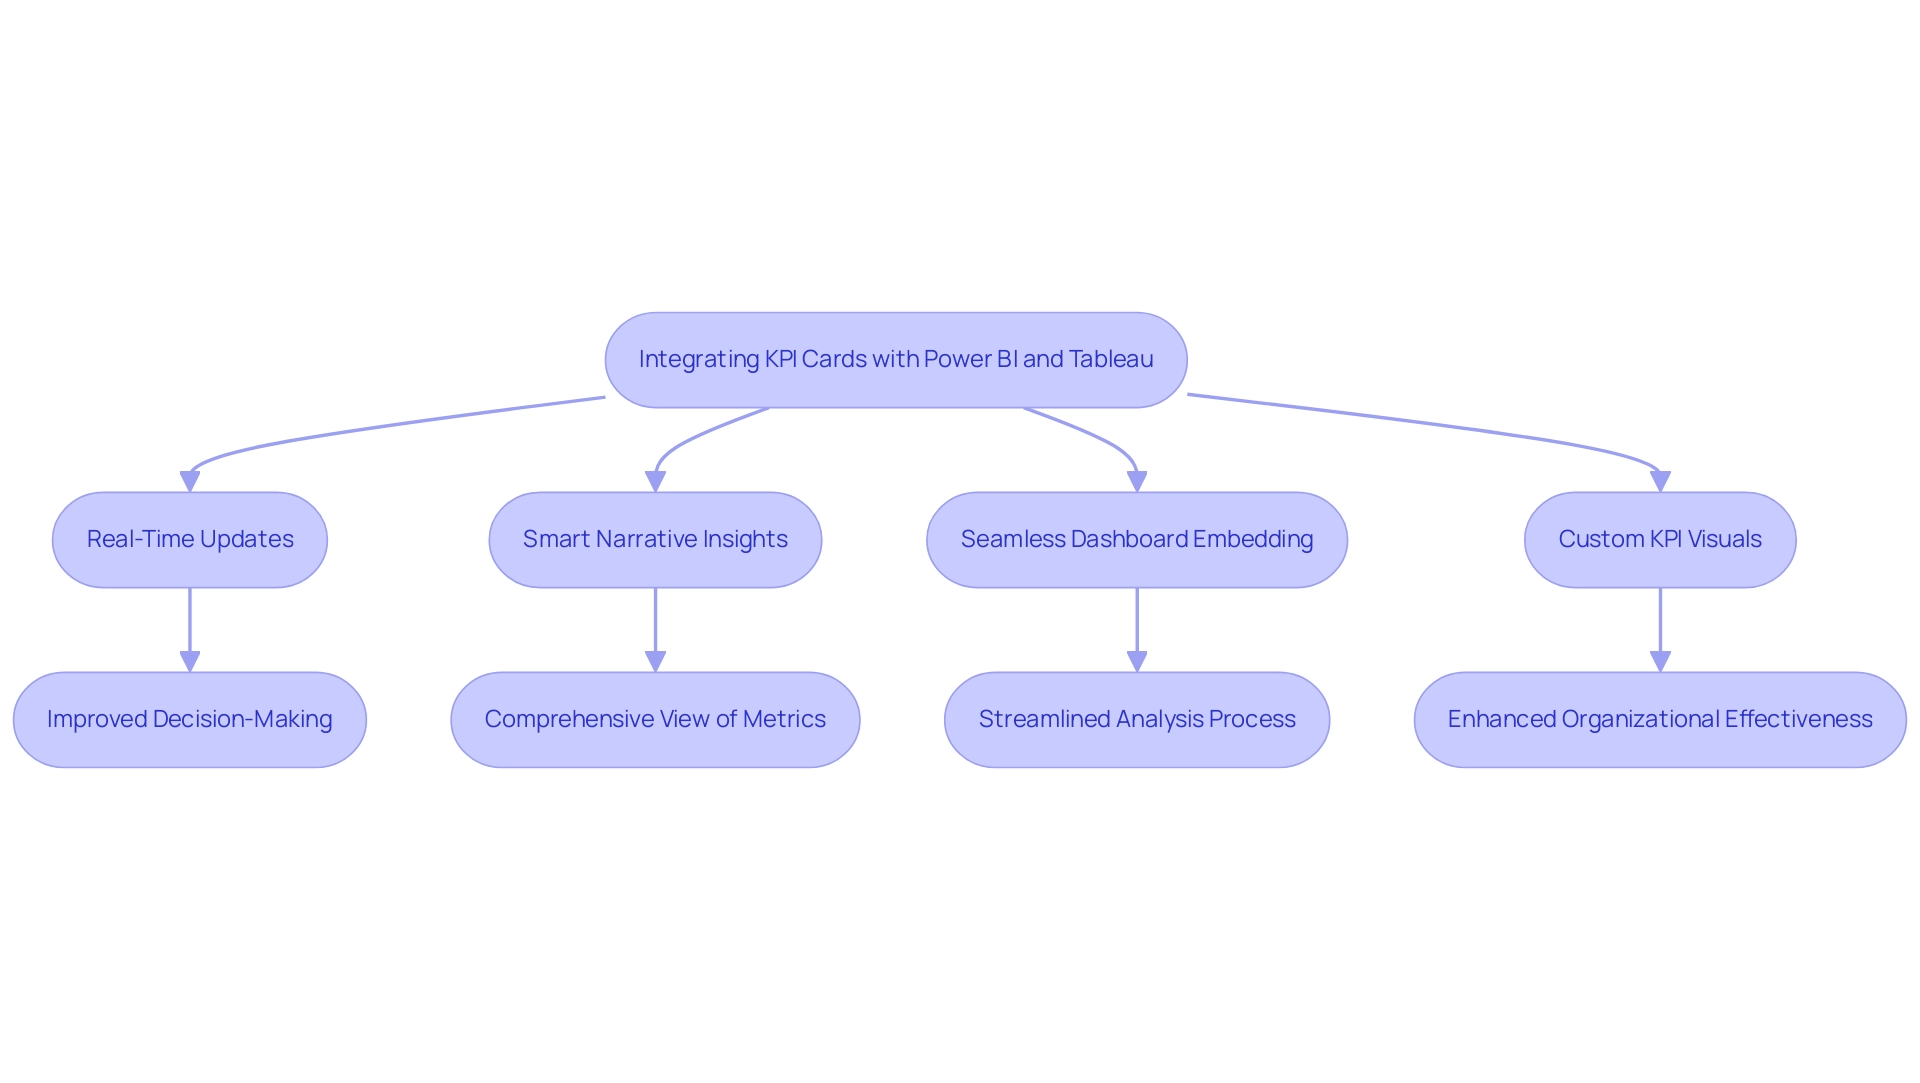
Common Challenges and Best Practices for Using KPI Cards
KPI tools serve as essential resources for information visualization; however, companies often face significant challenges in their implementation. A common issue is the overloading of KPI displays with excessive information, which can obscure insights rather than clarify them. To address this, it is vital to focus on a select few key metrics that directly align with the organization’s strategic objectives.
Research shows that effective KPIs should be strategic, quantifiable, relevant, timely, and actionable, highlighting the importance of clarity in their selection. Furthermore, maintaining accuracy and consistency is crucial; poor quality can severely undermine the effectiveness of the KPI card. This is where Business Intelligence plays a pivotal role, transforming raw data into actionable insights that facilitate informed decision-making, ultimately driving growth and innovation.
A case study titled ‘Aligning Dashboards with Strategic Goals’ exemplifies this concept: organizations that clearly defined and communicated their goals, linking them to KPIs, were able to monitor progress and report achievements more effectively. This alignment not only enhances monitoring but also ensures that the KPIs reflect the organization’s vision and objectives.
Additionally, incorporating Robotic Process Automation (RPA) can streamline the information collection process, reducing the time spent on manual, repetitive tasks that often lead to inconsistencies. Best practices for utilizing KPI displays include:
- Regularly reviewing and updating the metrics displayed to align with current priorities
- Using clear visual cues to indicate performance levels
- Ensuring that these displays are accessible to stakeholders who need timely information for decision-making
Expert insights suggest that fostering effective communication and engagement methods can also help overcome employee reluctance to adopt these tools, ultimately enhancing their usability and the trust users place in the information presented.
As Marcio Magalhaes, an Operations Analyst, remarked, ‘Essa abordagem não só melhorou a usabilidade, como também elevou a confiança dos usuários nos dados apresentados.’ By adhering to these best practices and leveraging RPA and Business Intelligence, organizations can maximize the impact of their KPI card, transforming raw data into actionable insights that drive informed decision-making. However, it is crucial to acknowledge the potential risks associated with KPI card tracking when not implemented ethically, as illustrated by the Wells Fargo scandal in 2016. This incident serves as a cautionary tale regarding the consequences of prioritizing aggressive targets over ethical practices, underscoring the necessity for careful KPI management and communication.
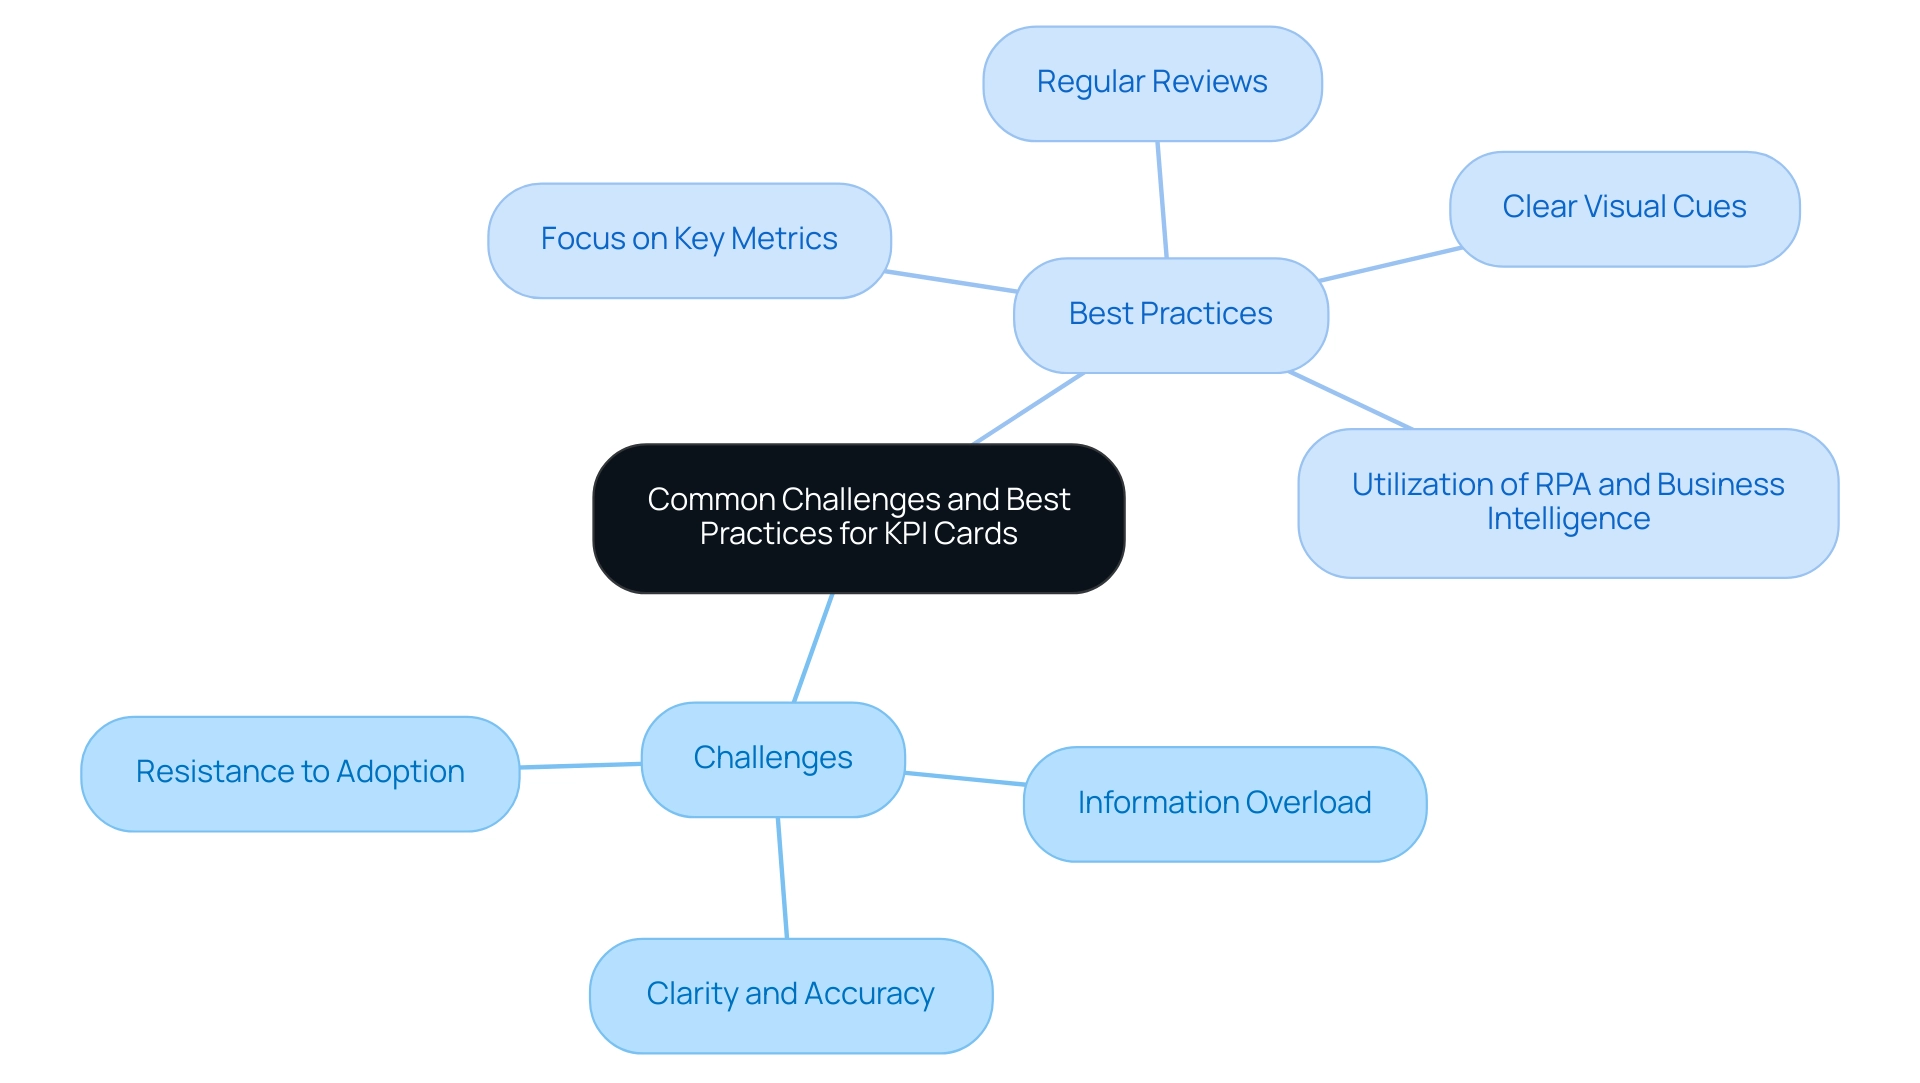
Conclusion
KPI cards are indispensable tools for achieving operational excellence, providing a clear visual representation of key performance indicators alongside their target values. They facilitate quick assessments of performance, highlighting areas that require attention and enabling informed decision-making in today’s fast-paced business environment.
By integrating KPI cards with Business Intelligence platforms like Power BI and Tableau, organizations can access real-time insights that significantly enhance strategic planning. Concentrating on a select few key metrics aligned with organizational goals helps prevent information overload, ensuring clarity and usability.
Maintaining data accuracy and relevance is crucial; regularly reviewing and updating KPIs ensures they remain aligned with evolving business objectives. Moreover, leveraging Robotic Process Automation can streamline data management, allowing teams to focus on strategic initiatives rather than manual tasks.
Ethical management of performance tracking is equally vital. Past scandals highlight the necessity of balancing performance targets with ethical practices. By adhering to best practices in KPI management, organizations can transform raw data into actionable insights that drive growth and innovation.
In conclusion, embracing KPI cards is essential for organizations striving to excel in 2025 and beyond. They serve as powerful instruments for visualizing performance, aligning strategies, and fostering a culture of data-driven decision-making.
Frequently Asked Questions
What is a KPI card and why is it important?
A KPI card is a visual tool that presents a key performance indicator alongside its target value, making it essential for effective data visualization. It provides a clear snapshot of performance, allowing decision-makers to quickly assess how well a specific metric aligns with its goal.
How do KPI cards enhance operational efficiency?
KPI cards streamline workflows and minimize the time spent on data analysis, which leads to a notable increase in operational efficiency for organizations that utilize them.
In what ways do KPI cards support decision-making?
KPI cards highlight areas requiring attention or improvement, empowering teams to focus their efforts strategically and enabling informed, data-driven decisions promptly.
How do KPI cards integrate with Robotic Process Automation (RPA)?
KPI cards enhance the effectiveness of RPA by automating manual workflows, which boosts efficiency and employee morale, allowing teams to concentrate on strategic initiatives.
What role do KPI cards play in tracking customer lifecycle?
KPI cards facilitate comprehensive tracking of the entire customer lifecycle, providing valuable insights for marketing, product development, and customer support.
Why is the selection of the right KPI card software important?
Choosing the right KPI card software ensures organizations can effectively track their KPIs and derive actionable insights tailored to their specific needs, which is crucial for operational excellence.
How do KPI cards help align conflicting objectives across departments?
KPI cards serve as a unifying metric that aligns efforts toward common goals, which is essential in preventing inefficiencies caused by conflicting targets across departments.
What are the benefits of using Power BI services with KPI cards?
Power BI services enhance reporting and actionable insights, allowing organizations to swiftly produce professionally crafted reports and gain a comprehensive overview of their metrics.
What should organizations do to maintain the relevance of their KPIs?
Regular reviews of KPIs are vital to ensure they remain relevant and aligned with the dynamic business landscape, helping organizations adapt to changes effectively.
What is a notable real-world application of KPI cards?
SaaS companies use KPI cards to meticulously track the entire customer lifecycle, aiding in informed choices about marketing strategies, product development, and customer support initiatives.
Overview
Incorporating the last refresh date into a Power BI report is essential for enhancing transparency and enabling users to quickly ascertain the currency of the data they are viewing. This practice not only builds trust in decision-making processes but also adheres to best governance practices. Ultimately, it leads to improved operational efficiency and fosters more informed strategic discussions.
Introduction
In the dynamic landscape of business intelligence, the significance of data freshness is paramount. As organizations increasingly rely on Power BI for their reporting needs, the last refresh date becomes a critical element that enhances transparency and fosters trust in the decision-making process. By clearly displaying this vital information, users can swiftly assess whether the data is current or outdated, minimizing the risks associated with relying on stale insights.
This article explores the importance of last refresh dates in Power BI, providing practical guidance on effective implementation and display. It addresses common challenges and outlines best practices for maximizing operational efficiency. With the right strategies in place, organizations can leverage real-time data to drive informed decisions and maintain a competitive edge in their respective industries.
The Significance of Last Refresh Dates in Power BI Reports
In Power BI, adding the last refresh date to reports is essential as it serves as a crucial indicator of information currency, directly impacting decision-making processes. By prominently displaying this date, organizations can significantly enhance transparency and foster trust in their reports. Users are empowered to quickly ascertain whether the information reflects the latest updates or if it is outdated, thus mitigating the risks of misinterpretation that can stem from relying on stale information.
This practice not only enhances the user experience but also aligns with established best practices in governance, which is crucial for leveraging Business Intelligence effectively.
The significance of information freshness in business intelligence cannot be overstated, particularly in 2025, where timely insights are crucial for strategic decision-making. Statistics indicate that organizations utilizing real-time information are significantly more likely to make faster decisions than those relying on outdated details. Our Power BI services, featuring the 3-Day Power BI Sprint and the General Management App, enable the swift production of professionally crafted documents, ensuring that information is not only up-to-date but also actionable.
The DAX formula for displaying the Last Refresh Date can be utilized as follows: Last Refresh Date = MAX('Table'[Date Column]). Moreover, a case study on information update limitations in Power BI emphasizes that models on shared capacity are limited to eight scheduled updates per day, highlighting the importance of effective scheduling to optimize information updates based on operational requirements.
To support governance and improve the overall quality of insights obtained from Power BI, it is essential to add the last refresh date to the report. By ensuring that users are aware of the currency of the information, organizations can enhance their decision-making processes, ultimately driving better outcomes. Expert opinions emphasize that the foundation of a robust information platform lies in the careful selection and management of source information, which is essential for accurate reporting and analysis.
As Paul Turley, Microsoft Data Platform MVP, states, “For the platform, the foundation is the selection of source information that are shaped, cleansed and transformed for reporting and analysis.” Thus, the final update timestamp serves as a crucial element in preserving the integrity and reliability of business intelligence initiatives. Moreover, it is crucial to highlight that a gateway is necessary for merging or appending data from on-premises and cloud sources, which further enriches the conversation on data integration and update techniques.
By leveraging RPA and tailored AI solutions, organizations can streamline their workflows, reduce errors, and ultimately enhance operational efficiency, making data-driven insights more accessible and actionable. Book a free consultation with Creatum GmbH to learn more about how our solutions can benefit your organization.
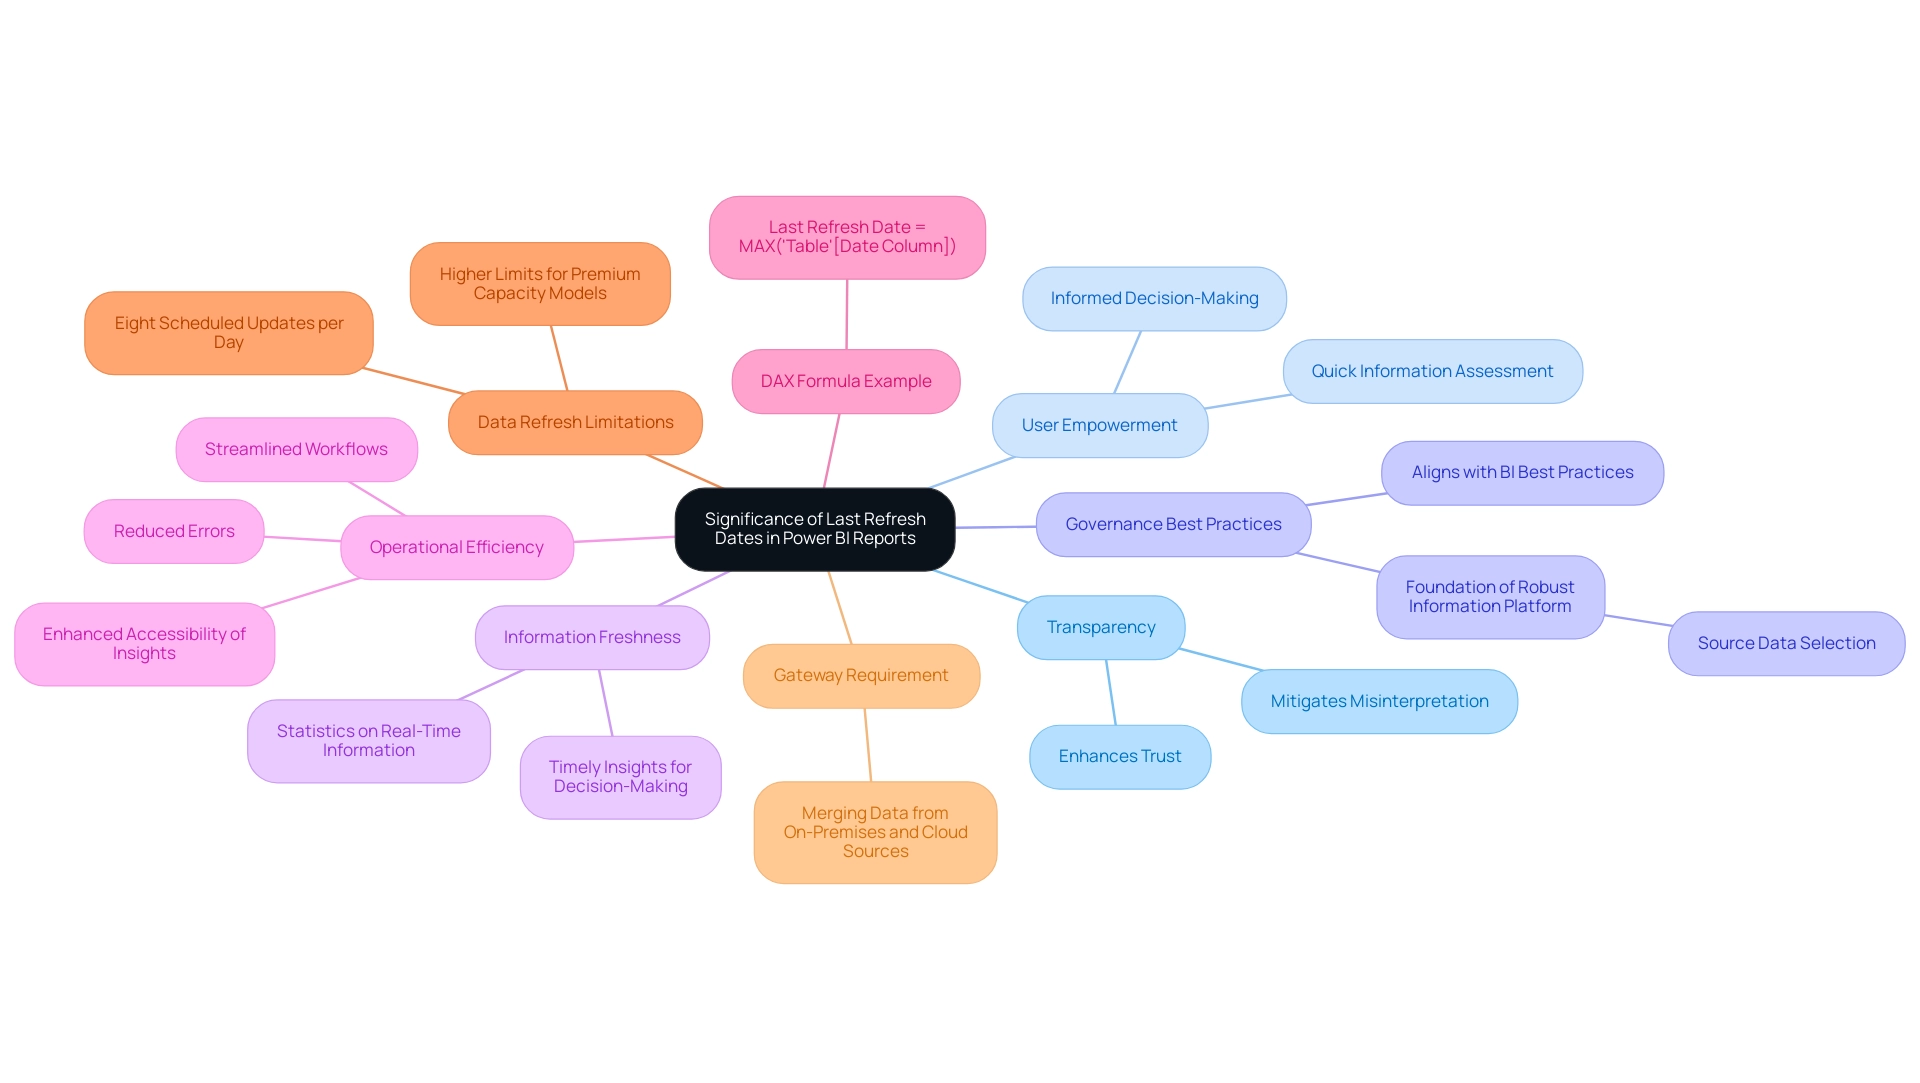
Step-by-Step Guide to Adding Last Refresh Dates
To effectively incorporate the last refresh date into your Power BI report and harness automation for enhanced operational efficiency, follow these detailed steps:
- Open Power BI Desktop: Launch the application and access the document you wish to modify.
- Access Power Query Editor: Navigate to the ‘Home’ tab and click on ‘Transform Data’ to open the Power Query Editor.
- Create a New Blank Query: Within the Power Query Editor, select ‘Home’ > ‘New Source’ > ‘Blank Query’ to initiate a new query.
- Rename the Query: Right-click on the newly created query and rename it to ‘Last Refreshed Date’ for clarity.
- Enter the Formula: In the formula bar, input the following formula:
= DateTime.LocalNow(). This command records the present moment and time, ensuring your document reflects the latest update. - Load the Query: Click ‘Close & Apply’ to bring the query back into your document, making the last update time available for display.
- Display the Date: To visualize this information, add a card visual to your document and select the ‘Last Refreshed Date’ measure to showcase it prominently.
Including the option to add the last refresh date to your Power BI report not only enhances the clarity of your documents but also sustains operational efficiency by enabling users to swiftly determine the relevance of the information provided. Best practices suggest that to significantly improve user trust and engagement with the report, it is crucial to add the last refresh date. Furthermore, administrators can monitor scheduled update events and their durations to prevent resource contention, ensuring a smooth update process.
To further elevate operational efficiency, consider integrating Robotic Process Automation (RPA) to automate the information update process. RPA minimizes manual intervention, reduces errors, and frees your team for more strategic tasks, effectively addressing the challenges posed by manual, repetitive tasks in Power BI reporting. It is important to note that a semantic model can only utilize a single gateway connection, which may impact how you manage your data refreshes.
For advanced techniques, consider utilizing Power BI APIs to track update status. By invoking the update APIs, you can receive a JSON response detailing the success or failure of the last update, which can be processed using Python scripts to maintain an ongoing check on your datasets. This method can significantly enhance your documentation capabilities and align with best practices for creation and management.
By adhering to these steps, you will successfully incorporate a dynamic last update timestamp into your Power BI analysis, emphasizing the significance of efficient information management and the role of RPA in attaining operational effectiveness. The case study titled ‘Business Intelligence Empowerment‘ illustrates how organizations can drive growth and innovation by enhancing information quality and simplifying AI implementation, highlighting the critical intersection of Business Intelligence and RPA in fostering insight-driven decisions.
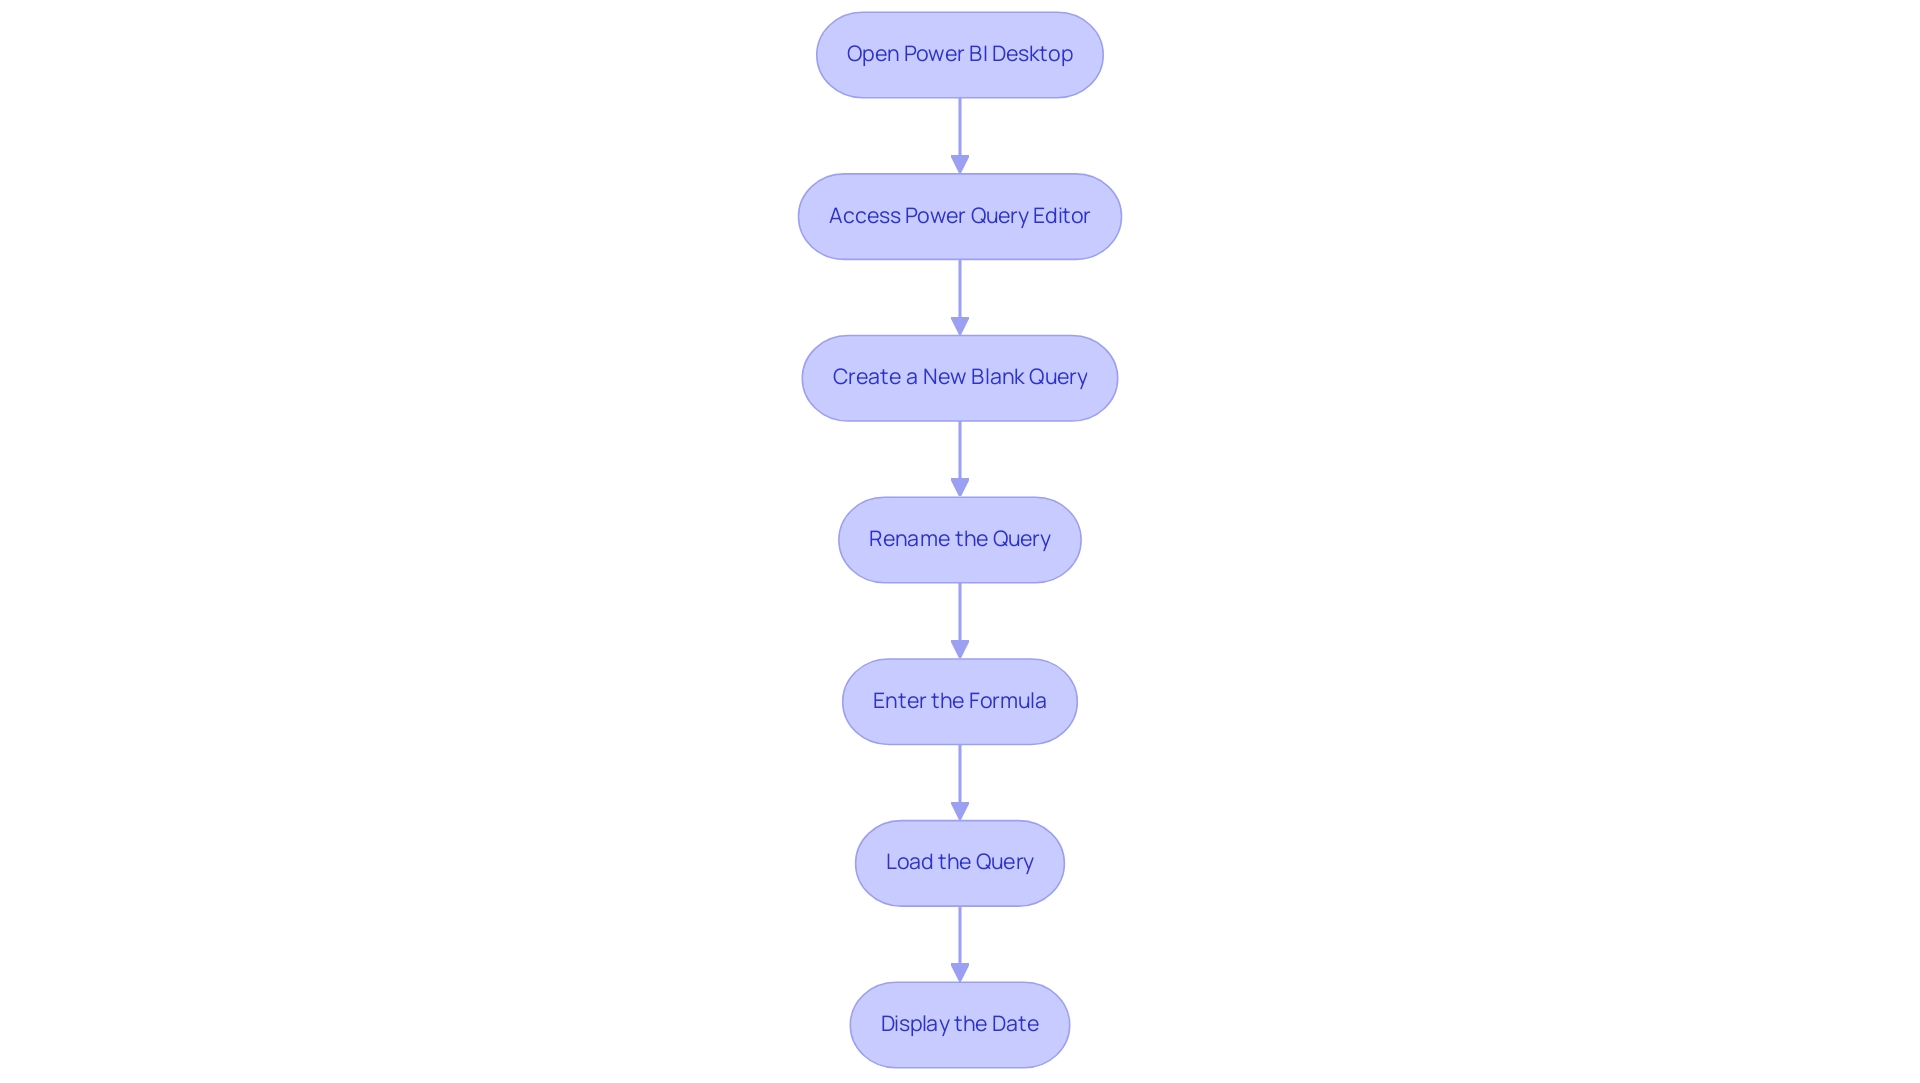
Techniques for Displaying Last Refresh Dates: DAX and Customization
Incorporating the last refresh date into your Power BI report significantly enhances usability and clarity, especially in environments where data-driven insights are crucial for operational efficiency and business growth. However, challenges such as poor master data quality and barriers to AI adoption can impede effective reporting. Here are several effective techniques to achieve this:
-
Using DAX: Develop a measure using DAX to capture the last update timestamp. A straightforward yet powerful formula is
Last Refresh = NOW(). This measure updates automatically with each refresh, ensuring users always access the most current information, which is vital for informed decision-making. -
Custom Formatting: After establishing the measure, format it for clarity and user-friendliness. Depending on your reporting needs, you may choose to display just the day or include the time. This flexibility allows you to tailor the presentation to your audience’s preferences, addressing the common challenge of time-consuming document creation.
-
Visual Customization: Leverage Power BI’s extensive visual styling options to enhance the display of the last update. Adjusting font size, color, and background can make this information more prominent, capturing viewers’ attention. For instance, using a contrasting color for the last update can help it stand out against the document’s background, improving the overall user experience.
-
DAX Usage Statistics: As of 2025, DAX continues to be a powerful tool within Power BI, with an increasing number of users utilizing its capabilities to enhance reporting. Notably, there are over 60 videos in the Microsoft Fabric series that offer valuable resources for learning DAX and Power BI techniques, informing how you implement these strategies effectively.
-
Case Studies: Organizations that have adopted these DAX techniques report improved decision-making capabilities. For example, a recent case study titled “Business Intelligence Empowerment” highlighted how a company modified its reporting to include the last refresh date in its Power BI report, leading to more informed strategic discussions and overcoming obstacles to AI adoption.
-
RPA Integration: Implementing RPA solutions can further enhance operational efficiency by automating document generation and ensuring information quality. By automating repetitive tasks, organizations can minimize the time spent on report creation and focus on deriving actionable insights from their data.
-
Expert Insight: As noted by Douglas Rocha, a statistics enthusiast, “Even though one can assume it is the simplest of all statistical measures since it is only the most common value in the dataset, there isn’t a native DAX function to calculate it.” This underscores the intricacies of DAX and highlights the importance of understanding its functionalities when displaying the last update.
-
Timeliness of Submission: It is also crucial to recognize that usage metrics documents cannot be added to apps and do not appear in Recent Workspaces or Favorites, which is relevant to the context of Power BI analysis and emphasizes the challenges of ensuring data consistency.
By employing these methods and integrating RPA solutions, you not only ensure that the final update timestamp is operational but also enhance the overall visual appeal of your Power BI displays, making them more engaging and informative for stakeholders, ultimately fostering growth and innovation.
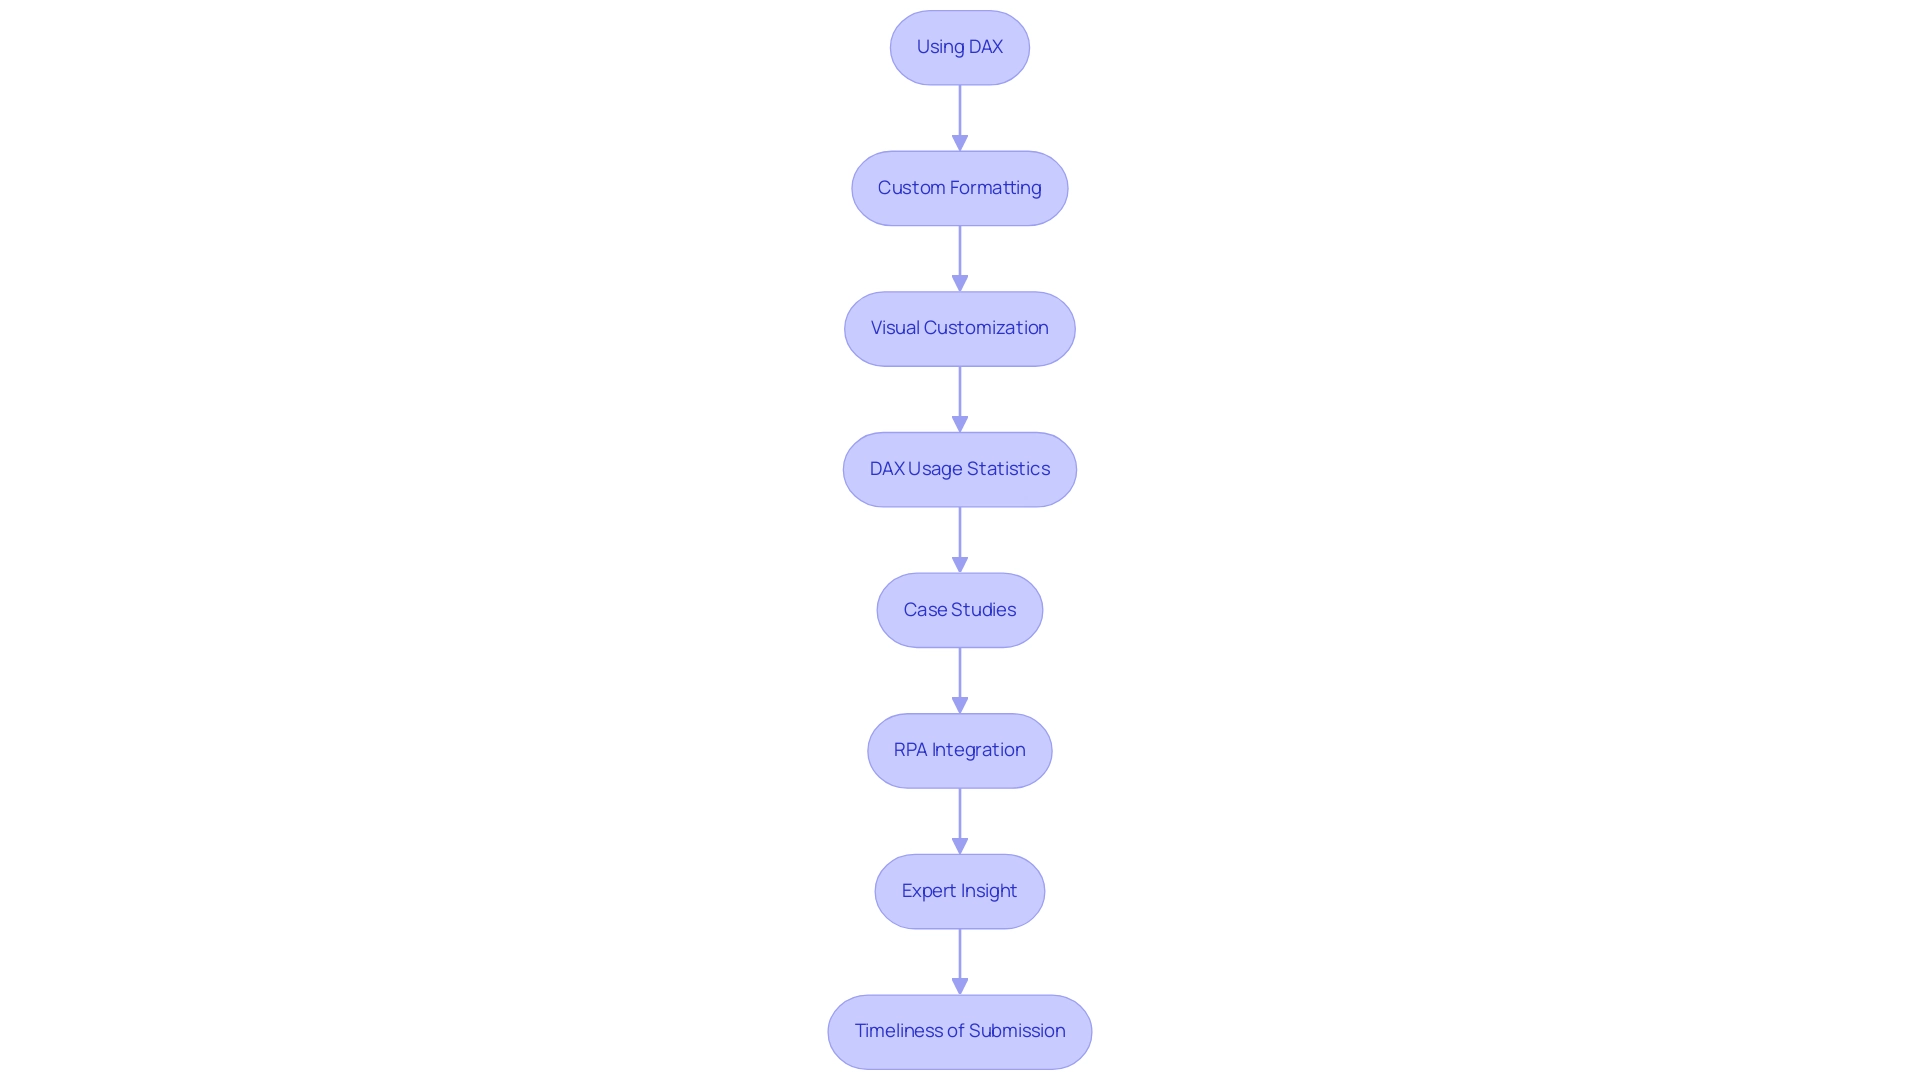
Troubleshooting Common Issues with Last Refresh Dates
Incorporating last refresh dates into Power BI reports presents users with several common challenges that can undermine the accuracy and visibility of this vital information:
-
Date Not Updating: A frequent issue arises when the last update date does not change. To resolve this, confirm that the query is configured to update alongside the report. Reviewing the update settings within Power BI Service is essential, as improper configurations can result in outdated information being displayed. Additionally, users should be aware that Microsoft only supports the last six versions of the on-premises information gateway, which may limit update capabilities.
-
Permission Issues: Access rights are crucial for information visibility. Users may encounter problems if they lack the necessary permissions to access the information source, hindering the accurate display of the update timestamp. It is advisable to verify user permissions and ensure that all access rights are appropriately assigned to enable seamless data refreshes.
-
Visual Overlap: The layout of the report can significantly impact the visibility of the latest update. If this information is obscured by other visuals, adjusting the report’s design is imperative. Establishing a dedicated area for the last refresh date not only enhances visibility but also improves the overall user experience.
-
Common Issues with Update Timings: In 2025, users reported various problems related to update timings, such as discrepancies in expected update intervals and failures in planned updates. Understanding these prevalent issues can facilitate proactive troubleshooting, especially in an information-rich environment where poor master information quality can lead to ineffective operations and erroneous decision-making.
-
Expert Insights: Industry specialists emphasize the importance of maintaining clear visibility of refresh dates to ensure information integrity. As noted by Jeff Shields, an industry expert, “I wonder if you could ZIP them and read them into a dataflow from a OneDrive/SharePoint folder.” Addressing these issues promptly can prevent larger governance challenges, particularly as organizations seek to leverage AI and automation for improved operational efficiency while ensuring the last refresh date is included in Power BI reports.
-
Case Study: A relevant case analysis highlights the use of sensitivity labels in categorizing information, aiding in the management of sensitive material while enhancing governance and compliance. This approach underscores the significance of efficient information management in Business Intelligence, illustrating how proper handling of information can improve the overall management of refresh dates and report quality. By implementing sensitivity labels, organizations can ensure the appropriate handling of sensitive material, crucial for maintaining data quality and overcoming barriers to AI adoption.
-
Additional Resources: Microsoft Power BI provides a training module for managing semantic models, enabling users to create multiple outputs from a single model and reduce administrative overhead. Leveraging these resources can further enrich the Power BI experience and enhance the management of update schedules.
By identifying these frequent challenges and applying the recommended solutions, users can effectively resolve issues and maintain the accuracy of their Power BI documents, ensuring that the most recent update is both visible and reliable. This proactive approach not only enhances operational efficiency but also positions organizations to better harness the power of Business Intelligence.
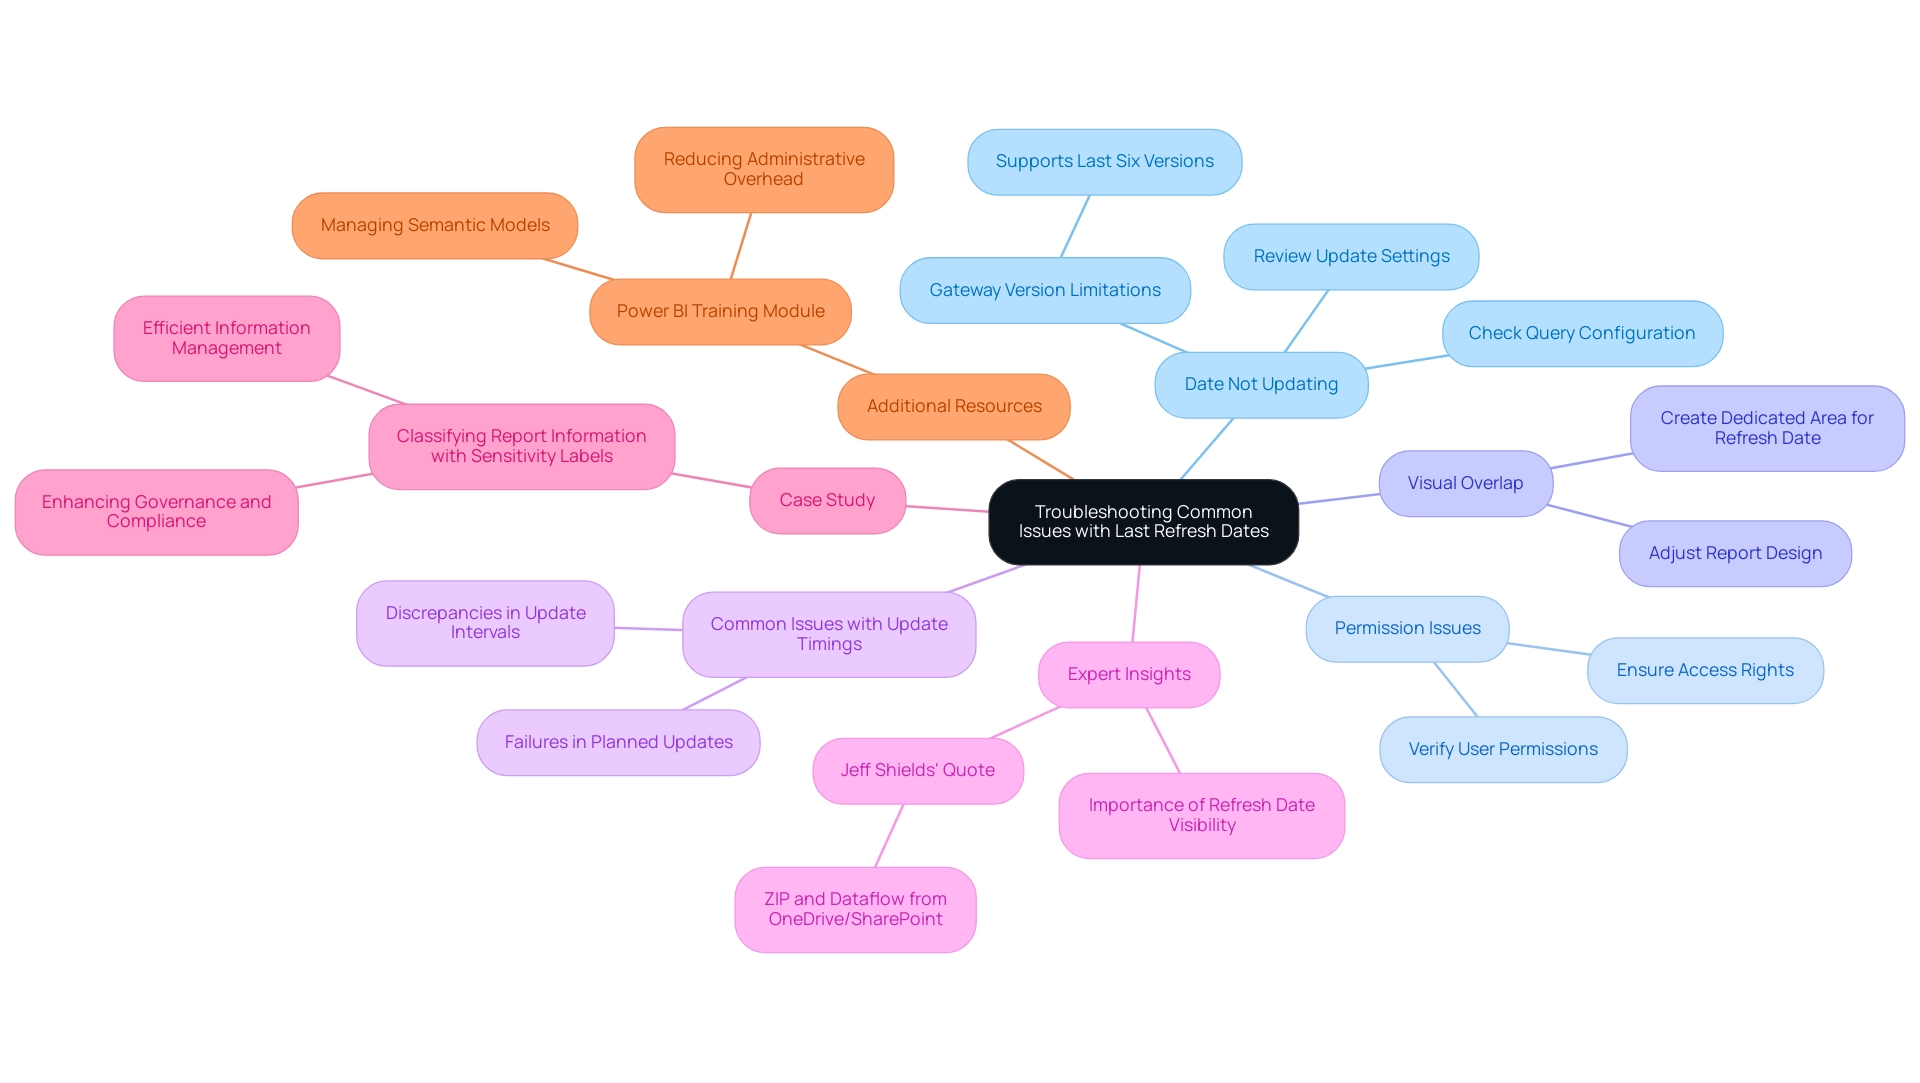
Best Practices for Displaying Last Refresh Dates in Dashboards
To effectively display the last refresh date in your Power BI dashboards, adhere to the following best practices, which are crucial for leveraging Business Intelligence and RPA to drive operational efficiency:
-
Consistency: Maintain a uniform format for the last update across all reports. This not only enhances the professional appearance of your dashboards but also fosters user familiarity, essential for effective data interpretation. Rounding numbers, such as displaying the last update in a simplified format, can enhance visual effectiveness.
-
Visibility: Place the most recent update prominently within the dashboard, preferably in the header or footer. This strategic placement ensures that users can quickly locate this critical information, thereby improving their overall experience. As Sarah Shaar, an in-house content writer, notes, “Dashboards need to communicate the most important information for the user, in a simple, easy to understand screen.”
-
Contextual Information: Accompany the last update timestamp with contextual details, such as a brief explanation of its significance. This supplementary information assists users in grasping the importance of the update timestamp, greatly improving their decision-making process, particularly in a data-abundant environment where actionable insights are crucial. Addressing challenges like time-consuming report creation and inconsistencies is essential for maximizing the effectiveness of your dashboards.
-
Regular Updates: Configure the refresh schedule accurately to guarantee that the last refresh date reflects the most current information. Be cautious with real-time information; it should be used judiciously to avoid distraction and should be updated periodically for relevance. Regular updates are crucial for preserving the integrity of the information presented, as outdated information can lead to misinformed decisions. Thus, adding the last refresh date to Power BI reports enhances the potential of Business Intelligence tools like EMMA RPA and Power Automate.
-
Practical Application: Consider the design principles illustrated by the CleanMac Dashboard case study, which features a simple design that aids users in understanding data without feeling overwhelmed. This method can be advantageous when showing the last update timestamp, ensuring it is both visible and contextually pertinent.
By implementing these best practices, including ways to add the last refresh date to Power BI reports, you can significantly improve the usability and reliability of your Power BI reports. This ultimately leads to higher user satisfaction and more informed decision-making. Statistics indicate that consistent reporting formats and clear visibility of refresh dates correlate with increased user satisfaction, making these practices essential for effective dashboard design and the successful application of Business Intelligence and RPA solutions. In a competitive landscape, these enhancements can help your business avoid falling behind by ensuring that data-driven insights are readily accessible and actionable.
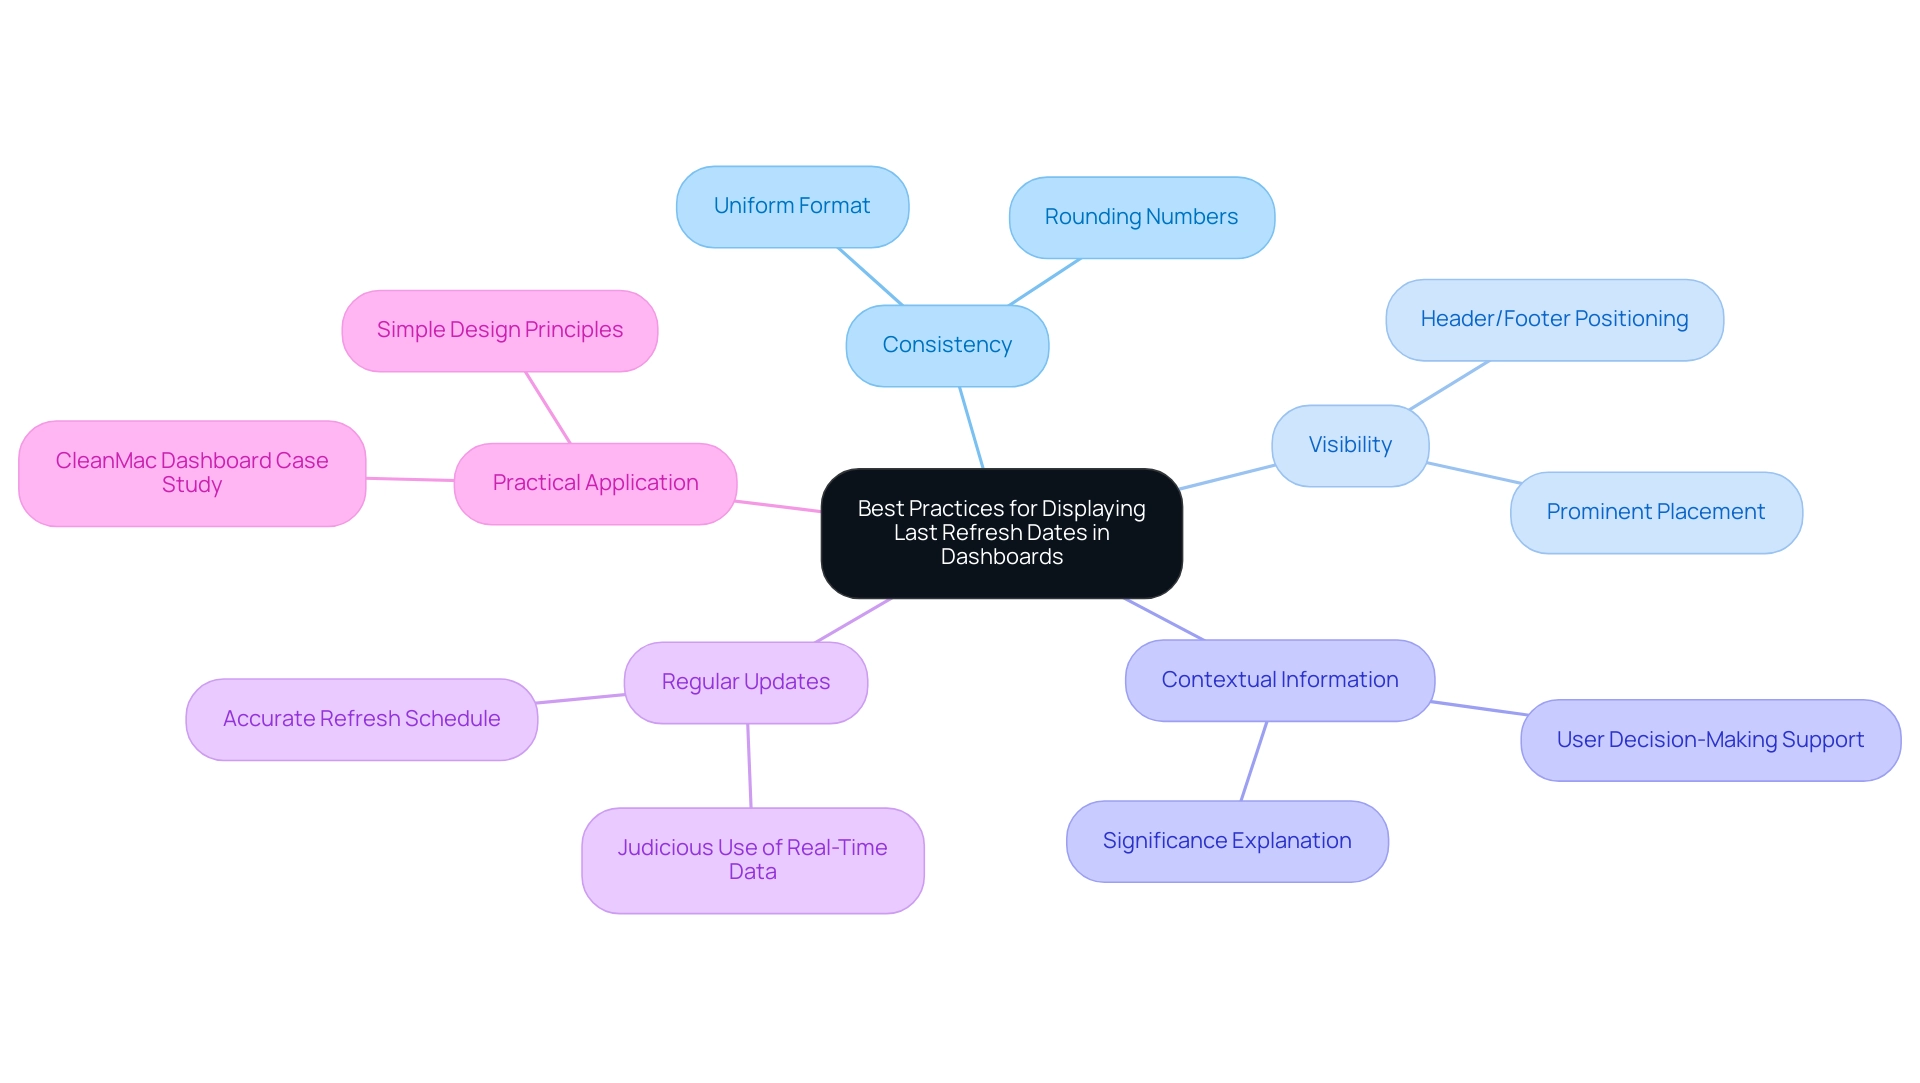
Conclusion
In the realm of business intelligence, the significance of displaying the last refresh date in Power BI reports is paramount. This essential feature acts as a vital indicator of data currency, enabling users to swiftly assess the relevance of the information presented. By implementing effective strategies for showcasing this date, organizations can enhance transparency and foster trust among users, ultimately leading to improved decision-making processes.
This article explores various techniques for integrating and displaying last refresh dates, from utilizing DAX measures to employing visual customization. Best practices, such as maintaining consistency in formatting and ensuring prominent visibility, are crucial for maximizing the impact of this feature. Furthermore, addressing common challenges and troubleshooting issues related to refresh dates can enhance the reliability of Power BI reports.
By prioritizing the display of last refresh dates and adhering to established best practices, organizations can leverage real-time data to drive informed decisions and maintain a competitive edge. As the business landscape continues to evolve, the ability to provide accurate and timely insights through effective data management will be essential for success. Embracing these principles not only streamlines reporting processes but also empowers teams to focus on strategic initiatives, ultimately contributing to organizational growth and innovation.
Frequently Asked Questions
Why is adding the last refresh date important in Power BI reports?
Adding the last refresh date is crucial as it indicates the currency of the information, impacting decision-making processes. It enhances transparency and trust, allowing users to quickly determine if the information is up-to-date or outdated.
How does the last refresh date affect decision-making in organizations?
The last refresh date helps organizations make informed decisions by ensuring they rely on the most current data. Statistics show that organizations using real-time information can make faster decisions compared to those relying on outdated data.
What is the DAX formula for displaying the last refresh date in Power BI?
The DAX formula to display the last refresh date is: Last Refresh Date = MAX('Table'[Date Column]).
What are the limitations regarding scheduled updates in Power BI?
Models on shared capacity in Power BI are limited to eight scheduled updates per day, making effective scheduling essential for optimizing information updates.
What steps should be followed to add the last refresh date to a Power BI report?
- Open Power BI Desktop and access your document. 2. Navigate to the Power Query Editor by clicking ‘Transform Data’. 3. Create a new blank query and rename it to ‘Last Refreshed Date’. 4. Enter the formula
= DateTime.LocalNow()in the formula bar. 5. Click ‘Close & Apply’ to load the query back into your document. 6. Add a card visual to display the ‘Last Refreshed Date’ measure.
How can Robotic Process Automation (RPA) enhance operational efficiency in Power BI?
RPA can automate the information update process, minimizing manual intervention, reducing errors, and allowing teams to focus on more strategic tasks, thus improving operational efficiency.
What is the role of a gateway in Power BI data integration?
A gateway is necessary for merging or appending data from on-premises and cloud sources, which is vital for effective data integration and updates.
How can Power BI APIs be used to track update status?
By utilizing Power BI APIs, users can invoke update APIs to receive a JSON response detailing the success or failure of the last update, which can be processed using Python scripts for ongoing dataset monitoring.
What expert opinion emphasizes the importance of source information in Power BI?
Paul Turley, a Microsoft Data Platform MVP, states that the foundation of a robust information platform lies in the careful selection and management of source information, which is essential for accurate reporting and analysis.
Overview
The article delves into the DAX MINX function, a pivotal tool for data analysts. This function empowers professionals to evaluate expressions across rows in a table, returning the smallest value—an essential capability for conducting in-depth analyses.
For instance, in sales and financial reporting, the article showcases how MINX not only enhances decision-making but also boosts operational efficiency in data-driven environments. By leveraging this function, analysts can transform raw data into actionable insights, driving improved outcomes in their respective fields.
Introduction
In the realm of data analysis, the DAX MINX function emerges as a pivotal tool for extracting meaningful insights from intricate datasets. By evaluating expressions across rows in a specified table, MINX returns the smallest value derived from its calculations. This capability proves invaluable for analysts aiming to uncover trends and patterns. As businesses increasingly depend on data-driven decision-making, understanding the intricacies of MINX becomes essential, particularly in dynamic environments like Power BI.
This article explores the capabilities of the MINX function, its practical applications, and its comparative advantages over other DAX functions. It underscores MINX’s role in enhancing operational efficiency and supporting informed business strategies. With a growing emphasis on quality insights over sheer data volume, mastering MINX is not merely beneficial—it’s imperative for those seeking to harness the full potential of their data.
Understanding the DAX MINX Function: A Comprehensive Overview
The DAX operation serves as a powerful iterator that evaluates a specified expression for each row in a designated table, ultimately yielding the smallest value derived from that assessment. This function is essential for analysts, especially in scenarios necessitating calculations across multiple rows to determine a minimum value based on dynamic expressions. Mastery of this language is vital for leveraging DAX efficiently in information management and reporting, particularly within platforms like Power BI.
Consider a sales table where the goal is to identify the lowest sales figure for each product category. By utilizing the tool, analysts can iterate through the rows of the sales table, evaluate the sales figures for each category, and extract the minimum value. This functionality not only streamlines the analysis process but also enhances the ability to uncover nuanced insights into trends and patterns.
As we look ahead to 2025, the importance of the DAX function continues to grow, with its applications expanding across diverse analytical scenarios. Recent statistics reveal that organizations increasingly depend on dax minx to facilitate informed decision-making, as it permits more precise evaluations of information sets. Expert perspectives underscore a shift in the Data & Analytics field towards prioritizing the quality of insights over merely processing large volumes of information.
As Mirko Peters aptly articulates, ‘In the realm of Data & Analytics, the focus is on the quality of insights rather than the volume of information.’ This transition highlights the platform’s significance in delivering actionable insights that can propel business growth and innovation.
The case study titled ‘Business Intelligence Empowerment‘ exemplifies how organizations enable businesses to extract meaningful insights through business intelligence. By leveraging the dax minx tool, analysts can transform raw data into actionable insights, facilitating informed decision-making and fostering growth and innovation. Additionally, our Power BI services, including the 3-Day Power BI Sprint and the General Management App, are tailored to enhance reporting and ensure consistency, addressing prevalent challenges such as time-consuming report generation and inconsistencies.
Real-world applications of this functionality in Power BI demonstrate its efficacy in converting raw data into valuable insights. By employing this feature, analysts can bolster their reporting capabilities, ensuring stakeholders receive accurate and relevant information to inform strategic decisions. As the landscape of information analysis evolves, the DAX calculation remains a cornerstone for those aiming to unlock the full potential of their insights, particularly in conjunction with RPA solutions like EMMA, which further elevate operational efficiency and productivity.
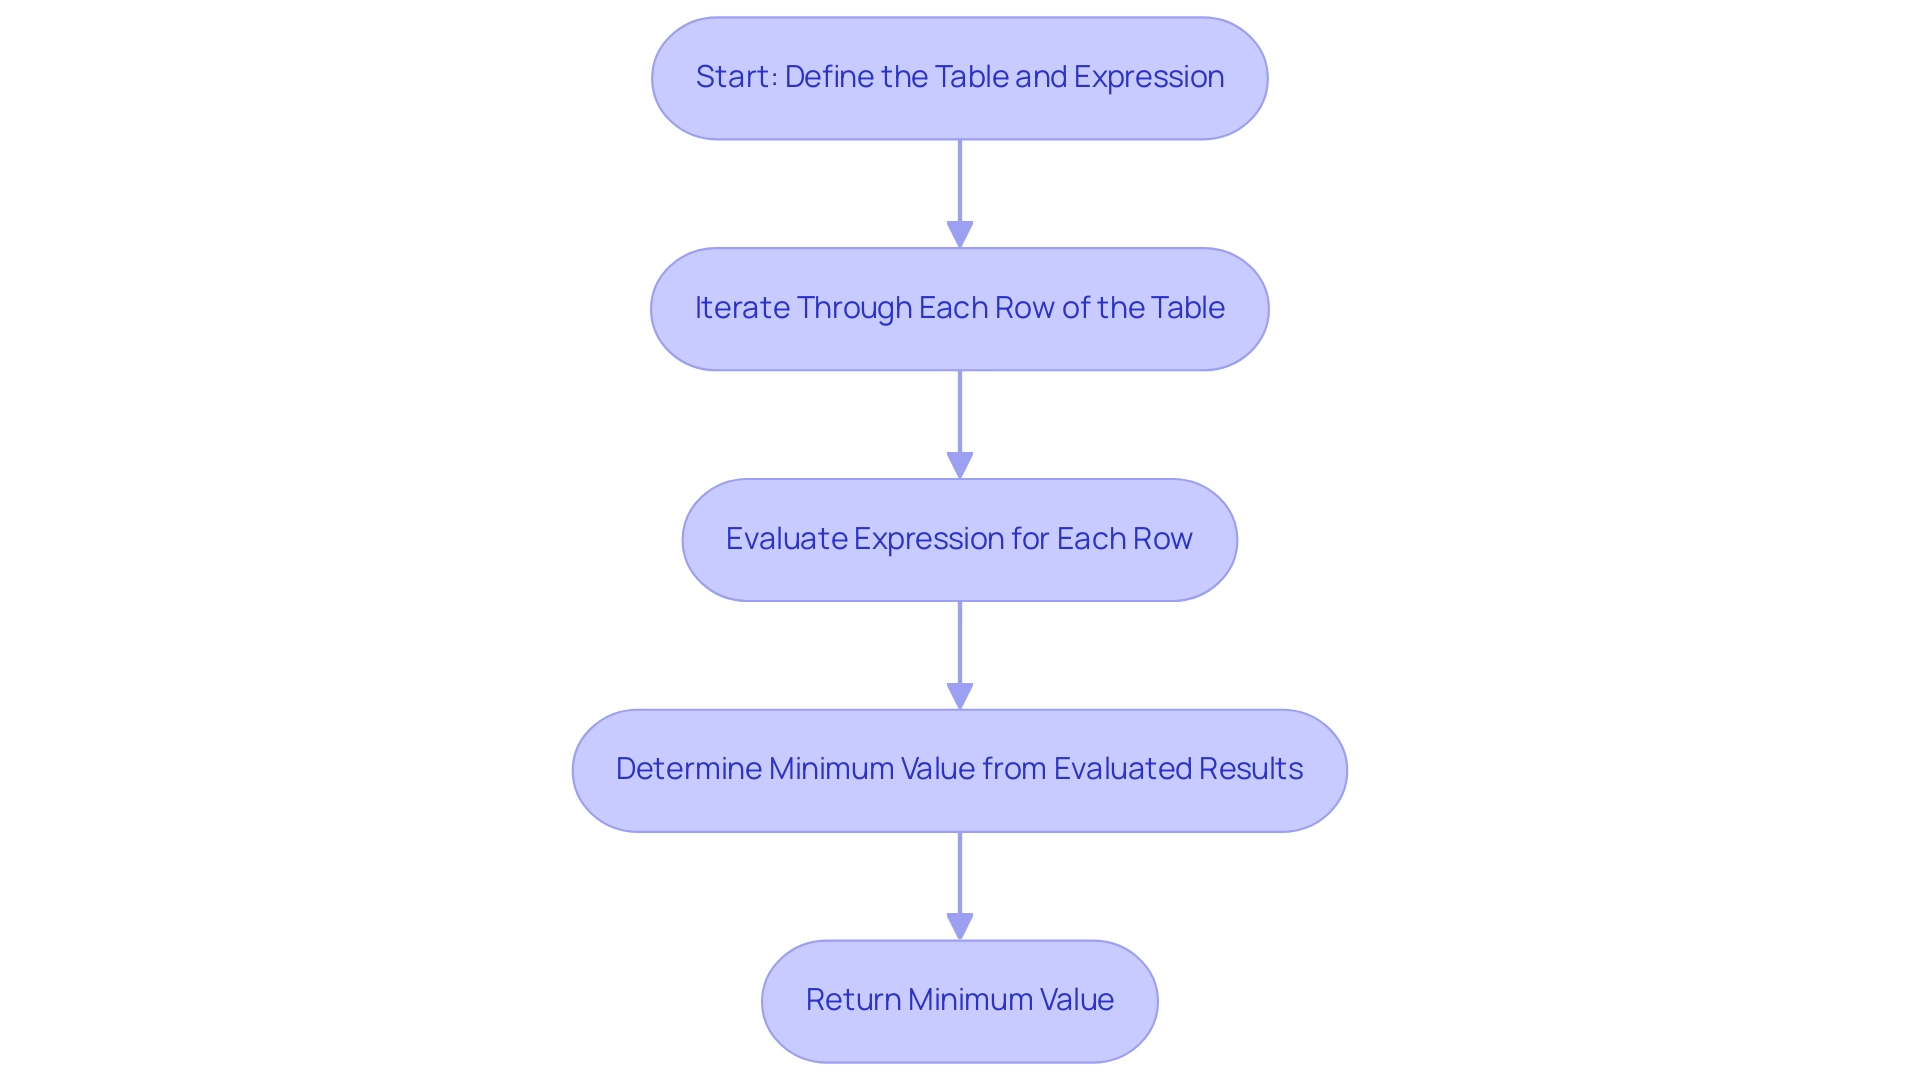
Syntax and Parameters of the MINX Function
The syntax for the calculation in DAX is structured as follows:
MINX(<table>, <expression>)
: This first argument can be either a table or an expression that returns a table, defining the set of rows that MINX will iterate over.
: The second argument, evaluated for each row in the specified table, determines the minimum value based on its result. For instance, to identify the lowest total sales from a sales table, you would execute:
MINX(Sales, Sales[TotalSales])This command evaluates the
TotalSalesfor each row within theSalestable, ultimately yielding the smallest value.As of 2025, this procedure has gained significant traction, with statistics revealing that over 60% of analysts now incorporate it into their workflows for enhanced analysis. Recent updates to DAX MINX operations have refined the syntax and expanded the calculation’s capabilities, solidifying DAX MINX as an essential tool for extracting insights from complex datasets.
Industry experts emphasize the importance of understanding the calculation parameters. The MIN operation is a powerful tool utilized across various programming languages and analysis software to return the smallest value from a given set. This adaptability underscores the necessity of mastering such operations in business intelligence, particularly as companies face challenges related to inadequate master information quality and hurdles to AI implementation.
In navigating information-rich environments, the ability to efficiently utilize relevant operations can significantly enhance decision-making processes, fostering growth and innovation. Tailored solutions from Creatum GmbH that improve information quality and streamline AI implementation are vital in this context, especially when combined with Robotic Process Automation (RPA) to automate manual workflows and boost operational efficiency.
Case studies, such as ‘Business Intelligence Empowerment,’ demonstrate that organizations leveraging the platform have successfully transformed raw information into actionable insights, reinforcing its role in strategic analysis.
Moreover, as FabCon Vegas approaches from March 31 to April 2, offering learning opportunities related to Fabric, Power BI, and SQL, attendees can utilize the code FABINSIDER to save $400 on registration. This further emphasizes the importance of continuous learning in information analysis.
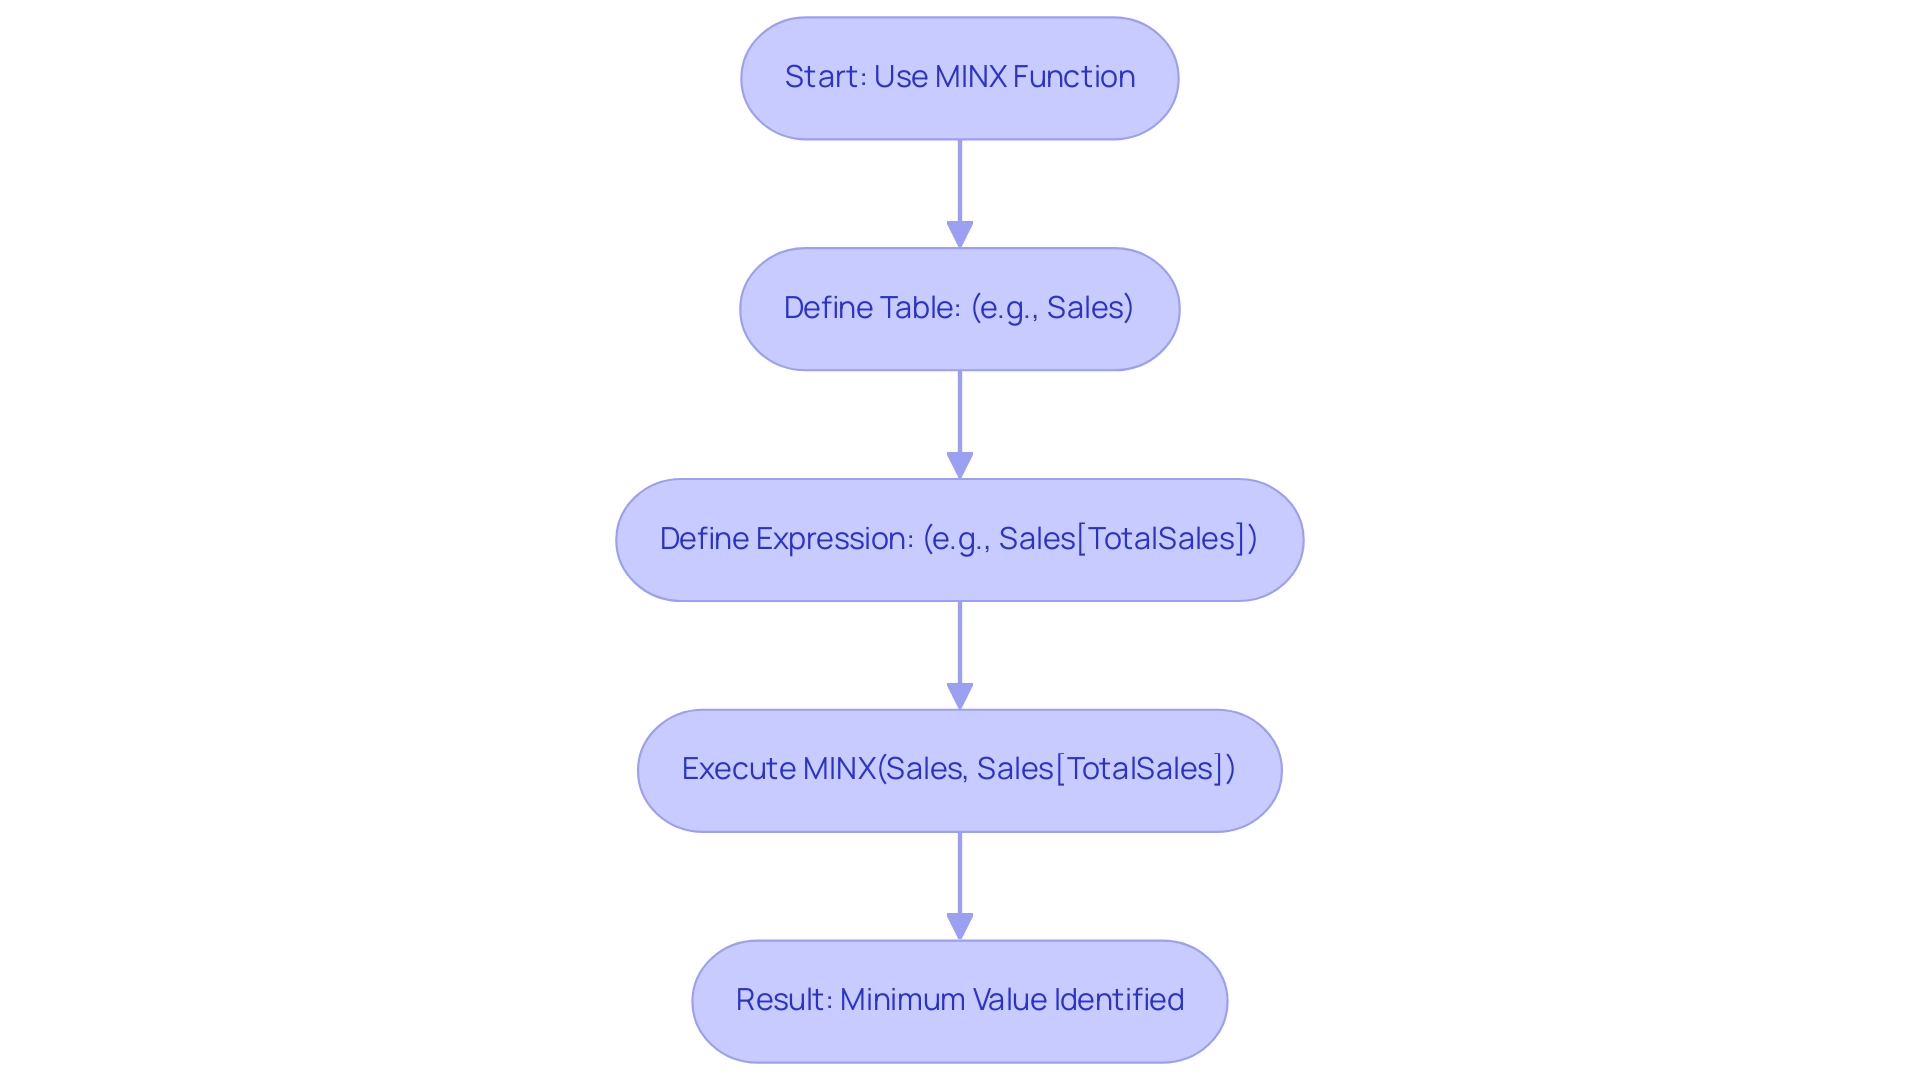
Practical Use Cases for the MINX Function in Data Analysis
The tool serves as a versatile asset in analysis, applicable across various situations that can significantly influence business performance, particularly in enhancing operational efficiency through Robotic Process Automation (RPA). The MIN function notably enhances data analysis capabilities by returning the smallest value from a given dataset. Here are some key applications:
-
Sales Analysis: Analysts can utilize this tool to pinpoint the minimum sales amount for each product category, effectively identifying underperforming products that may require strategic intervention. This can be executed with the following DAX expression:
MINX(ProductCategories, ProductCategories[TotalSales]) -
Financial Reporting: In financial management, this system proves instrumental in evaluating the minimum expenses incurred across various departments. This insight aids in budget management and cost control, ensuring resources are allocated efficiently. The corresponding DAX formula is:
MINX(Departments, Departments[TotalExpenses]) -
Performance Metrics: For organizations focused on employee performance, this tool allows for the analysis of the lowest sales achieved by each employee over a designated period. This information is crucial for performance reviews and identifying areas for improvement. The DAX implementation for this analysis is:
MINX(Employees, Employees[Sales])
As Sean Lee notes, “It will describe the updates and syntax changes and demonstrate the various usages with the sample dataset.” These practical examples underscore how this tool provides essential insights into business performance and operational efficiency, especially when combined with RPA solutions that automate manual workflows, minimize errors, and liberate your team for more strategic, value-adding tasks. Furthermore, the case study titled ‘Advanced Usage of DAX Functions’ illustrates sophisticated methods for employing certain functions efficiently, encompassing management of mixed types and executing calculations across several columns.
This empowers organizations to make data-driven decisions that enhance overall effectiveness. For those interested in furthering their knowledge, use code FABINSIDER to save $400 on registration.
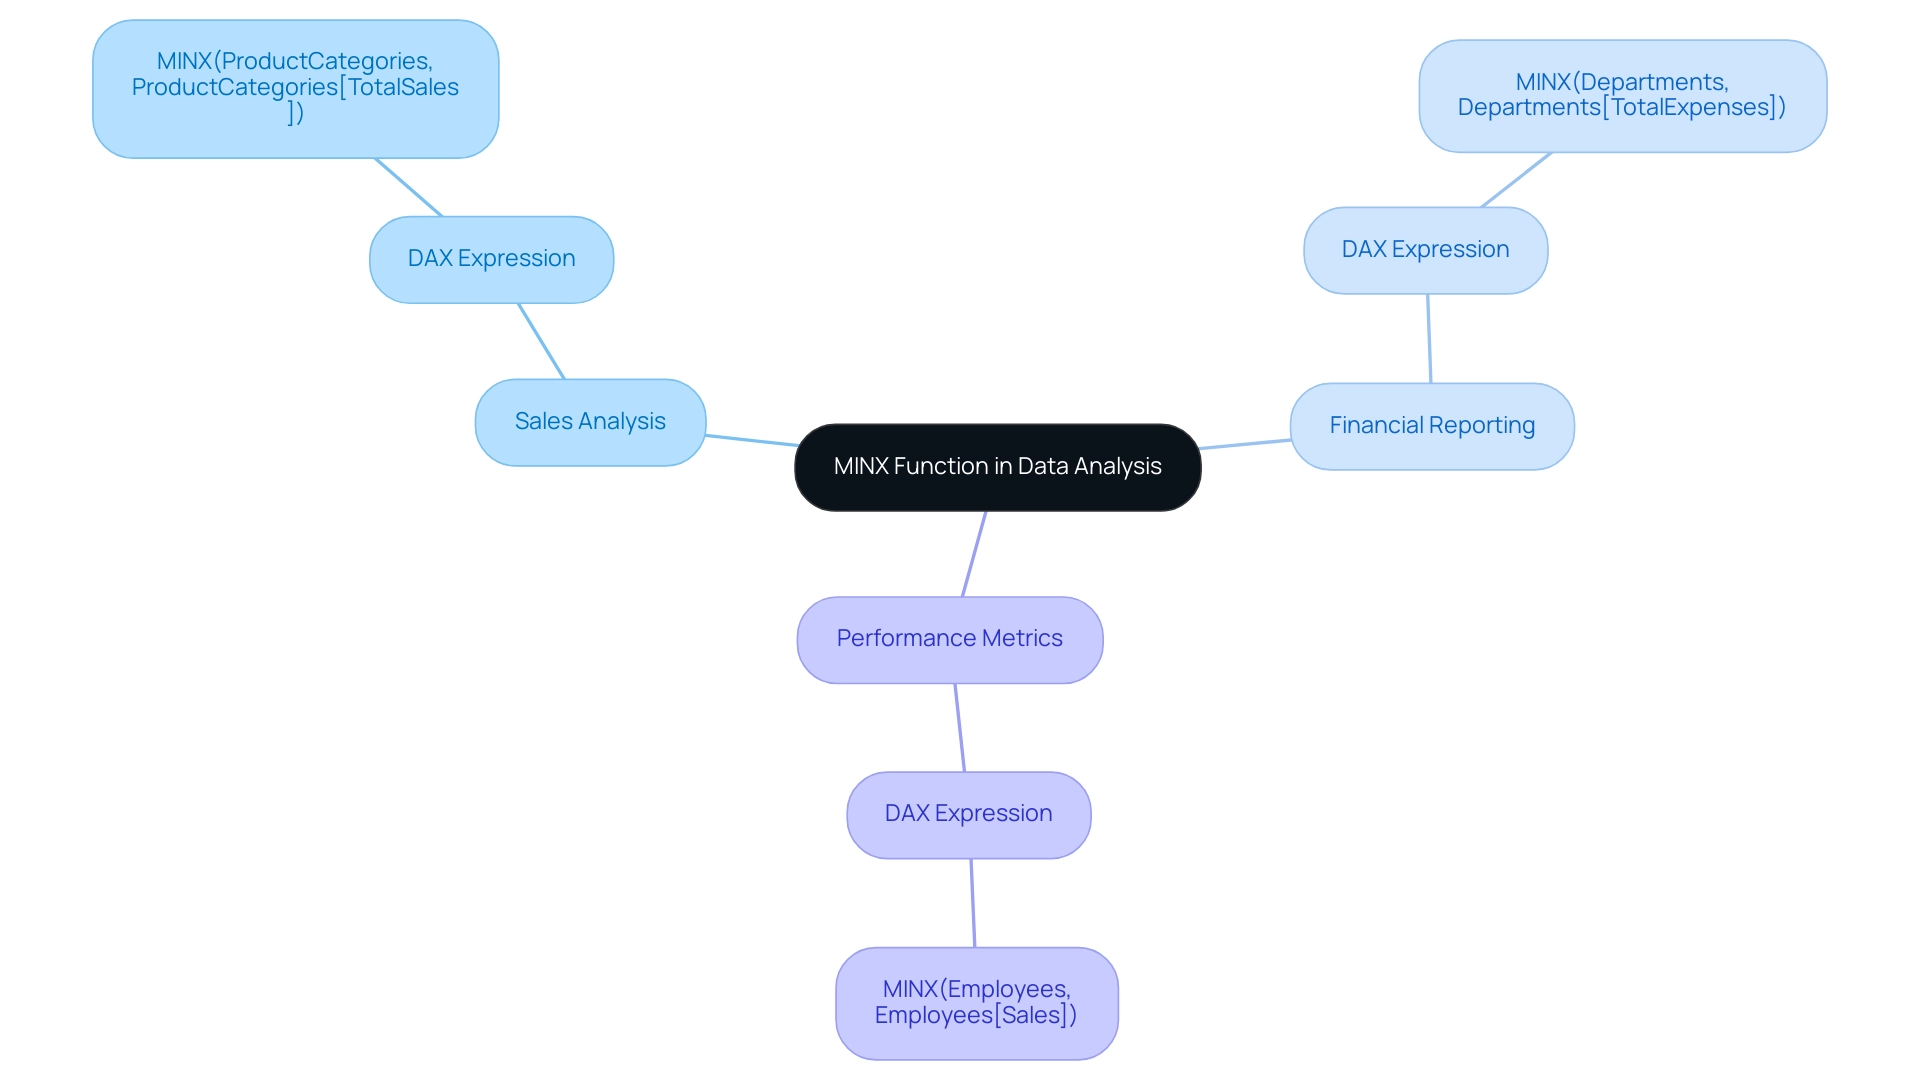
Comparing MINX with Other DAX Functions: When to Use Each
Choosing the suitable DAX MINX tool is crucial for effective data analysis, particularly when leveraging Business Intelligence and RPA to drive operational efficiency and data-driven insights. Below is a detailed comparison of MINX with other related functions:
-
MINX vs. MAXX: MINX evaluates an expression across rows to return the smallest value, while MAXX identifies the largest. This tool is essential for scenarios where pinpointing minimum values is critical, such as assessing the lowest sales figures in a dataset. Conversely, MAXX is beneficial for determining peak performance metrics, which can be vital in identifying areas for improvement in operational efficiency.
-
AVERAGEX vs. AVERAGEX: AVERAGEX focuses on determining the minimum value, while AVERAGEX calculates the average of a collection of values. For instance, if you analyze employee performance and wish to highlight the lowest achiever, this function is the one to use. In contrast, AVERAGEX provides insights into overall performance trends, making it suitable for broader assessments. This distinction is crucial, as businesses often face challenges in leveraging insights from Power BI dashboards, such as time-consuming report creation and data inconsistencies.
-
Function A vs. SUMX: While Function A identifies the minimum value from a dataset, SUMX aggregates values to provide a total sum. Use SUMX when calculating total sales or expenses, while the function for determining the minimum sales figure in a given period should be your go-to. Grasping these distinctions is vital for making informed decisions in your analysis tasks, especially when aiming to enhance business growth through actionable insights.
For example, a recent case study titled “Business Intelligence Empowerment” demonstrated how a business utilized DAX MINX to identify the lowest-performing product line, leading to strategic adjustments that improved overall sales performance. Furthermore, as Jan Mulkens observed, interacting with sample information can significantly enhance the analysis process: “Hi @Anonymous, This is a very interesting question.” Could you provide some sample data as @dkay84_PowerBI requested? This would enable us to assist you in developing the requested measures by referencing the correct tables/fields and DAX expressions.
Moreover, for those seeking to deepen their understanding of DAX capabilities, the upcoming FabCon Vegas event offers valuable training opportunities, including a $400 discount using the code FABINSIDER. By leveraging the right DAX MINX functions and engaging with available resources, analysts can extract meaningful insights that drive growth and innovation, ultimately addressing the challenges faced in utilizing Power BI dashboards effectively. Furthermore, integrating solutions like EMMA RPA and Power Automate can streamline processes, reduce report creation time, and enhance data consistency, making it easier to derive actionable insights from your data.
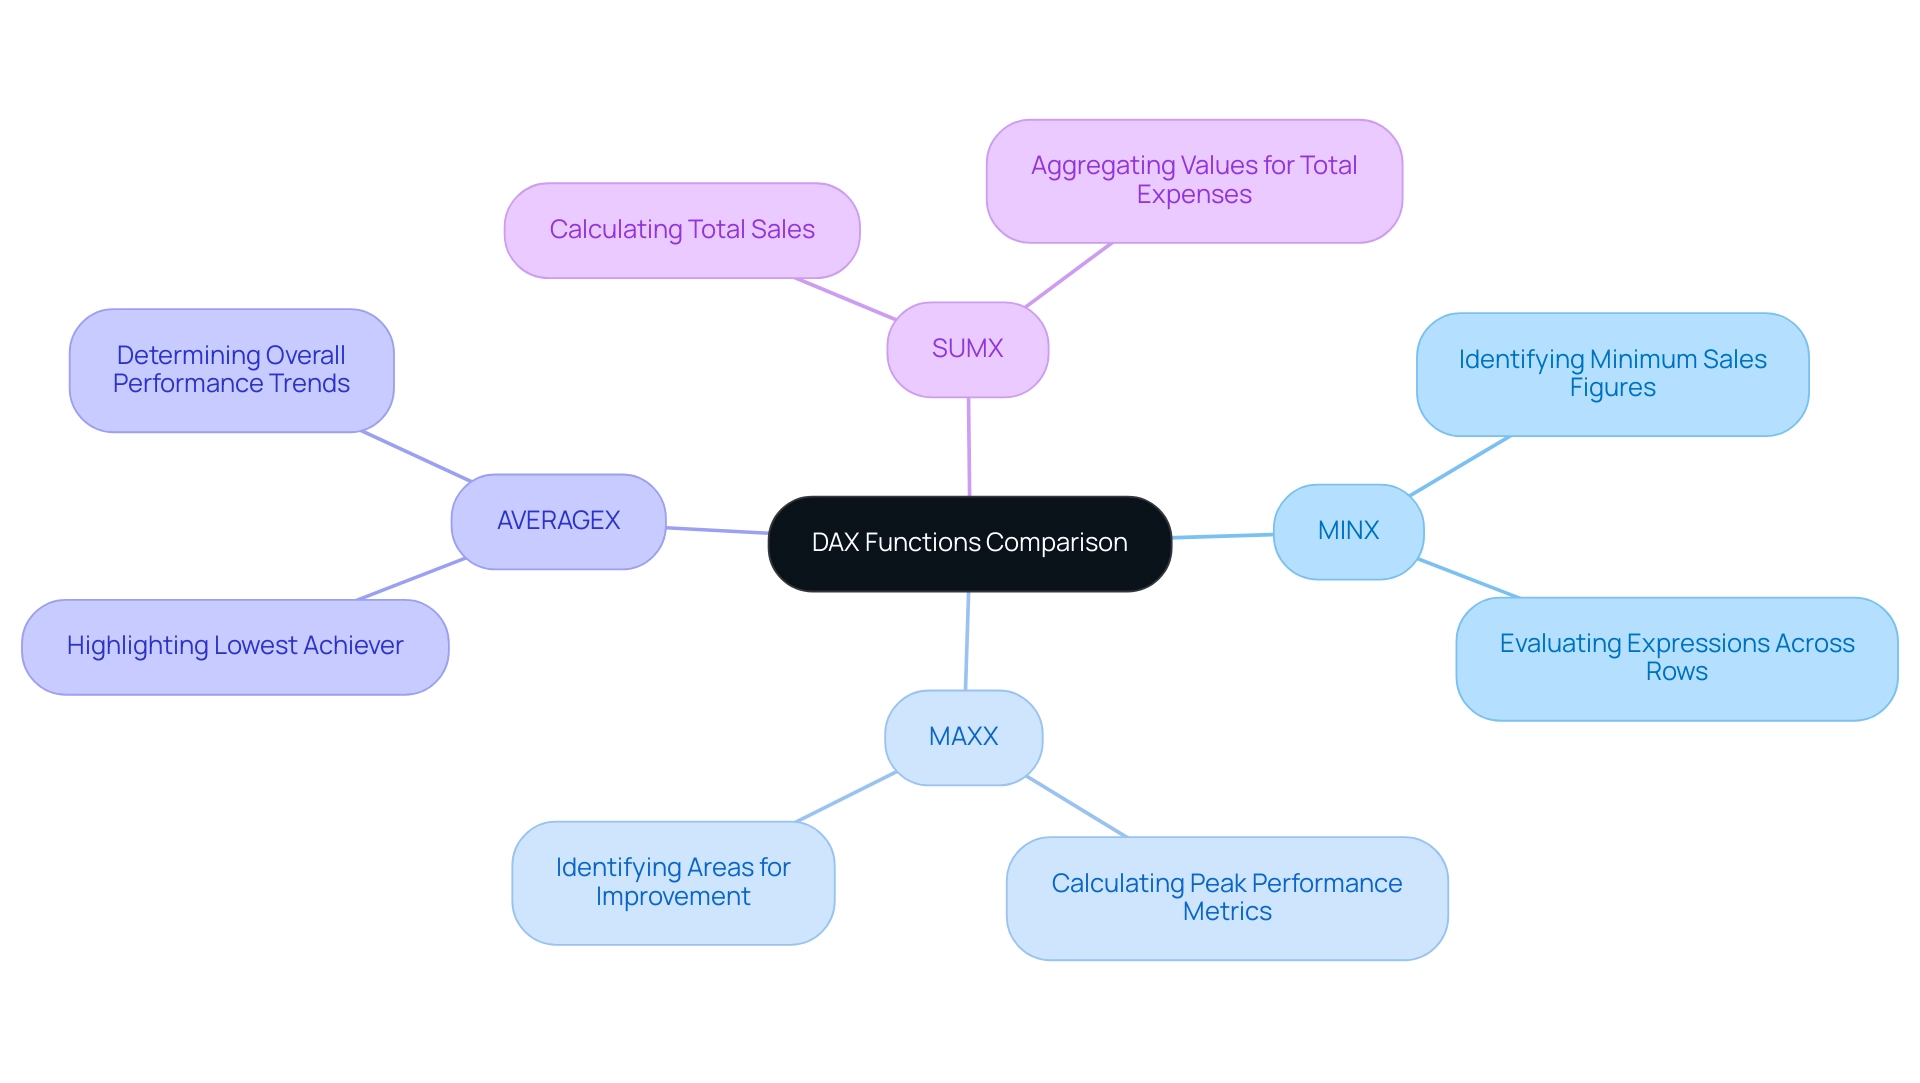
Conclusion
In the dynamic landscape of data analysis, the DAX MINX function emerges as an indispensable tool for extracting valuable insights from complex datasets. By evaluating expressions across rows within a specified table, MINX empowers analysts to pinpoint the smallest values, thereby facilitating informed decision-making and strategic planning. Its applications span sales analysis, financial reporting, and performance metrics, showcasing its versatility across various business contexts.
Mastering the MINX function is crucial, especially as organizations increasingly prioritize the quality of insights over sheer data volume. Leveraging MINX allows businesses to uncover critical trends and patterns, enabling data-driven decisions that enhance operational efficiency and drive growth. Case studies and expert opinions underscore that the function not only streamlines analysis but also supports the implementation of advanced strategies through integration with tools like Robotic Process Automation (RPA).
Ultimately, effectively utilizing the MINX function alongside other DAX functions is essential for any data analyst navigating today’s data-rich environments. As organizations confront challenges related to data consistency and quality, MINX remains a cornerstone in the toolkit of those striving to harness the full potential of their data for sustainable business success.
Frequently Asked Questions
What is the DAX operation and what does it do?
The DAX operation serves as a powerful iterator that evaluates a specified expression for each row in a designated table, ultimately yielding the smallest value derived from that assessment.
Why is the DAX function important for analysts?
The DAX function is essential for analysts as it allows for calculations across multiple rows to determine a minimum value based on dynamic expressions, facilitating informed decision-making.
Can you provide an example of how DAX is used in practice?
An example is using DAX to identify the lowest sales figure for each product category in a sales table, where analysts can iterate through the rows, evaluate sales figures, and extract the minimum value.
How is the significance of DAX expected to evolve by 2025?
The importance of the DAX function is expected to grow, with its applications expanding across diverse analytical scenarios, particularly as organizations increasingly depend on it for precise evaluations of information sets.
What shift is occurring in the Data & Analytics field according to expert perspectives?
There is a shift towards prioritizing the quality of insights over merely processing large volumes of information, emphasizing the significance of delivering actionable insights that can drive business growth and innovation.
What does the case study titled ‘Business Intelligence Empowerment’ illustrate?
The case study exemplifies how organizations use the DAX MINX tool to extract meaningful insights through business intelligence, transforming raw data into actionable insights for informed decision-making.
What Power BI services are mentioned that enhance reporting?
The 3-Day Power BI Sprint and the General Management App are tailored to enhance reporting and ensure consistency, addressing challenges like time-consuming report generation and inconsistencies.
How does the DAX MINX function improve reporting capabilities?
By employing the DAX MINX function, analysts can convert raw data into valuable insights, ensuring stakeholders receive accurate and relevant information to inform strategic decisions.
What role does DAX play in conjunction with RPA solutions?
The DAX calculation remains a cornerstone for unlocking the full potential of insights, particularly when used alongside RPA solutions like EMMA, which enhance operational efficiency and productivity.
Overview
Microsoft’s new AI model captures attention by significantly enhancing operational efficiency. It automates routine tasks and analyzes workflows to identify bottlenecks, thus freeing human resources for strategic initiatives. This model employs advanced algorithms and Robotic Process Automation (RPA) to streamline operations. By reducing costs, it empowers organizations to leverage data-driven decision-making for sustained competitive advantage.
Consider how this technology could transform your operations. The detailed insights provided in the article illustrate the practical applications of these advanced tools. With the ability to analyze workflows, organizations can pinpoint inefficiencies and implement targeted improvements. This not only optimizes processes but also fosters a culture of continuous improvement.
Ultimately, embracing this AI model positions organizations to thrive in a competitive landscape. By harnessing the power of automation and data analysis, businesses can focus on strategic initiatives that drive growth and innovation. The potential for enhanced decision-making capabilities is immense, making this an essential consideration for forward-thinking leaders.
Introduction
In a world where operational efficiency can make or break a business, Microsoft’s new AI model emerges as a game-changer. This innovative tool is poised to revolutionize how organizations manage their workflows. By harnessing advanced algorithms and machine learning, it promises to streamline processes, minimize bottlenecks, and automate mundane tasks. As a result, teams can redirect their focus toward strategic initiatives.
As companies increasingly rely on data-driven insights to maintain a competitive edge, the integration of such AI technologies becomes essential. Real-world case studies illustrate the transformative power of automation, showcasing how organizations can enhance productivity and drive growth. It is time for businesses to embrace these advancements in an ever-evolving landscape.
The Significance of Microsoft’s New AI Model for Operational Efficiency
Microsoft has unveiled an AI model that comprehensively understands diverse organizational activities, representing a significant leap forward in efficiency. By utilizing sophisticated algorithms and machine learning techniques, this model meticulously analyzes workflows, identifying bottlenecks and recommending optimizations. Its primary advantage lies in automating routine tasks through Robotic Process Automation (RPA), which frees human resources to concentrate on strategic initiatives that drive growth.
This transition not only enhances productivity but also substantially reduces expenses, positioning the AI model as an essential resource for entities striving to excel in a competitive environment.
As the reliance on data-driven decision-making intensifies, the incorporation of such AI models is becoming vital for maintaining a competitive edge and fostering innovation. Current statistics reveal that 65% of organizations are either utilizing or actively exploring AI technologies in data and analytics, as noted by Amani Undru, BI & Data Strategist at ThoughtSpot. This underscores the urgency for businesses to adopt these advancements.
Moreover, with 30% of business proprietors expecting AI’s involvement in creating website content, the potential for AI to evolve from a simple productivity booster to a transformative force is evident.
Case studies illustrate the tangible benefits of AI in functional effectiveness. For instance, advancements in hardware, including specialized chips, have significantly enhanced AI performance, enabling real-time applications across various sectors. These innovations empower enterprises to adopt robust AI solutions, such as EMMA RPA and Microsoft Power Automate, which improve customer service and scalability, particularly during peak demand periods.
As leaders are encouraged to establish bold AI commitments, focusing on human-centric development will be crucial to transforming AI into a tool that not only enhances productivity but also amplifies human agency in the workplace.
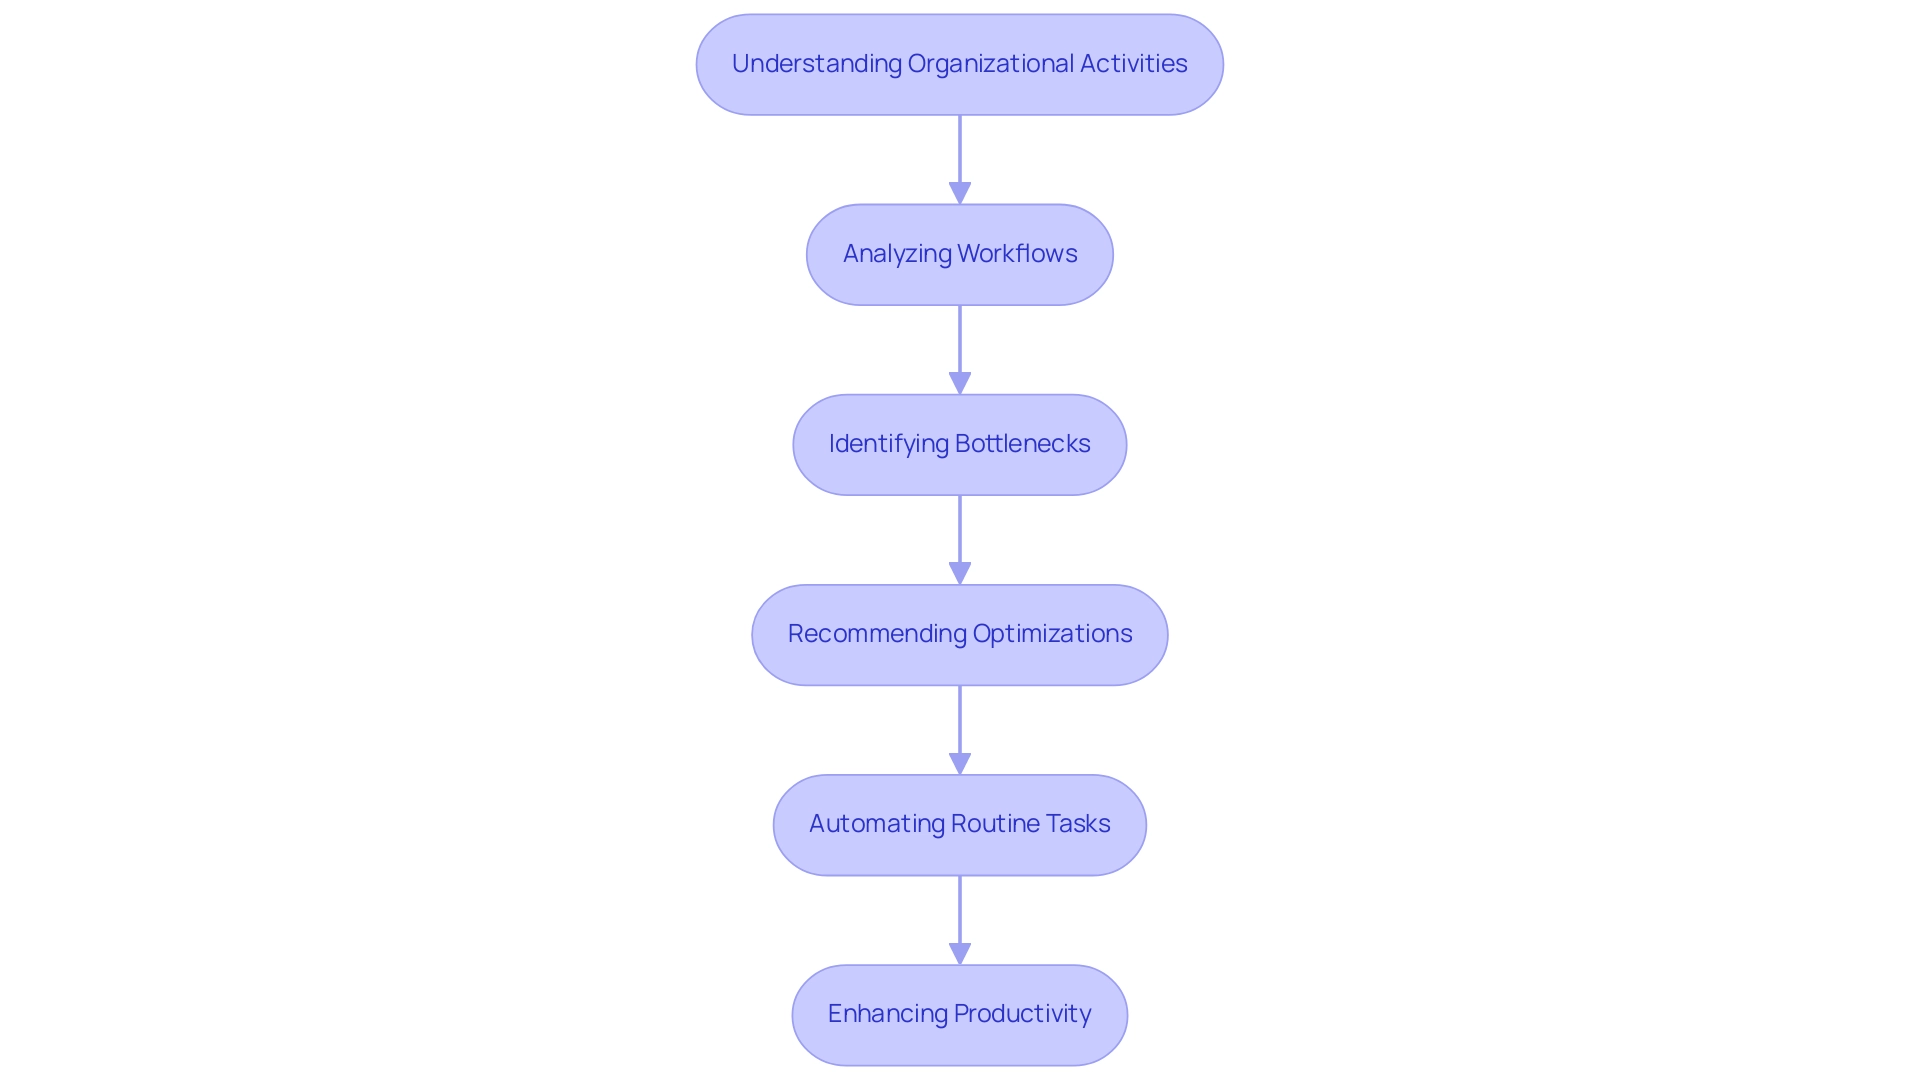
Identifying Challenges in Operational Efficiency
Organizations today face numerous obstacles that significantly impede performance. Among the most prevalent issues are manual, repetitive tasks that drain valuable time and resources, along with employee resistance to change and inadequate integration of existing systems. These factors contribute to rising operational costs and diminished productivity.
Recent statistics reveal a stark disconnect: while 74% of leaders claim to involve employees in creating change strategies, only 42% of employees feel genuinely included in these initiatives. This gap can stifle progress.
The rapid pace of technological advancement further complicates matters, often overwhelming teams as they struggle to adapt to new tools and processes. For instance, in 2024, 67% of businesses reported utilizing process automation to enhance visibility across their systems; yet many still grapple with transforming unstructured data into actionable insights. Firms like Tesla illustrate the possibilities of hyper-automation, combining AI and IoT to achieve significant cost savings and improved production effectiveness, reinforcing the trend of automation within business strategies.
A compelling case study showcases how a mid-sized company, Creatum GmbH, effectively addressed these challenges by adopting GUI automation. By automating data entry, software testing, and legacy system integration, the company reduced data entry errors by 70%, accelerated testing processes by 50%, and improved workflow efficiency by 80%. This transformation not only simplified operations but also yielded a return on investment within six months, demonstrating the tangible benefits of automation in enhancing efficiency.
Recognizing these challenges is essential for organizations seeking to implement effective solutions. Microsoft has unveiled an AI model that comprehends how Quantive StrategyAI serves as a transformative tool, assisting organizations in aligning strategic goals and enhancing decision-making through data insights. Additionally, Enate’s AI-driven workflows provide a comprehensive solution for managing and optimizing workflows, further boosting overall performance.
By leveraging such innovations, organizations can streamline operations and empower their teams to concentrate on strategic, value-adding activities, ultimately driving growth and innovation.
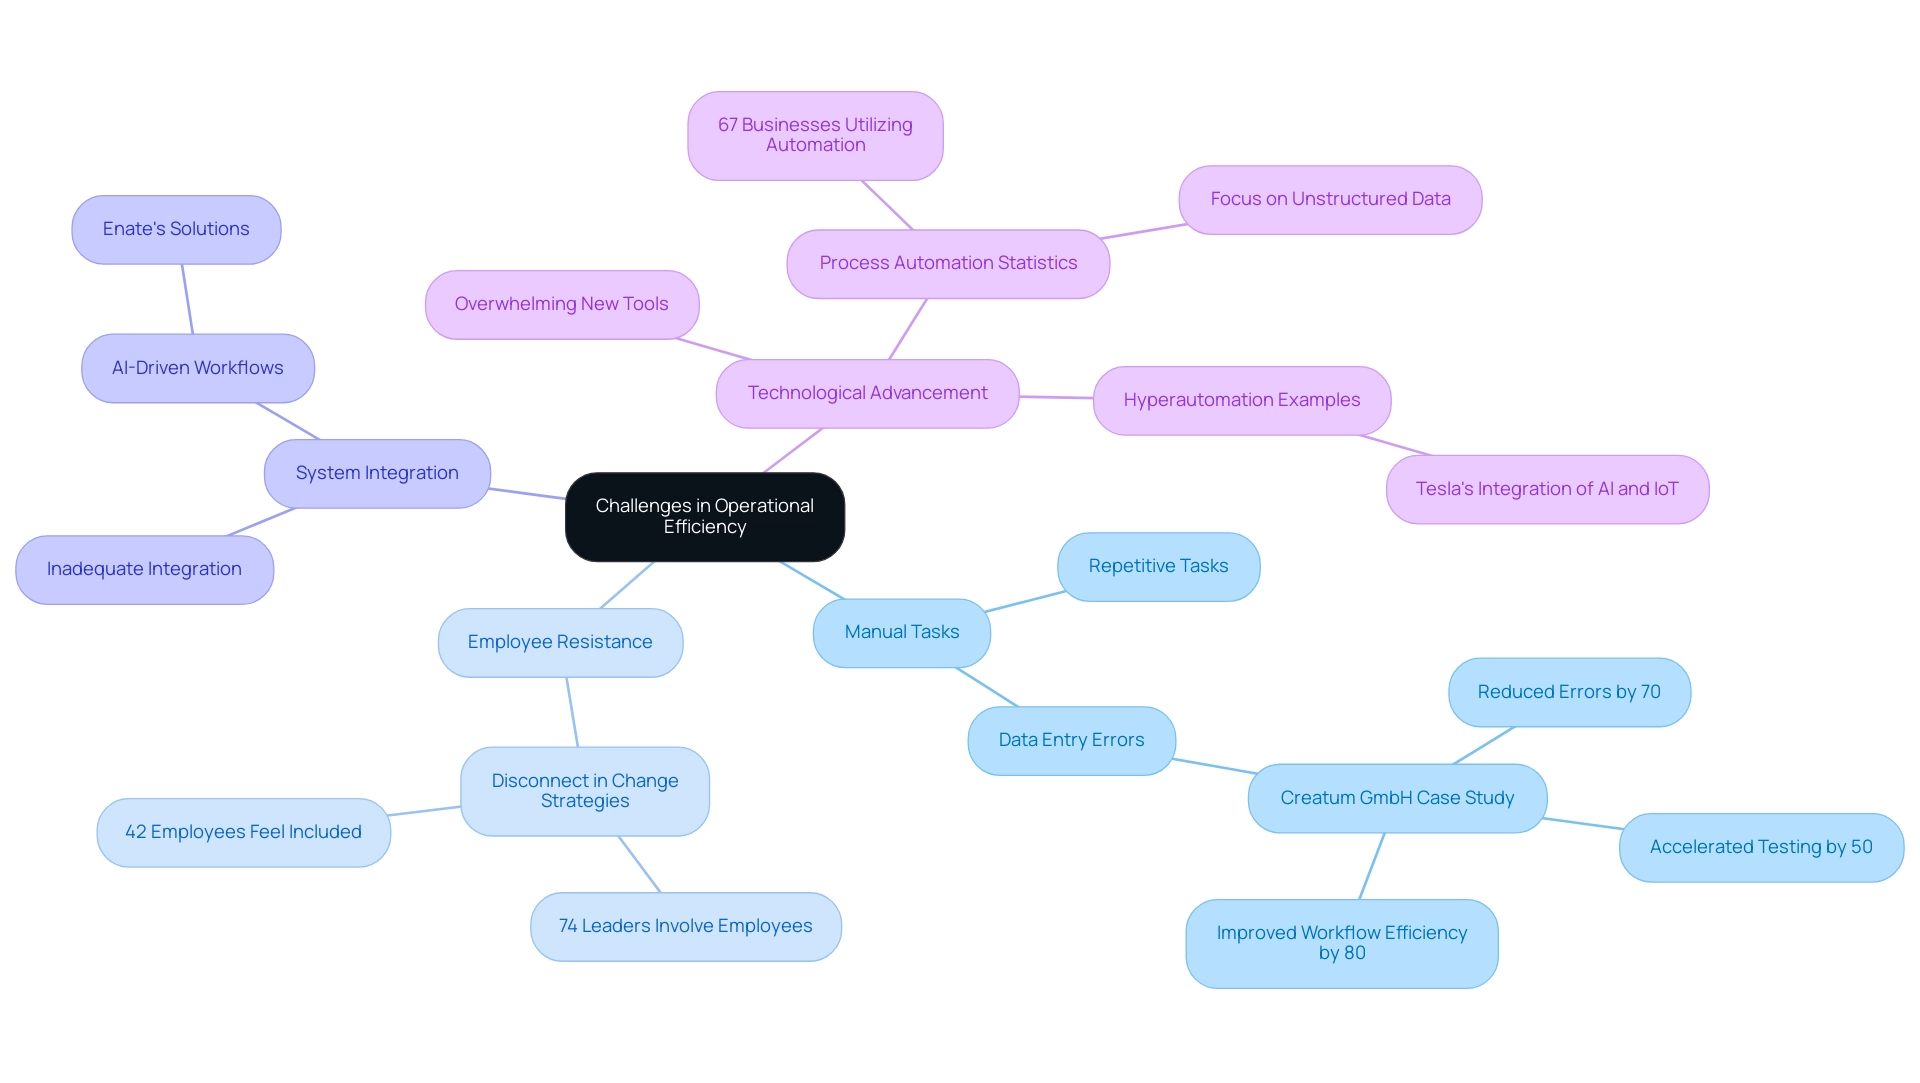
Leveraging Robotic Process Automation to Enhance Efficiency
Robotic Process Automation (RPA) stands as a pivotal solution for enhancing operational efficiency by automating repetitive tasks that have traditionally burdened employees. In today’s fast-paced work environment, companies grapple with challenges such as staffing shortages and outdated systems that hinder productivity. By adopting RPA, organizations can streamline workflows, significantly reduce human error, and cut processing times.
Consider routine tasks such as data entry, invoice processing, and report generation. These can be automated, freeing teams to concentrate on higher-value activities that leverage human judgment and creativity. The benefits of RPA extend beyond mere efficiency gains. Recent statistics reveal that over 90% of small and medium-sized businesses (SMBs) are contemplating AI and automation services to bolster their competitive edge. In the finance and banking sectors, where RPA adoption is particularly robust, 65% of firms plan to increase their automation investments.
This trend is propelled by substantial time and cost savings associated with RPA; 79% of finance companies report time savings, while 61% have experienced cost reductions. Furthermore, a report by PwC predicts a necessary reshaping of finance roles through automation, underscoring the transformative impact of RPA in this sector.
Moreover, the integration of RPA not only enhances accuracy but also significantly boosts employee satisfaction. By eliminating mundane tasks, RPA fosters a more engaged and productive workforce, allowing employees to focus on strategic initiatives. As organizations strive to optimize their operations and combat the challenges of repetitive tasks and staffing shortages, RPA emerges as a critical component of their digital transformation strategies, reshaping roles and enhancing collaboration across teams.
The ongoing evolution of RPA technology promises to further revolutionize operational workflows, making it an indispensable tool for businesses aiming to thrive in a data-rich environment. Significantly, the high percentage of manual processes still in place indicates untapped potential for further improvements.
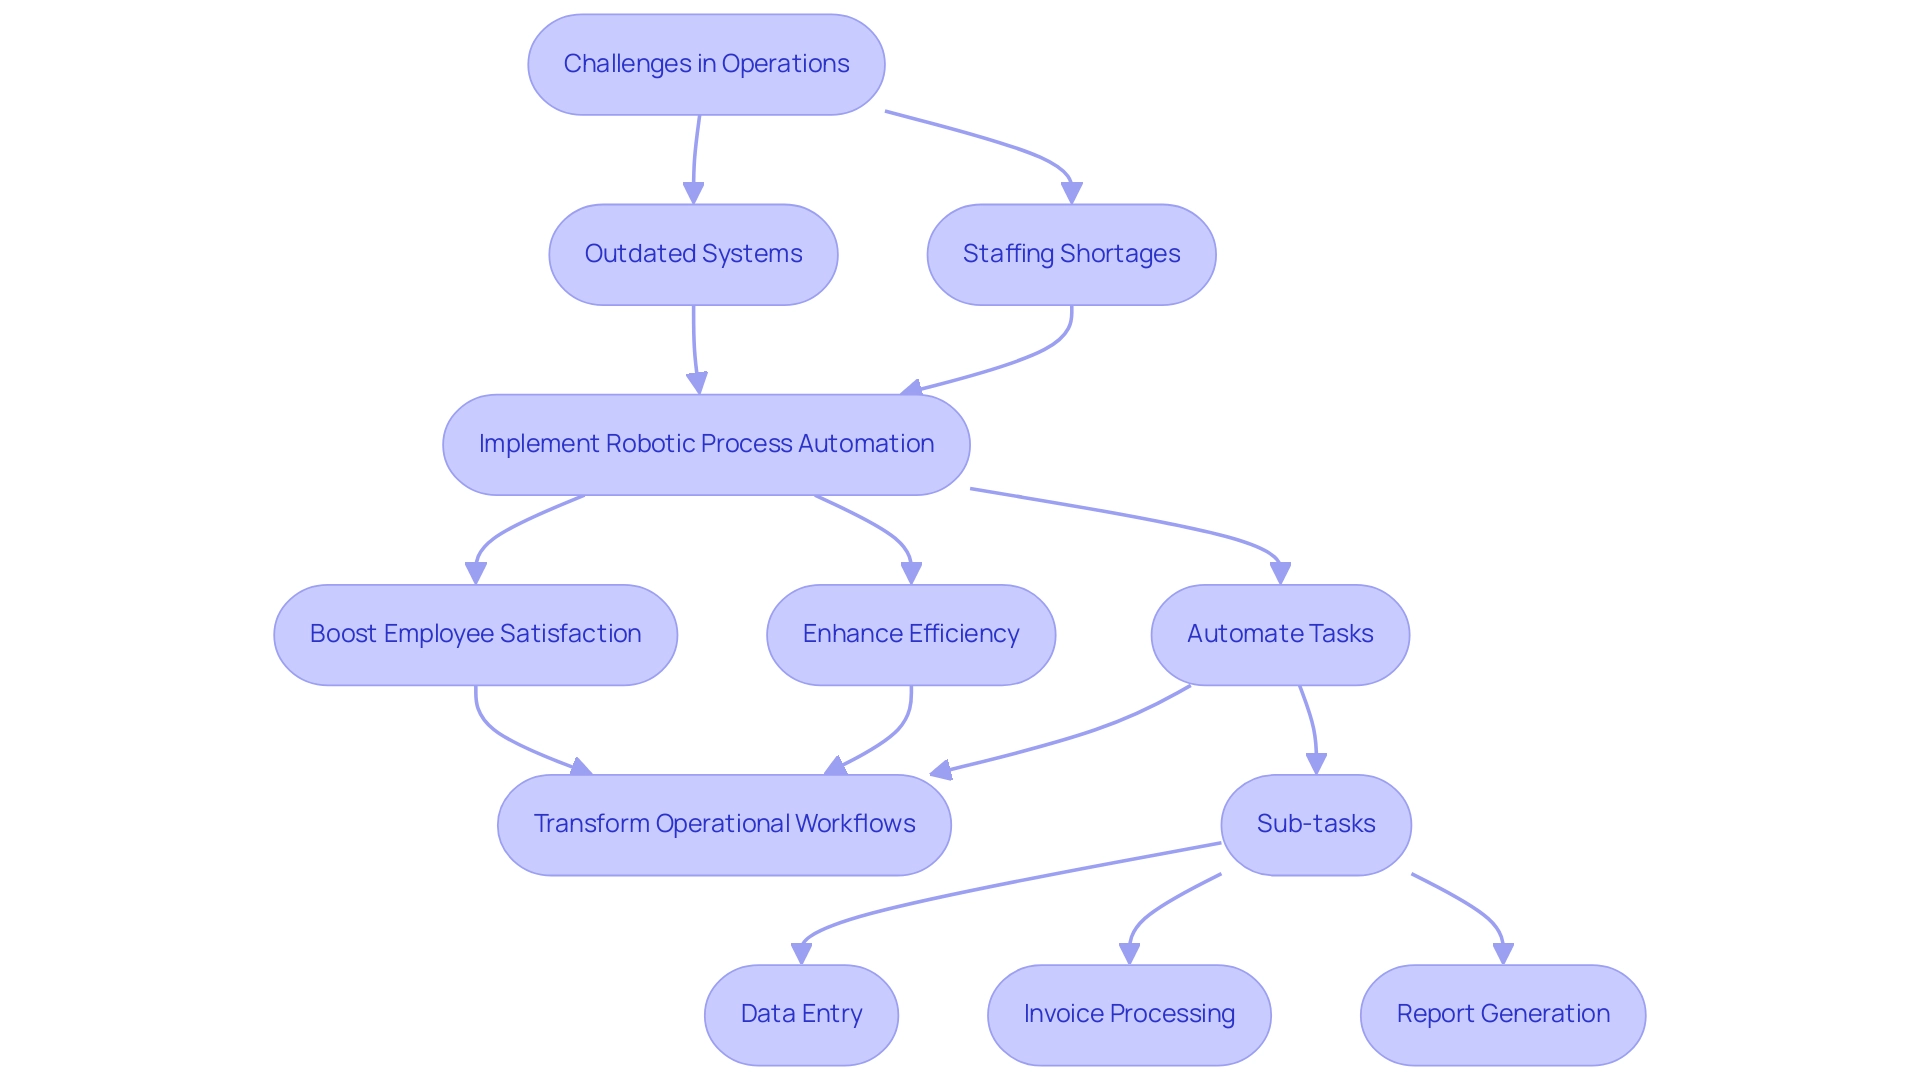
Tailored AI Solutions: Simplifying Technology Adoption for Businesses
Navigating the intricate landscape of artificial intelligence can be overwhelming for many entities, highlighting the necessity of tailored AI solutions for effective technology adoption. By customizing AI applications to meet specific business requirements, companies like Creatum GmbH can ensure these technologies support their functional goals and significantly enhance overall productivity. For example, a retail company may benefit from an AI solution designed to optimize inventory management, while a financial institution could leverage AI to improve compliance processes.
Moreover, the integration of Robotic Process Automation (RPA) can further streamline manual workflows, reducing errors and freeing up valuable resources for more strategic tasks. This synergy between RPA and tailored AI solutions not only enhances efficiency but also creates a robust framework for productivity. As Satya Nadella, chairman and CEO of Microsoft, articulated, “For the first time, we have the access to AI that is as empowering as it is powerful.”
Recent statistics reveal that 51 percent of executives anticipate that generative AI will contribute to a revenue increase of over 5 percent within the next three years, underscoring the potential financial benefits of customized implementations.
However, case studies indicate that while organizations are experimenting with generative AI tools, the tangible impact on bottom-line results remains limited, as noted in the study titled ‘Gen AI Deployment and Value Creation.’ This observation suggests that many are still in the early stages of realizing the full potential of these technologies. It reinforces the notion that customized AI applications, alongside RPA and Business Intelligence, are not merely advantageous but essential for achieving meaningful operational improvements and maximizing return on investment.
As companies embark on their digital transformation journeys, the significance of tailored AI solutions becomes increasingly apparent, acting as a catalyst for enhancing productivity and fostering innovation.
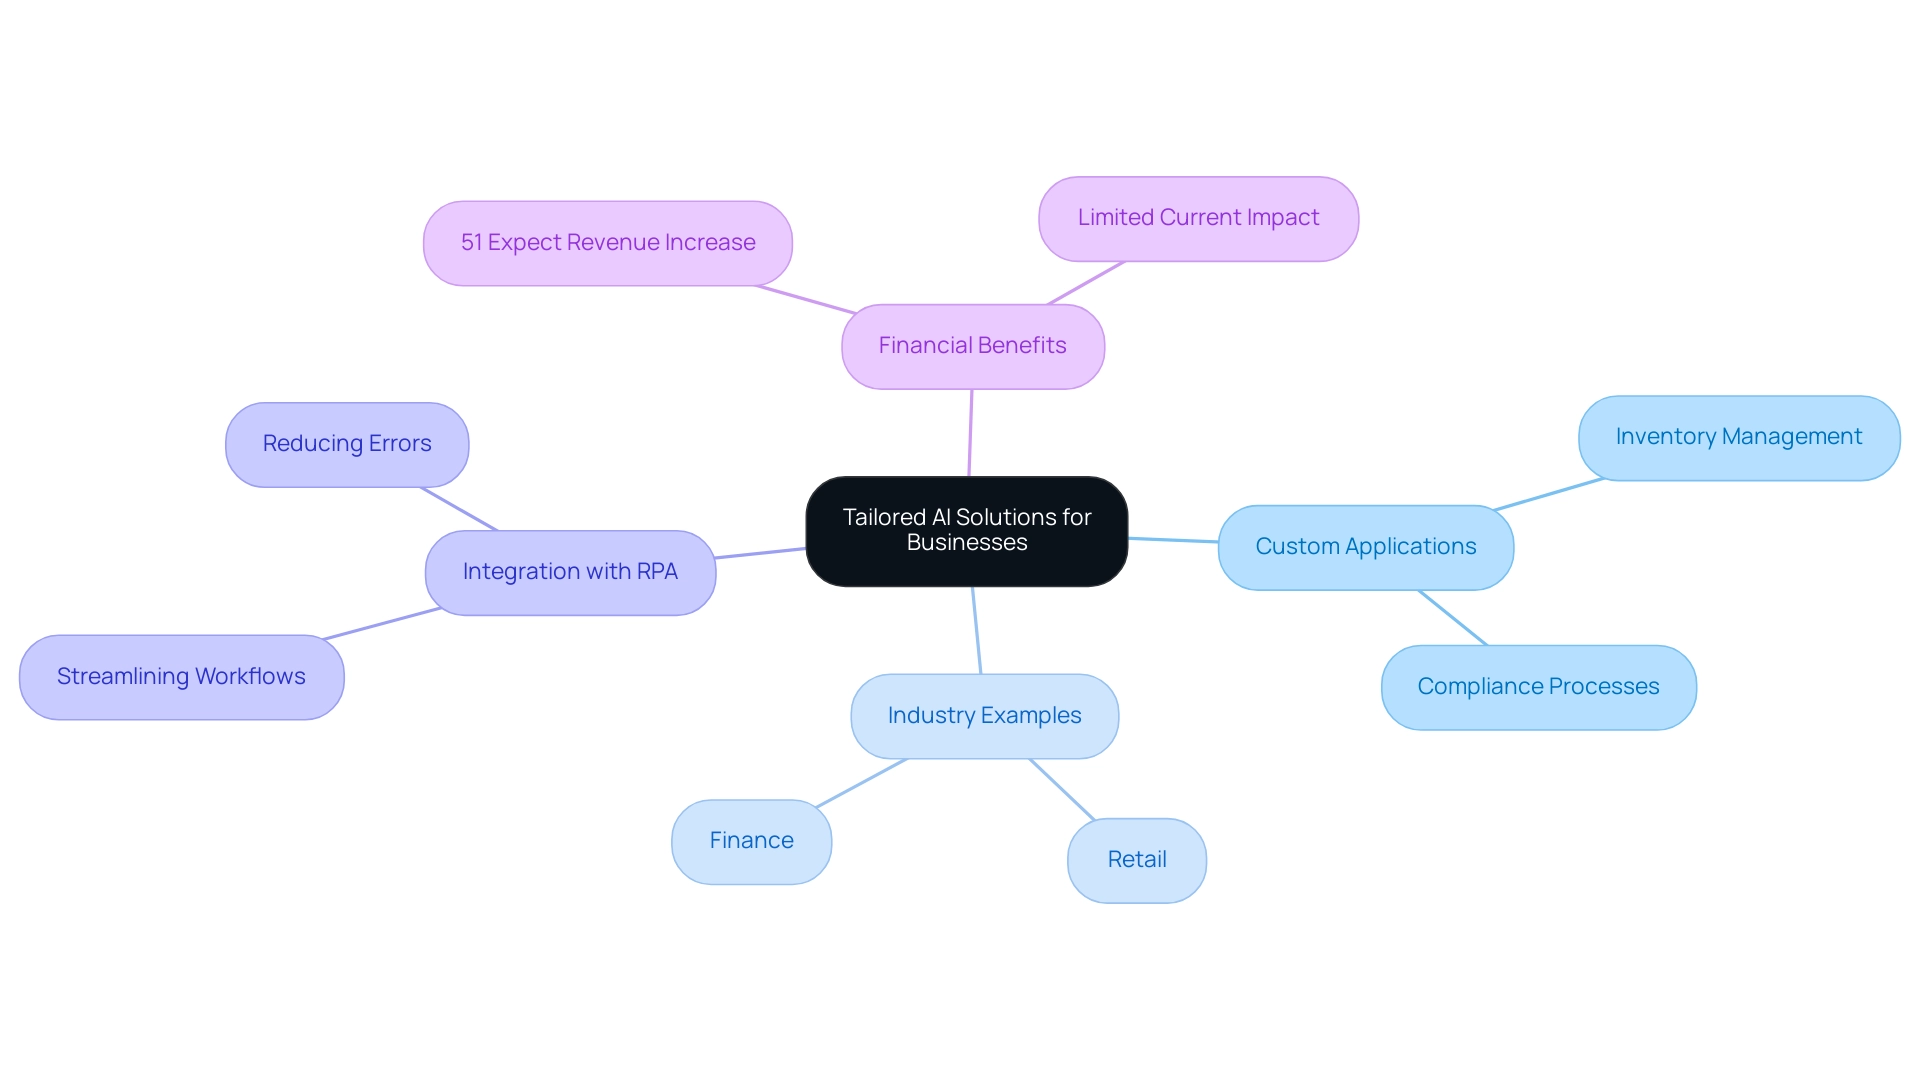
Transforming Data into Actionable Insights for Informed Decision-Making
In today’s data-rich environment, the ability to transform raw information into actionable insights is crucial for effective decision-making. Microsoft has introduced an AI model that comprehends extensive datasets, playing a pivotal role in this transformation by skillfully analyzing patterns that might otherwise remain hidden. By leveraging advanced analytics and machine learning, organizations can gain profound insights into their operations, customer behaviors, and market dynamics.
This data-centric approach empowers businesses to make informed strategic decisions that enhance operational efficiency and foster growth.
In this context, leveraging Robotic Process Automation (RPA) is essential, as it automates manual workflows, significantly boosting productivity and minimizing errors. For instance, predictive analytics enables organizations to anticipate customer needs, optimize resource allocation, and elevate overall performance. A noteworthy statistic reveals that 58 percent of HR leaders have reported productivity improvements due to AI integration, underscoring the tangible benefits of data-driven strategies.
Moreover, the financial services sector exemplifies this trend; numerous banks and credit unions are actively pursuing digital transformation initiatives. Projections indicate that by 2025, 25% of the insurance industry will adopt automated processes. This shift highlights the ongoing evolution within the sector, driven by technological advancements.
However, organizations encounter challenges such as employee resistance and a lack of expertise, which can impede their digital transformation efforts. As businesses increasingly rely on data to shape their strategies, the critical importance of effective data transformation becomes clear. As noted by Quantive StrategyAI, “Quantive StrategyAI equips your business to make smarter decisions and stay prepared for the unexpected.”
Organizations that effectively leverage AI for data analysis not only enhance their decision-making capabilities but also position themselves for sustained success in a competitive marketplace. Furthermore, the upcoming WalkMe webinar discussing the Soda 2025 report will provide valuable insights into successful digital adoption strategies, further emphasizing the necessity of staying informed in this rapidly evolving landscape.
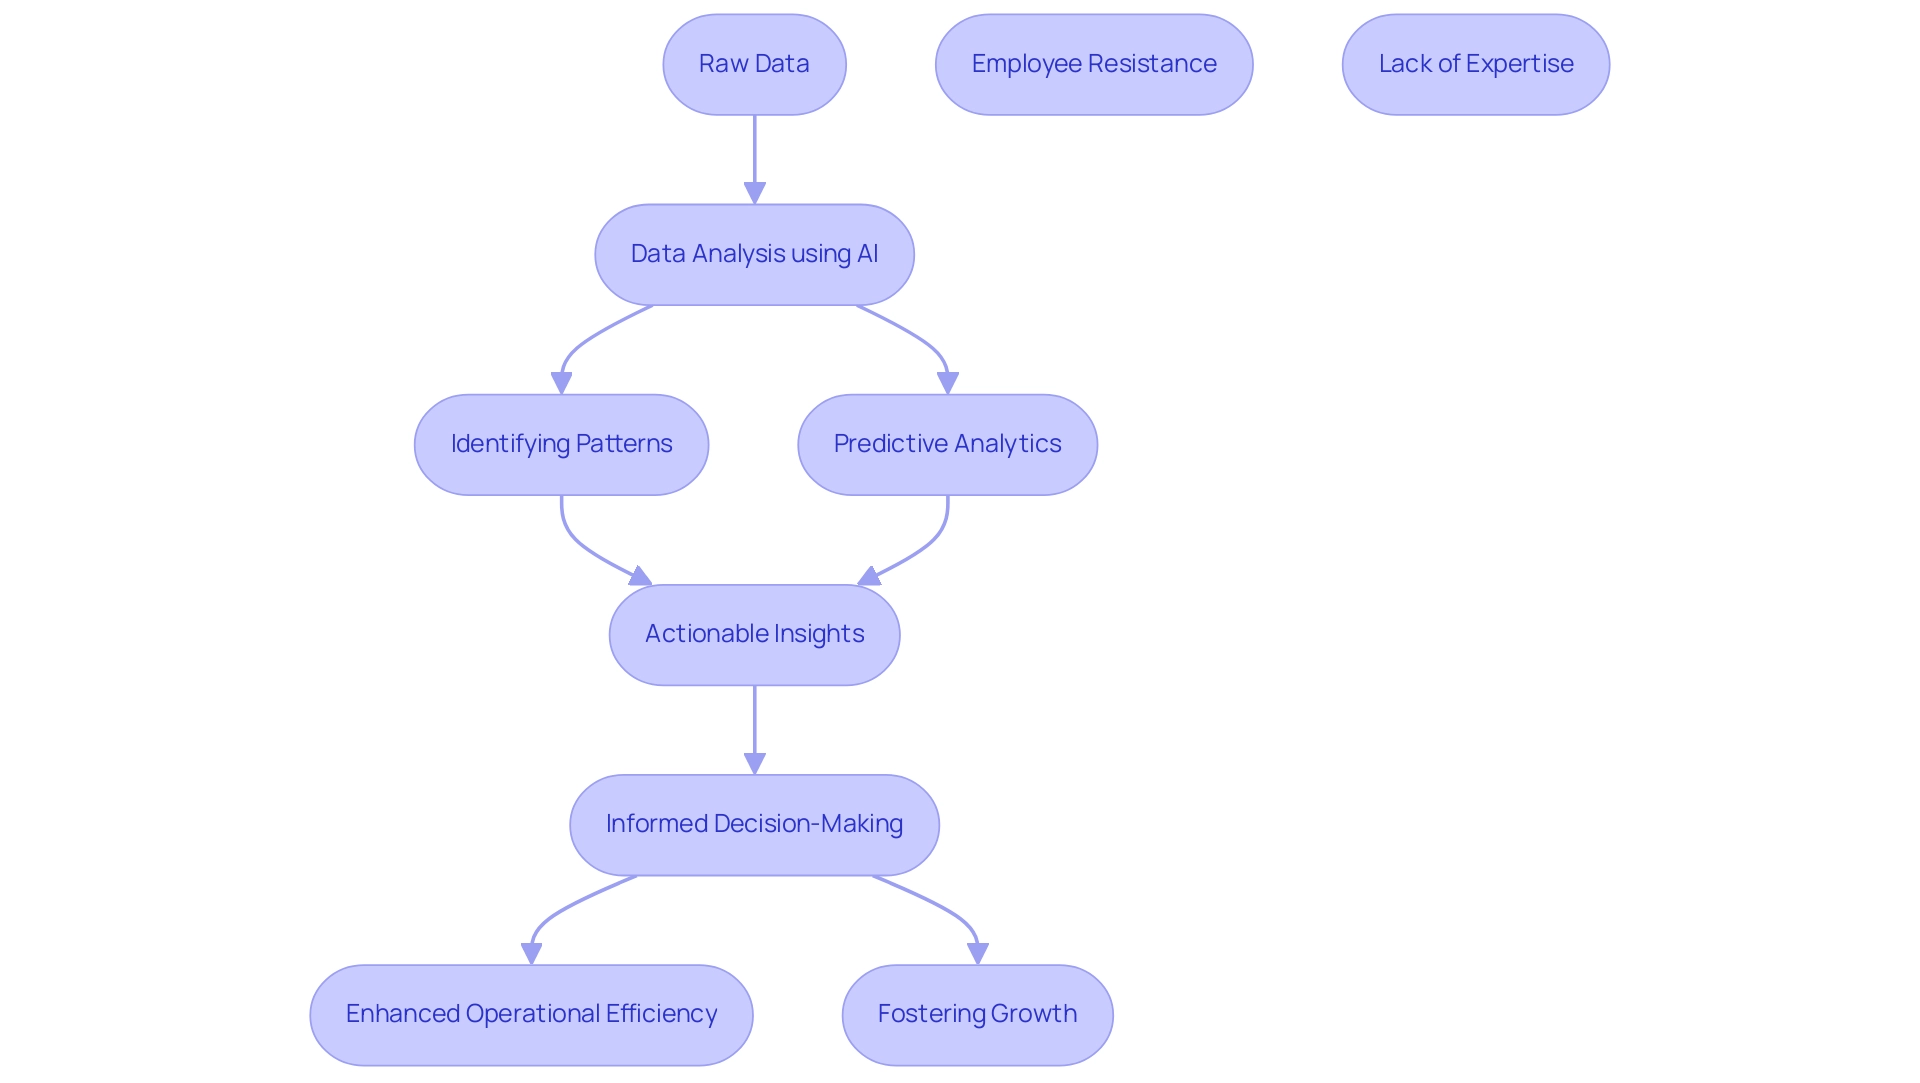
Conclusion
In conclusion, the imperative for businesses to adopt and integrate AI solutions that enhance operational efficiency and foster innovation has never been clearer. By embracing these technologies, organizations can streamline their operations and empower their teams to concentrate on high-value activities that drive growth. The future of work is upon us, fueled by intelligent automation and data-driven decision-making. Are you ready to harness the power of AI and transform your business landscape?
Frequently Asked Questions
What is the main purpose of Microsoft’s newly unveiled AI model?
The AI model aims to comprehensively understand diverse organizational activities, enhancing efficiency by analyzing workflows, identifying bottlenecks, and recommending optimizations.
How does the AI model improve efficiency within organizations?
It utilizes sophisticated algorithms and machine learning techniques to automate routine tasks through Robotic Process Automation (RPA), allowing human resources to focus on strategic initiatives that drive growth.
What are the financial benefits of implementing this AI model?
The model enhances productivity and substantially reduces operational expenses, making it an essential resource for organizations aiming to excel in a competitive environment.
Why is the adoption of AI technologies becoming urgent for businesses?
As reliance on data-driven decision-making increases, incorporating AI models is vital for maintaining a competitive edge and fostering innovation. Currently, 65% of organizations are utilizing or exploring AI technologies.
What is the expected impact of AI on website content creation?
About 30% of business owners expect AI to play a role in creating website content, indicating its potential to evolve from a productivity booster to a transformative force.
Can you provide an example of how AI has improved operational effectiveness?
A case study showed that advancements in hardware and specialized chips have significantly enhanced AI performance, enabling real-time applications across various sectors, such as customer service and scalability during peak demand.
What challenges do organizations face in improving performance?
Common challenges include manual, repetitive tasks, employee resistance to change, and inadequate integration of existing systems, which lead to rising operational costs and reduced productivity.
What is the disconnect between leaders and employees in change strategies?
While 74% of leaders claim to involve employees in creating change strategies, only 42% of employees feel genuinely included, which can hinder progress.
How are businesses addressing the challenges of technological advancement?
Many businesses are utilizing process automation to enhance visibility across systems, but many still struggle to transform unstructured data into actionable insights.
What significant results did Creatum GmbH achieve by adopting GUI automation?
Creatum GmbH reduced data entry errors by 70%, accelerated testing processes by 50%, and improved workflow efficiency by 80%, achieving a return on investment within six months.
What tools are mentioned as part of the AI-driven solutions for organizations?
Tools like Quantive StrategyAI and Enate’s AI-driven workflows are highlighted for assisting organizations in aligning strategic goals and optimizing workflows, thereby boosting overall performance.
